

Abstract
In order to improve our understanding of cancer and develop multi-layered theoretical models for the underlying mechanism, it is essential to have enhanced understanding of the interactions between multiple levels of genomic data that contribute to tumor formation and progression. Although there exist recent approaches such as a graph-based framework that integrates multi-omics data including copy number alteration, methylation, gene expression, and miRNA data for cancer clinical outcome prediction, most of previous methods treat each genomic data as independent and the possible interplay between them is not explicitly incorporated to the model. However, cancer is dysregulated by multiple levels in the biological system through genomic, epigenomic, transcriptomic, and proteomic level. Thus, genomic features are likely to interact with other genomic features in the different genomic levels. In order to deepen our knowledge, it would be desirable to incorporate such inter-relationship information when integrating multi-omics data for cancer clinical outcome prediction. In this study, we propose a new graph-based framework that integrates not only multi-omics data but inter-relationship between them for better elucidating cancer clinical outcomes. In order to highlight the validity of the proposed framework, serous cystadenocarcinoma data from TCGA was adopted as a pilot task. The proposed model incorporating inter-relationship between different genomic features showed significantly improved performance compared to the model that does not consider inter-relationship when integrating multi-omics data. For the pair between miRNA and gene expression data, the model integrating miRNA, for example, gene expression, and inter-relationship between them with an AUC of 0.8476 (REI) outperformed the model combining miRNA and gene expression data with an AUC of 0.8404. Similar results were also obtained for other pairs between different levels of genomic data. Integration of different levels of data and inter-relationship between them can aid in extracting new biological knowledge by drawing an integrative conclusion from many pieces of information collected from diverse types of genomic data, eventually leading to more effective screening strategies and alternative therapies that may improve outcomes.
Introduction
Gene expression profiles have been widely used for predicting clinical outcomes for the diagnosis, treatment, or prognosis of cancer for several years [1–5]. In addition to gene expression at the transcriptome level, there have been many attempts at cancer clinical outcome prediction using different levels of genomic data such as copy number alteration (CNA) at the genomic level, miRNA expression, or DNA methylation at the epigenomic level [6–10]. Despite these efforts, explaining cancer clinical outcomes remains problematic since the cancer genome is neither simple nor independent but is complicated and dysregulated by multiple levels in the biological system through genomic, epigenomic, transcriptomic, proteomic level, etc [11, 12]. In order to improve our understanding of cancer and develop multi-layered theoretical models, it will require an increased understanding of interactions between multiple levels of genomic data that contribute to tumor formation and progression [11].
For overcoming these problems in cancer research, the emerging multi-omics data and clinical information from a collaborative initiative such as the Cancer Genome Atlas (TCGA) have provided many opportunities to explore the complex multi-layered genomic basis of cancer for improving the ability to diagnose, treat, and prevent cancer. TCGA is a large-scale collaborative initiative to improve our understanding of multi-layered of molecular basis of cancer. In addition, the International Cancer Genome Consortium (ICGC) is another comprehensive collaborative initiative to characterize multi-omics data in 50 different cancer types [13]. While the TCGA and ICGC open unprecedented opportunities to deepen the novel knowledge of the molecular basis of cancer [13–22], integrative analysis of multi-omics data is still considered as one of important problems to better explain cancer phenotype, further providing an enhanced global view on interplays between different levels of genomic data.
Previously, we proposed a graph-based framework that integrates multi-omics data for predicting cancer clinical outcomes in glioblastoma multiforme and serous cystadenocarcinoma in an intermediate integration manner [23]. In addition, we have extended the previous framework to integrate genomic knowledge such as pathway or Gene Ontology [24]. The intermediate integration approach has an advantage that a model preserves data-specific properties by trying using optimally-weighted multiple graphs or kernel matrices transformed from multi-omics data as an intermediate level, compared to an early integration approach that combines input matrices before modelling. On the other hands, the late integration approach combines multiple predictive models by training multi-omics data individually in order to obtain the final model such as ensemble technique. The intermediate integration approach results into one prediction with one hypothesis, whereas the late integration approach has multiple independent hypotheses that have to be combined afterward. The strengths of our proposed framework as an intermediate integration approach were also highlighted as initiating its application using multiscale ‘omics analytics, flexibility, and computation efficiency [25]. However, one of the disadvantages of intermediate integration approach is that it is difficult to consider inter-relationship between different levels of genomic data since each data is transformed before the integration as an individual intermediate level such as a graph.
There are possible multiple inter-relationships between different levels of genomic data such as ‘copy number alteration region – genes located in the altered copy number region,’ ‘miRNA – its target genes,’ and ‘DNA methylation site – gene regulated by promoter regions,’ etc (Fig. 1). In order to identify genes that are associated with gene dosage, many integrative analyses between copy number and gene expression have been conducted [26–29]. In addition, miRNA as one of the important regulators of gene expression can be integrated with gene expression to identify the selective inhibition of translation or selective degradation [30–32]. Furthermore, in terms of epigenetic regulation, histone modification or DNA methylation can serve to regulate gene expression in cancer [33–36]. The limitation of previous work was that we integrated multi-omics data for cancer clinical outcome prediction without considering inter-relationship between different levels of genomic features [23]. When integrating inter-relationship between different levels of genomic features, we assume that the prediction accuracy for cancer clinical outcome increases because of information fused over multiple genomic dataset and inter-relationship between them, providing an improved global view on interplays between different genomic levels in cancer mechanisms [11, 37]. Thus, it will be desirable that a framework will be capable of containing the inter-relationship between different levels of genomic data when integrating multi-omics data.
Figure 1.

Inter-relationships between different levels of genomic data. There are six possible inter-relationships between four types of genomic data including CNA, methylation, miRNA, and gene expression. Each genomic data can be converted into a graph where nodes represent patients and edges depict their similarities.
In this study, we propose a new framework that integrates not only multi-omics data but inter-relationship between them in the intermediate integration manner for better elucidating cancer clinical outcomes. In order to highlight the validity of the proposed framework, serous cystadenocarcinoma data from TCGA was adopted as a pilot task. Serous cystadenocarcinoma is the most prevalent form of ovarian cancer, and is the 5th leading cause of cancer mortality in women in the United States [38]. Ovarian cancer patients are likely to be diagnosed with a late stage due to its asymptomatic nature, which are causing poor survival status [39]. Given multi-omics data, inter-relationships from one level to another may lead to some clues that help to uncover an unknown biological knowledge. Integrating multi-omics data and inter-relationship for predicting clinical outcomes will lead to better understand multi-layered genetic determinants of ovarian cancer survival, further allowing for the possibility of leading alternative therapies that may improve outcomes.
Materials and Methods
Data
Normalized multi-omics datasets in ovarian cancer were downloaded from TCGA data portal (http://tcga-data.nci.nih.gov/) (Table 1). Gene expression, miRNA, and methylation data contain 12,042 genes, 799 miRNAs, and 27,578 CpG loci, respectively. In order to use the results of altered regions of deletion or amplification across sets of patients, CNA data was retrieved from cBio Cancer Genomics Portal [40]. CNA data contains 54 significant cytoband regions. A binary classification of short-term and long-term survival was set for a pilot project. In the classification of short-term or long-term survival, ‘short-term’ represents the patients who survived less than 3 years, whereas ‘long-term’ indicates patients who survived longer than 3 years [41]. A total of 258 patients’ records were available across the CNA, methylation, gene expression, and miRNA data sets (N=258) with survival information, in which 110 were short-term survival and 148 were long-term survival.
Table 1.
Data description
| Data type | Platform | # Features |
|---|---|---|
| CNA | Agilent SurePrint G3 Human CGH Microarray Kit 1×1M | 54 cytobands |
| Methylation | Infinium Humanmethylation27 BeadChip | 27,578 CpG loci |
| miRNA | Agilent Human miRNA Microarray Rel2.0 | 799 miRNAs |
| Gene expression | Affymetrix HT Human Genome U133 Array Plate Set | 12,042 genes |
Clinical outcome classification
We used a graph-based semi-supervised learning (SSL) as a classification algorithm, which is a halfway learning scheme between supervised and unsupervised learning [42–45]. One of the strengths of graph-based integration is its computational efficiency because of sparseness properties of input matrix while the accuracy remains comparable to the other methods such as kernel-based integration [46, 47]. In addition, a graph-based SSL enjoys other advantages such as visualization, its relationship with kernel methods, solid mathematical background, and robust results in computational biology [48].
In this study, the common entity of each graph from multi-omics data is a patient (Fig. 1). If two patients were more closely related than to others, we assumed that clinical outcomes of those two patients would be more likely to be similar [4, 49]. Thus, clinical outcome prediction can be conducted by considering similarities between patients based on their genomic profiles such as gene expression. Edges represent similarities between patients extracted from genomic profiles such as gene expression or methylation. An annotated patient is labeled either by ‘−1’ or ‘1’, indicating two possible clinical outcomes, either ‘short-term survival’ or ‘long-term survival’ (Fig. 2). In order to predict the label of the unannotated patient ‘?’, the edges connected from/to the patient play an important role in influencing propagation between the patient and its neighbors. This idea can be easily formulated using graph-based SSL [45]. Technically, the data-setup of our experiment for the binary classification can be rephrased as where xn ∈ Rd (d is the number of features and N is the number of patients) and yn ∈ {−1,1}.
Figure 2.

Schematic overview of integrating different levels of genomic data and inter-relationship (e.g. miRNA and gene expression data)
Graph-based SSL
Here, we present the formulation of the graph-based SSL. In the graph-based SSL, a patient xi (i = 1,…,n) is represented as a node i in a graph, and the relationship between patients is represented by an edge. The edge strength from node j to node i is encoded in element wij of a n×n symmetric weight matrix W. A Gaussian function of Euclidean distance between patients was used to state connection strength:
| (1) |
Nodes i, j are connected by an edge if i is in j’s k-nearest-neighborhood or vice versa. The labeled nodes have labels yl ∈ {−1, 1}, whereas the unlabeled nodes have zeros yu = 0. An output of graph-based SSL is an n-dimensional real-valued vector f = [flTfuT]T = (f1,…,fl, fl+1,…,fn=l+u)T, which can be thresholded to create label predictions on fl=f1,…,fn after learning. Graph-based SSL consists of two main conditions, which are loss condition and smoothness condition. It is assumed that fi should be close to the given label yi in labeled nodes as a loss condition, and overall, fi should not be too different from the fi of adjacent nodes as a smoothness condition. One can obtain f by minimizing the following quadratic functional [42, 44, 45]:
| (2) |
where y=(y1,…,yl, 0,…0)T, and the matrix L, called the graph Laplacian matrix [50], is defined as L = D − W where D = diag(di), di = ∑jwij. The parameter μ trades off loss versus smoothness. The solution of this problem is obtained as
| (3) |
where I is the identity matrix.
Inter-relationship between different levels of genomic data
In order to overcome the disadvantage of intermediate integration, we create another graph that contains inter-relationship between different graphs (Fig. 2). In the Figure 2 as an example of miRNA and gene expression, two graphs can be generated from miRNA and gene expression data, respectively. In addition, another graph containing inter-relationship between miRNA and its target genes can be generated as well. If information from inter-relationship graph is regarded as complementary to original graphs from miRNA or gene expression, the prediction accuracy through the integration three graphs will increase. Even though relations between miRNA and gene expression, between CNA and gene expression, or between methylation and gene expression have been investigated from several studies [26–36], to the best of our knowledge, there are few integrative studies between CNA and methylation, between CNA and miRNA, or between miRNA and methylation. In our study, nevertheless, we conducted all possible inter-relationships between four different genomic data, CNA, methylation, gene expression, and miRNA (Fig 1).
miRNA – Gene expression (RE)
CNA – Gene expression (CE)
Methylation – Gene expression (ME)
CNA – Methylation (CM)
CNA – miRNA (CR)
Methylation – miRNA (MR)
In order to get inter-relationship between miRNA and gene expression (RE) from interaction knowledge, we used miRecords, which is integrated resources of miRNA that store target interactions produced by 11 established miRNA target prediction programs [51]. We created 10 variations for predicted target pairs between miRNA and its target genes by considering the number of positive voters from the included algorithms by miRecords in order to reduce false positives from 11 miRNA target prediction sources (Supplementary Table 1). Because most of the evaluation results from these variations were largely comparable, the most representative variation # 6 in Supplementary Table 1 was used to get inter-relationship between miRNA and its target genes for further study. For the inter-relationship between CNA and gene expression (CE), we used the chromosomal positional information of multiple genes in a specific CNA region since gene dosage from either deletion or duplication can affect gene expression. We considered a cis acting of methylation probe with respect to a given gene expression within 500kb interval between methylation probe and genes for the inter-relationship between methylation and gene expression (ME) [52]. For the inter-relationships between CNA and methylation (CM) or between CNA and miRNA (CR), we also used the chromosomal positional information that the relation was set if miRNA or methylation probe are within CNA region. In addition, for the inter-relationship between methylation and miRNA (MR), an indirect mapping strategy through common genes was adopted because there is no known interaction knowledge between them. The relation between methylation and miRNA (MR) was set if a targeted gene from a specific miRNA is also shared by a specific methylation probe as a candidate cis-acting regulation.
Weight matrix incorporating inter-relationship
To calculate a weight matrix (W) containing inter-relationship between different levels of genomic data, we adopt a new measure that has been recently developed and re-validated in the previous study [53]. As an example of miRNA and gene expression data, let miRNA represent the miRNA data matrix of size N by Nmi and let gene denote the gene expression data matrix of size N by NG, where N, Nmi, and NG represent the number of patients, miRNAs, and gene expression traits, respectively. A new feature matrix X incorporating the miRNA-target gene information can be constructed by
| (4) |
where δ(j, m) = 1 if mth gene is targeted by jth miRNA, and 0 otherwise. After constructing the new matrix containing inter-relationship between two different types of genomic data, a Gaussian function of Euclidean distance between patients was used to calculate the final weight matrix using equation (1). Thus, nearby patients in Euclidean spaces are assigned large edge weights, which are likely to share similar inter-relationship pattern. This weight matrix containing inter-relationship can be used for graph-based SSL as an input, representing an inter-relationship graph. This approach was applied to other pairs including CE, ME, CM, CR, and MR.
Integrating multiple graphs
From different levels of genomic data and inter-relationship, multiple graphs can be generated (Fig 2). However, clinical outcome prediction can benefit by integrating diverse graphs from multi-omics data and inter-relationship, rather than relying only on single level of genomic data that may have possible limitations, (i.e. incomplete information and noise). Information from each graph is regarded as partly independent from and partly complementary to others. When genomic data are presented as a graph form, integrating multi-omics data can be done by employing a graph integration method from finding optimum combination coefficients [23, 46, 54]. Based on the method, the integration of multiple graphs was conducted through finding an optimum coefficient of the linear combination for the individual graphs. This corresponds to finding the combination coefficients α for the individual Laplacians of the following mathematical formulation:
| (5) |
where K is the number of graphs and Lk is the corresponding graph-Laplacian of graph Gk. Similar to the output prediction for single graphs, the solution is obtained by
| (6) |
Results and Discussion
The receiver operating characteristic (ROC) curve plots sensitivity (true positive rate) as a function of 1-specificity (false positive rate) for a binary classifier system as its discrimination threshold is varied [55]. For each problem, we calculated area under the curve (AUC) of ROC as a performance measure. In order to avoid over-fitting, five-fold cross-validation was conducted. Because genomic data sources are normally high dimensional and noisy and contain many redundant features, which could incur computational difficulty and low accuracy, a t-test based feature selection method was used [56]. Even though there are many feature selection techniques such as filter, wrapper, and embedded method [57], a simple univariate feature selection method was used in order to emphasize not the effect of feature selection but the effect of integration with multi-omics data and inter-relationship between them in this study.
Selected features
In order to avoid the over-fitting, the feature selection was conducted using training dataset and repeated for five times. We set a 0.05 p-value threshold from t-test to fairly get selected features from different levels of genomic data. Among selected features from five times, we finally selected overlap features in order to make the weight matrix. The total numbers of final selected features of CNA, methylation, miRNA, and gene expression data are 2 CNA regions, 100 CpG loci, 25 miRNAs, and 99 genes, respectively. For constructing inter-relationship graph, we searched over possible pairs between selected features belonging to the different levels of genomic data based on interaction knowledge as described in the Method section. Due to the small number of selected CNA features, there were not enough pairs between CNA feature and other features. Thus, we searched over 54 CNA features rather than 2 features to have possible inter-relationship between CNA feature and other genomic features since 54 CNA regions were results of altered regions of amplification or deletion across sets of patients from GISTIC algorithm. The final numbers of pairs of CE, RE, ME, CM, CR, and MR are 13, 14, 202, 12, 2, and 22, respectively.
Integration with inter-relationship between different levels of genomic data
Figure 3 shows the prediction performance on the classification of short-term and long-term survival in ovarian cancer for 6 types of pair, RE, CE, ME, CM, CR, and MR, between CNA, methylation, miRNA, and gene expression data. ROC curves can be found in the supplementary information (Supplementary Fig. 1). For the pair between miRNA and gene expression data (RE), the SSL with miRNA data (R) and gene expression data (E) performed with AUCs of 0.6699 and 0.8191, respectively. In addition, the integration model with miRNA and gene expression data (RE) showed better performance with the AUC of 0.8404 than the model from the miRNA or gene expression data alone. In particular, the model integrating miRNA, gene expression, and inter-relationship between them with the AUC of 0.8476 (REI) even outperformed the model combining miRNA and gene expression data (RE) (Fig. 3 (a)). Note that, similar results were also obtained for other pairs, CE, ME, CR, and MR except for CM (Fig. 3 (b), (c), (d), (e), and (f)). As we expected, ME and CE pairs also showed that the performance of model incorporating inter-relationship, MEI and CEI, increased compared to the one without inter-relationship, ME and CE, respectively (Fig. 3 (b) and (c)). However, the performance of the integration model from CNA, methylation, and inter-relationship between them (CMI) showed worse than the model combining CNA and methylation data (CM) (Fig. 3 (d)). Even though the integration model from CNA and miRNA (CR) showed the worse performance compared to the model with genomic data alone (R), the performance of the model incorporating inter-relationship (CRI) showed the best among any other models (Fig. 3 (e)). Most interestingly, when incorporating inter-relationship between methylation and miRNA, the final integrated model (MRI) with the AUC of 0.7994 outperformed the integrated model (MR) with the AUC of 0.7865 (Fig. 3 (f)). We found that the opportunity for success in prediction of clinical outcomes in ovarian cancer increased when incorporating inter-relationship into the final SSL model.
Figure 3.
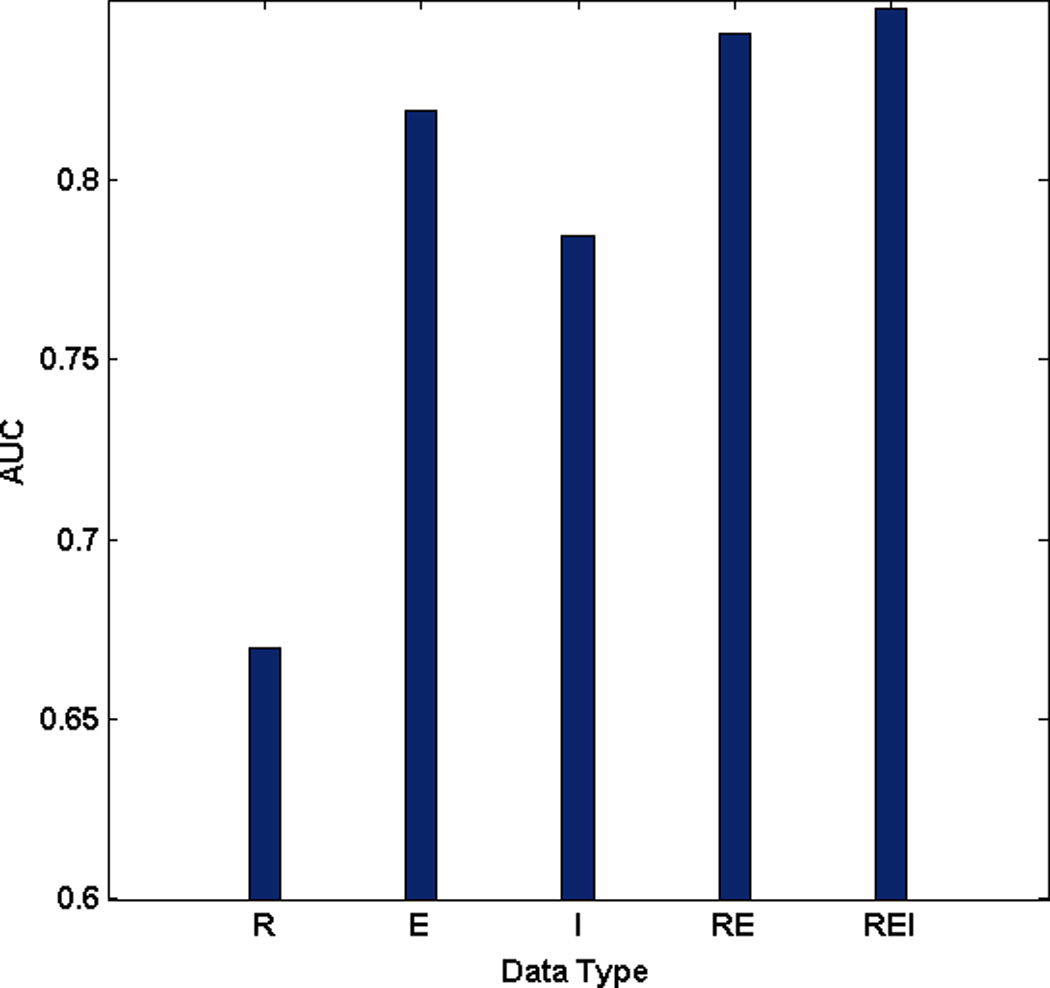
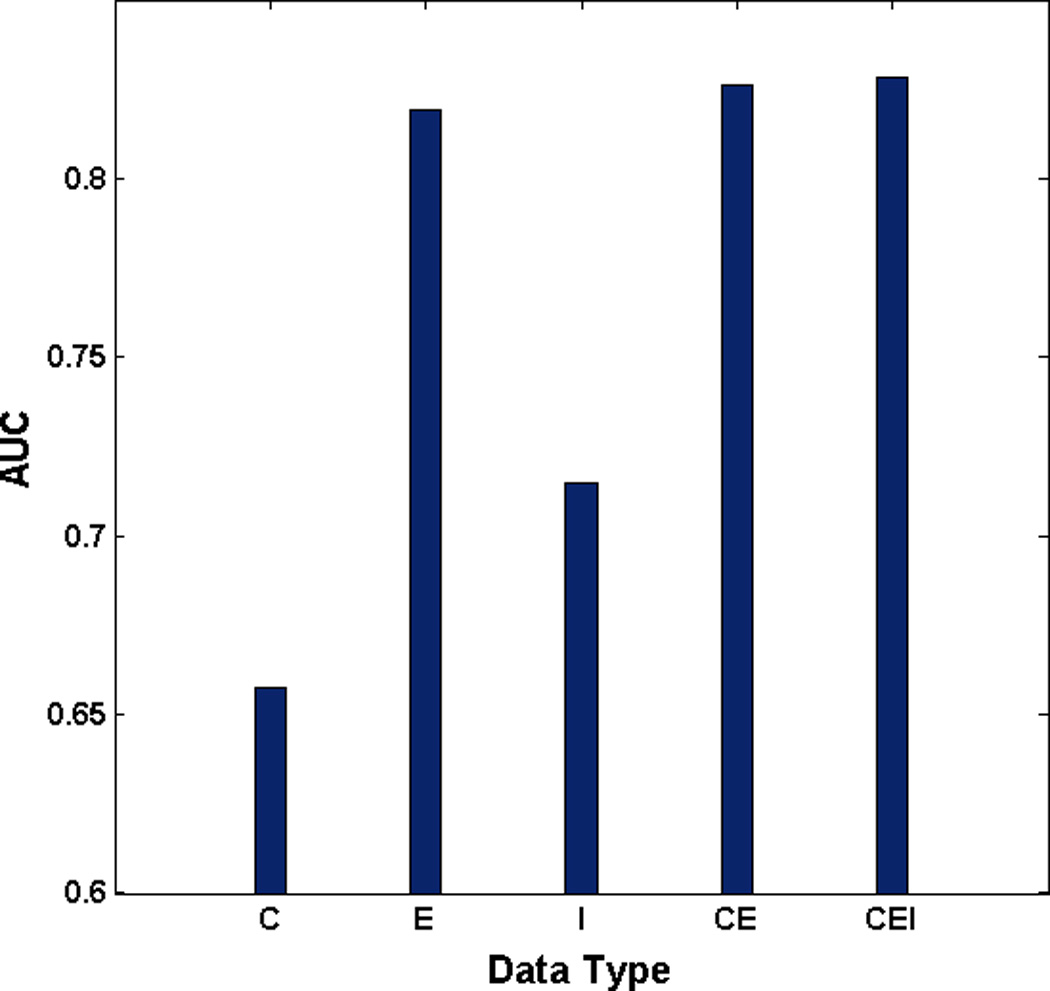
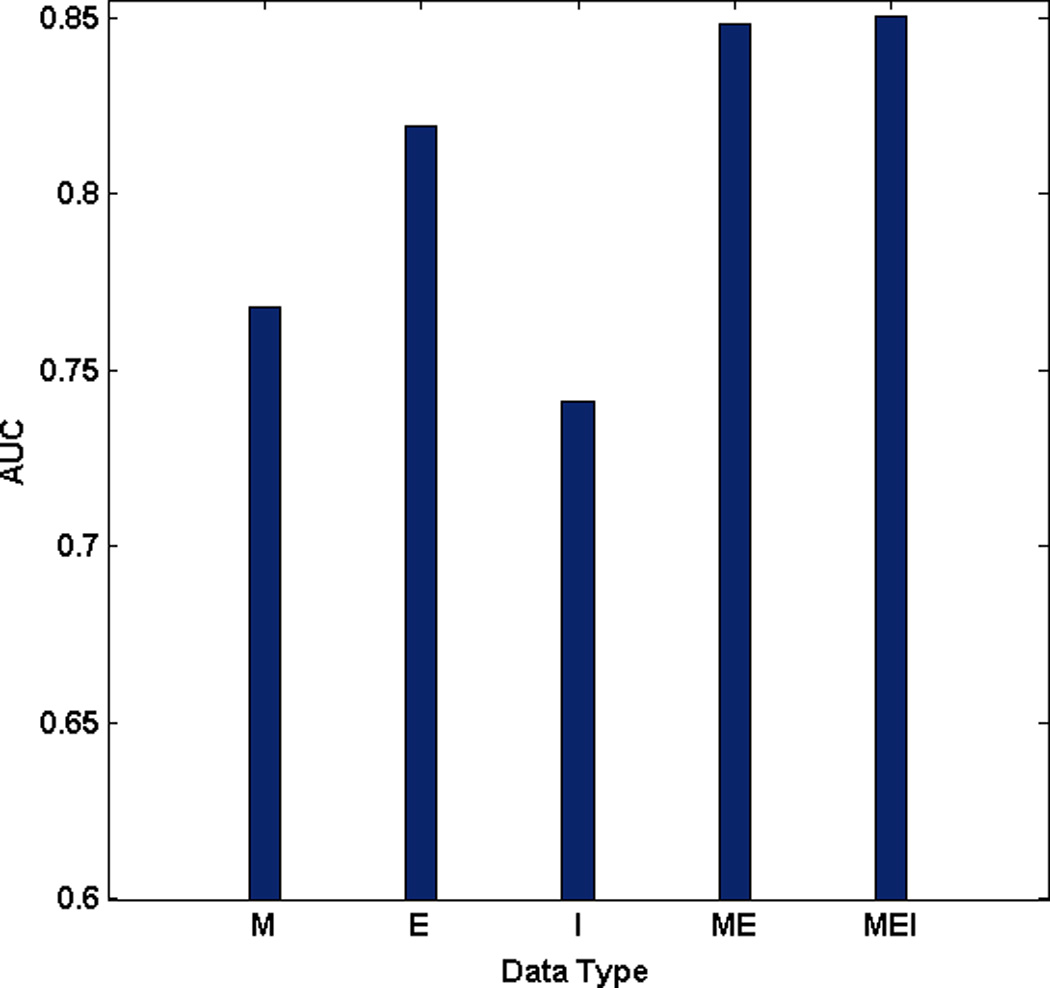


Performance comparison between models: C stands for CNA, M for methylation, E for gene expression, R for miRNA, I for inter-relationship, RE for the integration model from miRNA and gene expression data, REI for the integration model from miRNA, gene expression, and inter-relationship (a) RE pair (b) CE pair (c) ME pair (d) CM pair (e) CR pair (f) MR pair
Biological implication
On the bases of the results, the model incorporating inter-relationship between different genomic features showed the improvement compared to the model without inter-relationship when integrating multi-omics data. Taken together these results suggest that inter-relationship between difference levels of genomic data is complementary to the prediction power of explaining cancer clinical outcome. Through the proposed model, different levels of genomic features associated with survival in ovarian cancer were selected. In particular, selected features involved in inter-relationship might be regarded as acting important roles associated with survival in ovarian cancer. As different levels of genomic data including CNA, methylation, and miRNA might affect gene regulation through either specific or synergistic fashion, this approach will lead us to an enhanced global view on interplays between them [58, 59].
In order to view the whole interplays from an inter-relationship network was generated using Cytoscape (Fig. 4) [60]. Nodes depict genomic features such as CNA, methylation, gene, or miRNA and edges represent inter-relationship between different genomic features based on interaction knowledge. Even though there are a few isolated networks that have one or two edges, many of genomic features are connected to each other as a big network (Fig. 4). This suggests that different levels of genomic features are not likely acting in isolation, but rather interact with other genomic features since cancer is dysregulated by multiple levels in the biological system through genomic, epigenomic, transcriptomic, proteomic level [11]. RE showed the largest number of edges from the network (Fig. 4). However, the number of edges is not biased to the prediction model with inter-relationship. MR, which has much smaller number of edges than the RE, showed the greatest improvement compared to the model without inter-relationship (Fig. 3). Among genes with a large number of edges, CHP gene is involved in MAPK signaling pathway that plays a critical role in the development and progression of ovarian cancer and other cancer types [61, 62]. In addition, genetic and epigenetic regulation of the SLC22A3 gene associated with prostate cancer was well described [63] and the potential role of SLC22A3 as one of the members of FRA6E in ovarian cancer was also investigated [64]. EGF-like module containing mucin-like hormone receptor 2 (EMR2) is associated with survival in breast cancer [65]. Among miRNAs with a large number of edges, hsa-miR-146a is well known as a common mechanism of miRNA activity in cancer cell, which is trans-activated by the NF-kB pathway and negatively feeds back on this signaling cascade by targeting two upstream activators of the pathway, IRAK1 and TRAF6 [66].
Figure 4.
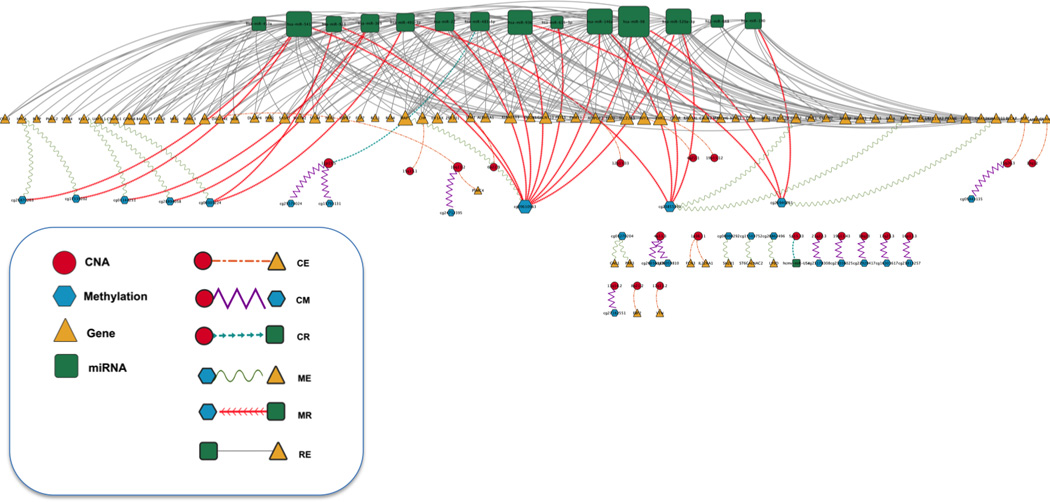
Inter-relationship network from selected features involved in inter-relationship between different levels of genomic data. Nodes depict genomic features such as CNA, methylation, gene, or miRNA and edges represent inter-relationship between different genomic features based on interaction knowledge. Node size varies based on the degree of connectivity of the nodes. Edge shape is also different from the types of inter-relationship.
Most interestingly, MR pair showed the great improvement by incorporating inter-relationship between miRNA and methylation through common genes (Fig. 3 (f)). Thus, we created a network in order to see shared genes by methylation and miRNA (Fig. 5). Seven genes including RBBP7, CTPS2, KLK12, HPCA, UAP1L1, MAPT, and KIAA1033 were shared by miRNA and methylation. MAPT gene is also involved in MATK signaling pathway that is potential cancer therapy in ovarian cancer [67]. In addition, kallikrein gene 12 (KLK12) might be involved in the pathogenesis and progression of several cancer types and considered as a novel cancer biomarker [68]. Taken together these results suggest that there might be possible synergistic mechanism between methylation and miRNA regulation for the expression [69].
Figure 5.

Inter-relationship network from selected features for the inter-relationship between methylation and miRNA (MR) sharing common genes
In order to provide the whole genome view, all selected features for the inter-relationship between four types of genomic data were plotted using PhenoGram visualization software (Fig. 6) [70]. In particular, chromosome 19 shows many of the features of genomic instability from different levels of genomic data, which was reported in the previous study [19]. One interesting possibility suggests that the same genomic loci might contribute clinical information in more than one domain – the same genes that change in their copy number, miRNA patterns, and methylation patterns also present predictive powers based on gene expression levels.
Figure 6.
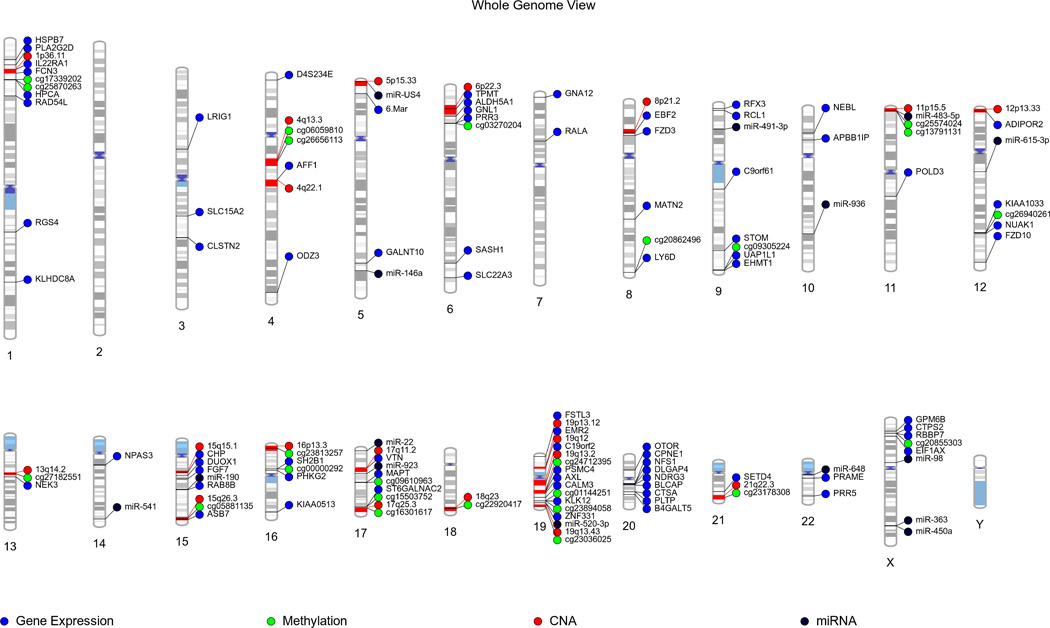
Whole genome view of selected features using PhenoGram: blue circle stands for gene expression, green circle for methylation, red circle for CNA, and black circle for miRNA
Conclusions
In this study, we addressed the issue of integrating inter-relationship between different levels of genomic data in the intermediated integration manner. We proposed the new framework that combines not only multi-omics data but inter-relationship between them in order to better predict cancer clinical outcomes. For demonstrating the validity of the proposed framework, ovarian cancer data from TCGA was adopted for classifying short-term and long-term survival as a pilot project.
On the bases of the results of our computational experiments, the model incorporating inter-relationship between different genomic features showed the modest improvement compared to the model without inter-relationship when integrating multi-omics data. We found that not only RE, CE, and ME pairs but CR and MR pairs showed the positive effect of integration with inter-relationship. These results suggest that inter-relationship between genomic features is complementary to the prediction power of explaining cancer phenotype because of the possible mechanisms that genomic features are likely to operate together in cancer. In addition, we could investigate the interplays associated with survival in ovarian cancer between different levels of genomic features through incorporating inter-relationship. Taken together these results suggest that proposed framework will lead us to an improved global view on interplays since different levels of genomic data might affect the cancer clinical outcome through either partly independent or partly complementary fashion. Notably, when combining inter-relationship between methylation and miRNA into the model, it showed the greatest improvement. It suggests that there might be possible synergistic regulatory mechanism between methylation and miRNA for gene expression. Thus, integration of different levels of data and inter-relationship between them can aid in extracting new biological knowledge by drawing an integrative conclusion from many pieces of information collected from diverse types of genomic data.
One of the limitations in the current study is that we only used the limited interactions knowledge such as ‘miRNA – its target genes’, ‘CNA regions – genes in the altered region’, ‘methylation – candidate genes targeted by methylation as cis acting regulation’, etc. We expect that the model integrating multi-omics data and inter-relationship will improve as long as the quality of interaction knowledge increases in the future. Moreover, another interesting direction for further works would be the incorporation of inter-relationship based on not interaction knowledge but interaction profiles as a data-driven approach. For instance, the direction of correlation between CNA and expression of genes in CNA region usually shows positive. On the other hands, the direction of correlations between gene expression and miRNA or between gene expression and methylation normally show negative. Even though the current study is limited in predicting of short-term and long-term survival in ovarian cancer as a pilot task, the proposed framework can be applied to other clinical outcomes such as grade, stage, metastasis, recurrence, etc. Moreover, this framework can be applied to other cancer types as well for the future works. As multi-omics data from about 25 cancer types has exploded in use, our proposed framework will be valuable for explaining the underlying tumorigenesis, eventually leading to more effective screening strategies and therapeutic targets in many types of cancer. The Matlab code for graph-based semi-supervised learning will be available upon request.
Supplementary Material
Acknowledgements
This research was supported by a grant of the Korean Health Technology R&D Project, Ministry of Health and Welfare (H13C2164) and by the National Research Foundation of Korea (NRF) grant funded by the Korea government (MSIP) (No. 2010-0028631). MDR would like to gratefully acknowledge support by NIH grant 5R01 LM010040 and NHLBI grant 2U01 HL065962. In addition, we gratefully acknowledge the TCGA Consortium and all its members for the TCGA Project initiative, for providing samples, tissues, data processing and making data and results available.
Footnotes
Competing interests
All authors declared that there is no conflict of interest in this research.
Authors' contributions
DK and JHK designed and developed the study and wrote the manuscript. HS, KS, AV, and MDR provided the experimental results and interpreted the results. HS, MDR, and JHK provided intellectual guidance and mentorship. All authors read and approved the final manuscript.
Contributor Information
Dokyoon Kim, Email: duk27@psu.edu.
Hyunjung Shin, Email: shin@ajou.ac.kr.
Kyung-Ah Sohn, Email: kasohn@ajou.ac.kr.
Anurag Verma, Email: anurag.verma@psu.edu.
Marylyn D. Ritchie, Email: marylyn.ritchie@psu.edu.
Ju Han Kim, Email: juhan@snu.ac.kr.
References
- 1.Berchuck A, Iversen ES, Lancaster JM, Pittman J, Luo J, Lee P, Murphy S, Dressman HK, Febbo PG, West M, et al. Patterns of gene expression that characterize long-term survival in advanced stage serous ovarian cancers. Clin Cancer Res. 2005;11(10):3686–3696. doi: 10.1158/1078-0432.CCR-04-2398. [DOI] [PubMed] [Google Scholar]
- 2.Huang E, Cheng SH, Dressman H, Pittman J, Tsou MH, Horng CF, Bild A, Iversen ES, Liao M, Chen CM, et al. Gene expression predictors of breast cancer outcomes. Lancet. 2003;361(9369):1590–1596. doi: 10.1016/S0140-6736(03)13308-9. [DOI] [PubMed] [Google Scholar]
- 3.Roepman P, Wessels LF, Kettelarij N, Kemmeren P, Miles AJ, Lijnzaad P, Tilanus MG, Koole R, Hordijk GJ, van der Vliet PC, et al. An expression profile for diagnosis of lymph node metastases from primary head and neck squamous cell carcinomas. Nat Genet. 2005;37(2):182–186. doi: 10.1038/ng1502. [DOI] [PubMed] [Google Scholar]
- 4.van 't Veer LJ, Dai H, van de Vijver MJ, He YD, Hart AA, Mao M, Peterse HL, van der Kooy K, Marton MJ, Witteveen AT, et al. Gene expression profiling predicts clinical outcome of breast cancer. Nature. 2002;415(6871):530–536. doi: 10.1038/415530a. [DOI] [PubMed] [Google Scholar]
- 5.Fan X, Shi L, Fang H, Cheng Y, Perkins R, Tong W. DNA microarrays are predictive of cancer prognosis: a re-evaluation. Clinical cancer research : an official journal of the American Association for Cancer Research. 2010;16(2):629–636. doi: 10.1158/1078-0432.CCR-09-1815. [DOI] [PubMed] [Google Scholar]
- 6.Wood LD, Parsons DW, Jones S, Lin J, Sjoblom T, Leary RJ, Shen D, Boca SM, Barber T, Ptak J, et al. The genomic landscapes of human breast and colorectal cancers. Science. 2007;318(5853):1108–1113. doi: 10.1126/science.1145720. [DOI] [PubMed] [Google Scholar]
- 7.Myllykangas S, Tikka J, Bohling T, Knuutila S, Hollmen J. Classification of human cancers based on DNA copy number amplification modeling. BMC medical genomics. 2008;1:15. doi: 10.1186/1755-8794-1-15. [DOI] [PMC free article] [PubMed] [Google Scholar]
- 8.Lu J, Getz G, Miska EA, Alvarez-Saavedra E, Lamb J, Peck D, Sweet-Cordero A, Ebert BL, Mak RH, Ferrando AA, et al. MicroRNA expression profiles classify human cancers. Nature. 2005;435(7043):834–838. doi: 10.1038/nature03702. [DOI] [PubMed] [Google Scholar]
- 9.Boeri M, Verri C, Conte D, Roz L, Modena P, Facchinetti F, Calabro E, Croce CM, Pastorino U, Sozzi G. MicroRNA signatures in tissues and plasma predict development and prognosis of computed tomography detected lung cancer. Proc Natl Acad Sci U S A. 2011;108(9):3713–3718. doi: 10.1073/pnas.1100048108. [DOI] [PMC free article] [PubMed] [Google Scholar]
- 10.Beroukhim R, Mermel CH, Porter D, Wei G, Raychaudhuri S, Donovan J, Barretina J, Boehm JS, Dobson J, Urashima M, et al. The landscape of somatic copy-number alteration across human cancers. Nature. 2010;463(7283):899–905. doi: 10.1038/nature08822. [DOI] [PMC free article] [PubMed] [Google Scholar]
- 11.Hanash S. Integrated global profiling of cancer. Nature reviews Cancer. 2004;4(8):638–644. doi: 10.1038/nrc1414. [DOI] [PubMed] [Google Scholar]
- 12.Chin L, Gray JW. Translating insights from the cancer genome into clinical practice. Nature. 2008;452(7187):553–563. doi: 10.1038/nature06914. [DOI] [PMC free article] [PubMed] [Google Scholar]
- 13.International Cancer Genome C. Hudson TJ, Anderson W, Artez A, Barker AD, Bell C, Bernabe RR, Bhan MK, Calvo F, Eerola I, et al. International network of cancer genome projects. Nature. 2010;464(7291):993–998. doi: 10.1038/nature08987. [DOI] [PMC free article] [PubMed] [Google Scholar]
- 14.Cancer Genome Atlas Research N. Genomic and epigenomic landscapes of adult de novo acute myeloid leukemia. The New England journal of medicine. 2013;368(22):2059–2074. doi: 10.1056/NEJMoa1301689. [DOI] [PMC free article] [PubMed] [Google Scholar]
- 15.Cancer Genome Atlas Research N. Kandoth C, Schultz N, Cherniack AD, Akbani R, Liu Y, Shen H, Robertson AG, Pashtan I, Shen R, et al. Integrated genomic characterization of endometrial carcinoma. Nature. 2013;497(7447):67–73. doi: 10.1038/nature12113. [DOI] [PMC free article] [PubMed] [Google Scholar]
- 16.TCGA Network. Comprehensive molecular characterization of human colon and rectal cancer. Nature. 2012;487(7407):330–337. doi: 10.1038/nature11252. [DOI] [PMC free article] [PubMed] [Google Scholar]
- 17.TCGA Network. Comprehensive genomic characterization of squamous cell lung cancers. Nature. 2012;489(7417):519–525. doi: 10.1038/nature11404. [DOI] [PMC free article] [PubMed] [Google Scholar]
- 18.TCGA Network. Comprehensive molecular portraits of human breast tumours. Nature. 2012;490(7418):61–70. doi: 10.1038/nature11412. [DOI] [PMC free article] [PubMed] [Google Scholar]
- 19.TCGA Network. Integrated genomic analyses of ovarian carcinoma. Nature. 2011;474(7353):609–615. doi: 10.1038/nature10166. [DOI] [PMC free article] [PubMed] [Google Scholar]
- 20.TCGA Network. Comprehensive genomic characterization defines human glioblastoma genes and core pathways. Nature. 2008;455(7216):1061–1068. doi: 10.1038/nature07385. [DOI] [PMC free article] [PubMed] [Google Scholar]
- 21.Noushmehr H, Weisenberger DJ, Diefes K, Phillips HS, Pujara K, Berman BP, Pan F, Pelloski CE, Sulman EP, Bhat KP, et al. Identification of a CpG island methylator phenotype that defines a distinct subgroup of glioma. Cancer Cell. 2010;17(5):510–522. doi: 10.1016/j.ccr.2010.03.017. [DOI] [PMC free article] [PubMed] [Google Scholar]
- 22.Srinivasan S, Patric IR, Somasundaram K. A ten-microRNA expression signature predicts survival in glioblastoma. PLoS One. 2011;6(3):e17438. doi: 10.1371/journal.pone.0017438. [DOI] [PMC free article] [PubMed] [Google Scholar]
- 23.Kim D, Shin H, Song YS, Kim JH. Synergistic effect of different levels of genomic data for cancer clinical outcome prediction. J Biomed Inform. 2012;45(6):1191–1198. doi: 10.1016/j.jbi.2012.07.008. [DOI] [PubMed] [Google Scholar]
- 24.Kim D, Joung JG, Sohn KA, Shin H, Ritchie MD, Kim JH. Knowledge Boosting: A graph-based integration with multi-omics data and genomic knowledge for cancer clinical outcome prediction. Journal of the American Medical Informatics Association : JAMIA. 2013 doi: 10.1136/amiajnl-2013-002481. Accepted. [DOI] [PMC free article] [PubMed] [Google Scholar]
- 25.Lussier YA, Li H. Breakthroughs in genomics data integration for predicting clinical outcome. J Biomed Inform. 2012;45(6):1199–1201. doi: 10.1016/j.jbi.2012.10.003. [DOI] [PMC free article] [PubMed] [Google Scholar]
- 26.Williams R, Lim JE, Harr B, Wang C, Walters R, Distler MG, Teschke M, Wu CL, Wiltshire T, Su AI, et al. A Common and Unstable Copy Number Variant Is Associated with Differences in Glo1 Expression and Anxiety-Like Behavior. Plos One. 2009;4(3) doi: 10.1371/journal.pone.0004649. [DOI] [PMC free article] [PubMed] [Google Scholar]
- 27.Stranger BE, Forrest MS, Dunning M, Ingle CE, Beazley C, Thorne N, Redon R, Bird CP, de Grassi A, Lee C, et al. Relative impact of nucleotide and copy number variation on gene expression phenotypes. Science. 2007;315(5813):848–853. doi: 10.1126/science.1136678. [DOI] [PMC free article] [PubMed] [Google Scholar]
- 28.Orozco LD, Cokus SJ, Ghazalpour A, Ingram-Drake L, Wang S, van Nas A, Che N, Araujo JA, Pellegrini M, Lusis AJ. Copy number variation influences gene expression and metabolic traits in mice. Hum Mol Genet. 2009;18(21):4118–4129. doi: 10.1093/hmg/ddp360. [DOI] [PMC free article] [PubMed] [Google Scholar]
- 29.Cahan P, Li Y, Izumi M, Graubert TA. The impact of copy number variation on local gene expression in mouse hematopoietic stem and progenitor cells. Nat Genet. 2009;41(4):430–437. doi: 10.1038/ng.350. [DOI] [PMC free article] [PubMed] [Google Scholar]
- 30.Rantalainen M, Herrera BM, Nicholson G, Bowden R, Wills QF, Min JL, Neville MJ, Barrett A, Allen M, Rayner NW, et al. MicroRNA Expression in Abdominal and Gluteal Adipose Tissue Is Associated with mRNA Expression Levels and Partly Genetically Driven. Plos One. 2011;6(11) doi: 10.1371/journal.pone.0027338. [DOI] [PMC free article] [PubMed] [Google Scholar]
- 31.Lu J, Clark AG. Impact of microRNA regulation on variation in human gene expression. Genome Res. 2012 doi: 10.1101/gr.132514.111. [DOI] [PMC free article] [PubMed] [Google Scholar]
- 32.Borel C, Deutsch S, Letourneau A, Migliavacca E, Montgomery SB, Dimas AS, Vejnar CE, Attar H, Gagnebin M, Gehrig C, et al. Identification of cis- and trans-regulatory variation modulating microRNA expression levels in human fibroblasts. Genome Res. 2011;21(1):68–73. doi: 10.1101/gr.109371.110. [DOI] [PMC free article] [PubMed] [Google Scholar]
- 33.Dudziec E, Gogol-Doring A, Cookson V, Chen W, Catto J. Integrated epigenome profiling of repressive histone modifications, DNA methylation and gene expression in normal and malignant urothelial cells. PLoS One. 2012;7(3):e32750. doi: 10.1371/journal.pone.0032750. [DOI] [PMC free article] [PubMed] [Google Scholar]
- 34.Li M, Balch C, Montgomery JS, Jeong M, Chung JH, Yan P, Huang TH, Kim S, Nephew KP. Integrated analysis of DNA methylation and gene expression reveals specific signaling pathways associated with platinum resistance in ovarian cancer. BMC medical genomics. 2009;2:34. doi: 10.1186/1755-8794-2-34. [DOI] [PMC free article] [PubMed] [Google Scholar]
- 35.Gibbs JR, van der Brug MP, Hernandez DG, Traynor BJ, Nalls MA, Lai SL, Arepalli S, Dillman A, Rafferty IP, Troncoso J, et al. Abundant Quantitative Trait Loci Exist for DNA Methylation and Gene Expression in Human Brain. Plos Genet. 2010;6(5) doi: 10.1371/journal.pgen.1000952. [DOI] [PMC free article] [PubMed] [Google Scholar]
- 36.Bell JT, Pai AA, Pickrell JK, Gaffney DJ, Pique-Regi R, Degner JF, Gilad Y, Pritchard JK. DNA methylation patterns associate with genetic and gene expression variation in HapMap cell lines (vol 12, pg R10, 2011) Genome Biol. 2011;12(6) doi: 10.1186/gb-2011-12-1-r10. [DOI] [PMC free article] [PubMed] [Google Scholar]
- 37.Croce CM. Oncogenes and cancer. The New England journal of medicine. 2008;358(5):502–511. doi: 10.1056/NEJMra072367. [DOI] [PubMed] [Google Scholar]
- 38.Jemal A, Siegel R, Ward E, Hao Y, Xu J, Thun MJ. Cancer statistics, 2009. CA Cancer J Clin. 2009;59(4):225–249. doi: 10.3322/caac.20006. [DOI] [PubMed] [Google Scholar]
- 39.Cannistra SA. Cancer of the ovary. The New England journal of medicine. 2004;351(24):2519–2529. doi: 10.1056/NEJMra041842. [DOI] [PubMed] [Google Scholar]
- 40.Cerami E, Gao J, Dogrusoz U, Gross BE, Sumer SO, Aksoy BA, Jacobsen A, Byrne CJ, Heuer ML, Larsson E, et al. The cBio cancer genomics portal: an open platform for exploring multidimensional cancer genomics data. Cancer discovery. 2012;2(5):401–404. doi: 10.1158/2159-8290.CD-12-0095. [DOI] [PMC free article] [PubMed] [Google Scholar]
- 41.Bild AH, Yao G, Chang JT, Wang Q, Potti A, Chasse D, Joshi MB, Harpole D, Lancaster JM, Berchuck A, et al. Oncogenic pathway signatures in human cancers as a guide to targeted therapies. Nature. 2006;439(7074):353–357. doi: 10.1038/nature04296. [DOI] [PubMed] [Google Scholar]
- 42.Chapelle O, Weston J, Scholkopf B. Cluster kernels for semi-supervised learning. Advances in Neural Information Processing Systems (NIPS) 2003;15(15):585–592. [Google Scholar]
- 43.Zhu X, Ghahramani Z, Lafferty J. Proceedings of the Twenty-first International Conference on Machine Learning (ICML) Washington, DC: AAAI Press; 2003. Semi-supervised learning using Gaussian fields and harmonic functions; pp. 912–919. [Google Scholar]
- 44.Belkin M. Regularization and Semi-supervised Learning on Large Graphs. Proceedings of the 17th Annual Conference on Learning Theory (COLT) 3120 Lecture Notes in Computer Science. 2004:624–638. [Google Scholar]
- 45.Zhou D, Bousquet O, Weston J, Scholkopf B. Learning with local and global consistency. Advances in Neural Information Processing Systems (NIPS) 2004;16:321–328. [Google Scholar]
- 46.Tsuda K, Shin H, Scholkopf B. Fast protein classification with multiple networks. Bioinformatics. 2005;21(Suppl 2):ii59–ii65. doi: 10.1093/bioinformatics/bti1110. [DOI] [PubMed] [Google Scholar]
- 47.Shin H, Tsuda K. Book: Semi-Supervised Learning, Edited by Olivier Chapelle, Bernhard Schölkopf, Alexander Zien. Chapter 20. MIT press; 2006. Prediction of Protein Function from Networks; pp. 339–352. [Google Scholar]
- 48.Aittokallio T, Schwikowski B. Graph-based methods for analysing networks in cell biology. Briefings in bioinformatics. 2006;7(3):243–255. doi: 10.1093/bib/bbl022. [DOI] [PubMed] [Google Scholar]
- 49.Gottlieb A, Stein GY, Ruppin E, Altman RB, Sharan R. A method for inferring medical diagnoses from patient similarities. BMC medicine. 2013;11:194. doi: 10.1186/1741-7015-11-194. [DOI] [PMC free article] [PubMed] [Google Scholar]
- 50.Chung FRK. Spectral Graph Theory. Number 92 in Regional Conference Series in Mathematics. 1997 [Google Scholar]
- 51.Xiao F, Zuo Z, Cai G, Kang S, Gao X, Li T. miRecords: an integrated resource for microRNA-target interactions. Nucleic acids research. 2009;37:D105–D110. doi: 10.1093/nar/gkn851. (Database issue) [DOI] [PMC free article] [PubMed] [Google Scholar]
- 52.van Eijk KR, de Jong S, Boks MP, Langeveld T, Colas F, Veldink JH, de Kovel CG, Janson E, Strengman E, Langfelder P, et al. Genetic analysis of DNA methylation and gene expression levels in whole blood of healthy human subjects. BMC genomics. 2012;13:636. doi: 10.1186/1471-2164-13-636. [DOI] [PMC free article] [PubMed] [Google Scholar]
- 53.Kim D, Shin H, Joung JG, Lee SY, Kim JH. Intra-relation reconstruction from inter-relation: miRNA to gene expression. BMC systems biology. 2013 doi: 10.1186/1752-0509-7-S3-S8. [DOI] [PMC free article] [PubMed] [Google Scholar]
- 54.Shin H, Lisewski AM, Lichtarge O. Graph sharpening plus graph integration: a synergy that improves protein functional classification. Bioinformatics. 2007;23(23):3217–3224. doi: 10.1093/bioinformatics/btm511. [DOI] [PubMed] [Google Scholar]
- 55.Gribskov M, Robinson NL. Use of receiver operating characteristic (ROC) analysis to evaluate sequence matching. Comput Chem. 1996;20(1):25–33. doi: 10.1016/s0097-8485(96)80004-0. [DOI] [PubMed] [Google Scholar]
- 56.Jafari P, Azuaje F. An assessment of recently published gene expression data analyses: reporting experimental design and statistical factors. BMC Med Inform Decis Mak. 2006;6:27. doi: 10.1186/1472-6947-6-27. [DOI] [PMC free article] [PubMed] [Google Scholar]
- 57.Saeys Y, Inza I, Larranaga P. A review of feature selection techniques in bioinformatics. Bioinformatics. 2007;23(19):2507–2517. doi: 10.1093/bioinformatics/btm344. [DOI] [PubMed] [Google Scholar]
- 58.Sohn KA, Kim D, Lim J, Kim JH. Relative impact of multi-layered genomic data on gene expression phenotypes in serous ovarian tumors. BMC systems biology. 2013;7(Suppl 6):S9. doi: 10.1186/1752-0509-7-S6-S9. [DOI] [PMC free article] [PubMed] [Google Scholar]
- 59.Louhimo R, Hautaniemi S. CNAmet: an R package for integrating copy number, methylation and expression data. Bioinformatics. 2011;27(6):887–888. doi: 10.1093/bioinformatics/btr019. [DOI] [PubMed] [Google Scholar]
- 60.Saito R, Smoot ME, Ono K, Ruscheinski J, Wang PL, Lotia S, Pico AR, Bader GD, Ideker T. A travel guide to Cytoscape plugins. Nature methods. 2012;9(11):1069–1076. doi: 10.1038/nmeth.2212. [DOI] [PMC free article] [PubMed] [Google Scholar]
- 61.Cao Z, Liu LZ, Dixon DA, Zheng JZ, Chandran B, Jiang BH. Insulin-like growth factor-I induces cyclooxygenase-2 expression via PI3K, MAPK and PKC signaling pathways in human ovarian cancer cells. Cellular signalling. 2007;19(7):1542–1553. doi: 10.1016/j.cellsig.2007.01.028. [DOI] [PMC free article] [PubMed] [Google Scholar]
- 62.Dhillon AS, Hagan S, Rath O, Kolch W. MAP kinase signalling pathways in cancer. Oncogene. 2007;26(22):3279–3290. doi: 10.1038/sj.onc.1210421. [DOI] [PubMed] [Google Scholar]
- 63.Chen L, Hong C, Chen EC, Yee SW, Xu L, Almof EU, Wen C, Fujii K, Johns SJ, Stryke D, et al. Genetic and epigenetic regulation of the organic cation transporter 3, SLC22A3. The pharmacogenomics journal. 2013;13(2):110–120. doi: 10.1038/tpj.2011.60. [DOI] [PMC free article] [PubMed] [Google Scholar]
- 64.Denison SR, Callahan G, Becker NA, Phillips LA, Smith DI. Characterization of FRA6E and its potential role in autosomal recessive juvenile parkinsonism and ovarian cancer. Genes, chromosomes & cancer. 2003;38(1):40–52. doi: 10.1002/gcc.10236. [DOI] [PubMed] [Google Scholar]
- 65.Davies JQ, Lin HH, Stacey M, Yona S, Chang GW, Gordon S, Hamann J, Campo L, Han C, Chan P, et al. Leukocyte adhesion-GPCR EMR2 is aberrantly expressed in human breast carcinomas and is associated with patient survival. Oncology reports. 2011;25(3):619–627. doi: 10.3892/or.2010.1117. [DOI] [PubMed] [Google Scholar]
- 66.Taganov KD, Boldin MP, Chang KJ, Baltimore D. NF-kappaB-dependent induction of microRNA miR-146, an inhibitor targeted to signaling proteins of innate immune responses. Proc Natl Acad Sci U S A. 2006;103(33):12481–12486. doi: 10.1073/pnas.0605298103. [DOI] [PMC free article] [PubMed] [Google Scholar]
- 67.Santarpia L, Lippman SM, El-Naggar AK. Targeting the MAPK-RAS-RAF signaling pathway in cancer therapy. Expert opinion on therapeutic targets. 2012;16(1):103–119. doi: 10.1517/14728222.2011.645805. [DOI] [PMC free article] [PubMed] [Google Scholar]
- 68.Yousef GM, Magklara A, Diamandis EP. KLK12 is a novel serine protease and a new member of the human kallikrein gene family-differential expression in breast cancer. Genomics. 2000;69(3):331–341. doi: 10.1006/geno.2000.6346. [DOI] [PubMed] [Google Scholar]
- 69.Taguchi YH. MicroRNA-mediated regulation of target genes in several brain regions is correlated to both microRNA-targeting-specific promoter methylation and differential microRNA expression. BioData mining. 2013;6(1):11. doi: 10.1186/1756-0381-6-11. [DOI] [PMC free article] [PubMed] [Google Scholar]
- 70.Wolfe D, Dudek S, Ritchie MD, Pendergrass SA. Visualizing genomic information across chromosomes with PhenoGram. BioData mining. 2013;6(1):18. doi: 10.1186/1756-0381-6-18. [DOI] [PMC free article] [PubMed] [Google Scholar]
Associated Data
This section collects any data citations, data availability statements, or supplementary materials included in this article.