Abstract
Perfusion imaging is the most applied modality for the assessment of acute stroke. Parameters such as Cerebral Blood Flow (CBF), Cerebral Blood volume (CBV) and Mean Transit Time (MTT) are used to distinguish the tissue infarct core and ischemic penumbra. Due to lack of standardization these parameters vary significantly between vendors and software even when provided with the same data set. There is a critical need to standardize the systems and make them more reliable. We have designed a uniform phantom to test and verify the perfusion systems. We implemented a flow loop with different flow rates (250, 300, 350 ml/min) and injected the same amount of contrast. The images of the phantom were acquired using a Digital Angiographic system. Since this phantom is uniform, projection images obtained using DSA is sufficient for initial validation. To validate the phantom we measured the contrast concentration at three regions of interest (arterial input, venous output, perfused area) and derived time density curves (TDC). We then calculated the maximum slope, area under the TDCs and flow. The maximum slope calculations were linearly increasing with increase in flow rate, the area under the curve decreases with increase in flow rate. There was 25% error between the calculated flow and measured flow. The derived TDCs were clinically relevant and the calculated flow, maximum slope and areas under the curve were sensitive to the measured flow. We have created a systematic way to calibrate existing perfusion systems and assess their reliability.
Keywords: Cerebral blood flow (CBF), Cerebral blood volume (CBV), Mean transit time (MTT), Time Density Curves (TDC), Digital subtraction Angiography (DSA), Perfusion Phantom, Perfusion systems, Fick Principle
1. INTRODUCTION
Acute stroke is the leading cause of disability and fourth leading cause of death in the United States of America [1]. There are two main types of stroke: i) Hemorrhagic and ii) Ischemic. Hemorrhagic stroke is due to a rupture or leaking of a blood vessel within or around the brain. Ischemic stroke is due to interruption of blood flow to the brain which hinders the oxygen and glucose supply for the brain activities. The prolonged brain tissue energy deprivation due to artery occlusion or rupture ultimately leads to acute stroke [2] [3].
The most used imaging modalities for acute stroke diagnosing are: Digital Subtraction Angiography (DSA), Computed Tomography (CT) and Magnetic Resonance Imaging (MRI) [4]. To help the clinicians in identifying the diseased site, these imaging techniques are used to evaluate blood flow reduction in the stroke affected area using various imaging contrast agents. Lack of the contrast agent’s signal indicates that the blood supply to tissue is almost zero. This area is labeled as the ischemic core and most of the tissue is already dead. On the other hand, contrast agent’s low signal indicates that the blood supply is quenched but potentially viable indicating salvageable tissue. This area is usually referred as the penumbra. The size of the core increases with time, for every minute about 2 million neurons are damaged from the onset of stroke therefore: “Time is Brain” [5]. The potentially salvageable brain tissue will become ischemic if the reperfusion is not done in a timely manner. Therefore reperfusion of the penumbra within the small time window is the clinician’s main goal. This stabilizes the flow and saves the cells from further destruction. Overall it is critical to determine the accurate core size and the penumbra to successfully treat a patient [6]. There are many commercially available perfusion measurement systems which diagnose the acute stroke and help in taking crucial decisions of treatment planning.
Perfusion measurement systems are responsible for examining the acute stroke. They help us to determine the hemodynamic parameters such as cerebral blood flow (CBF), cerebral blood volume (CBV) and mean transit time (MTT) [7]. Cerebral Blood Flow (CBF) is the volume of blood flowing through a unit of brain per unit time and expressed as milliliters of blood for 100g of brain tissue per minute ml/(min*100 g).Cerebral Blood Volume (CBV) is the total volume blood present per unit volume of brain. It is expressed as milliliters of blood for 100g of tissue (ml/100 g). Mean Transit Time (MTT) is defined as the average time for the blood to flow through a given region of brain (ml/min) [8].The stroke affected area can be discerned based on the flow present in that region of brain as the CBF. In healthy human brain at the capillary level the flow is (60 – 100) ml/ (min*100g). In the penumbra region the flow is reduced to 12–25ml/ (min*100 g) and in the ischemic core the flow is less than 10ml/ (min*100 g) [9].
Lately the clinical community has raised concerns about what exactly these values mean from a pathology point of view and how they vary between measurement systems. The commercially available perfusion measurement systems give different values for the same set of data as they are not standardized. Kudo et al [10] have compared the commercially available perfusion imaging systems by different vendors with the same source data of 10 stroke affected patients. They have post processed the patient data using 5 different systems (GE, Hitachi, Philips, Siemens and Toshiba) each of which used a different algorithm. They derived CBF, CBV and MTT maps using these systems and compared them to the maps derived from two standardized algorithms with Perfusion Mismatch Analyzer. The two algorithms were standard single value decomposition (sSVD) and block circulant single value decomposition (bSVD), and were treated as the control. The correlation coefficients between the standard algorithms and the five systems for CBF and MTT were between 0.36 and 0.95 whereas for the CBV it was 0.95 on average. They concluded that the derived perfusion maps differed significantly, the areas under CBF and MTT maps notably varied while the area under CBV remained constant.
With such drawbacks in the existing measurement systems, there is a chance for misdiagnosis of the tissue at risk. The inaccurate results affects the treatment planning and strategies for managing the stroke. So, there is a critical need to standardize the protocols associated with the existing perfusion systems [11]. Driscoll et al [12] have developed a dynamic flow phantom to validate the fundamental quantitative parameters of the perfusion systems. They were successful in producing the TDCs for a wide range of flow rates which were physiologically relevant however, the phantom’s capillary permeability was 1.2mm which is not physiologically relevant. Kevin et al [13] have attempted to develop a flow phantom and its capillary permeability was 1mm which cannot match the physiological conditions. The 3D printing technology enables us to simulate structure in micrometer level.
In this paper we are presenting a novel perfusion phantom mimicking the brain vasculature. We designed the phantom to simulate capillaries of 300 micron size. We tested the phantom with an angiographic system and derived time density curves. We calculated the maximum slope, area under the curve and flow using the Fick principle. The TDCs were physiologically relevant and the calculated flow values had a percentage error of 25%. This phantom can be a significant clinical calibration tool for the existing imaging perfusion measurement systems. This will help the systems to analyze the quantitative values of the tissue at risk and ischemic core size more meaningfully.
2. MATERIALS AND METHODS
This study has four sections as shown in Figure 1. In the first section we discuss the design of the phantom and the manufacturing capabilities of the 3D printer. In the next section we describe the experimental setup of the flow circuit designed to test the phantom with imaging modalities. The following section provides the details about the software we developed to analyze the images acquired by the imaging systems. In the last section we present the methods to calculate the various hemodynamic parameters to validate our system.
Figure 1.
The 4 sections of the study
2.1 Design and manufacturing of the uniform perfusion phantom
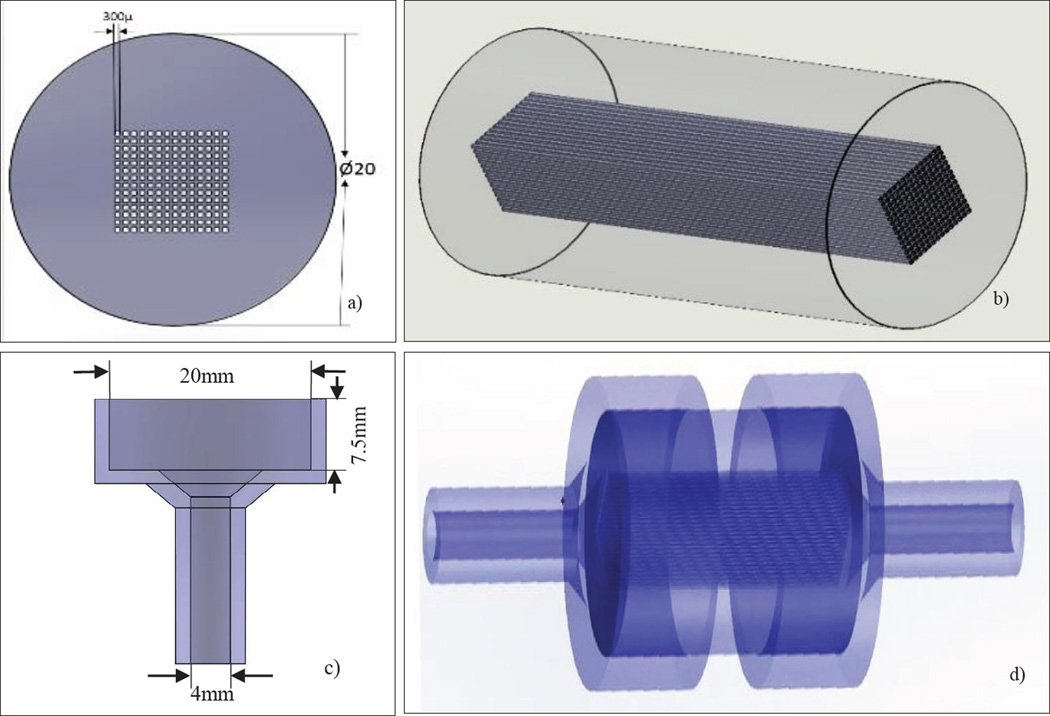
We designed the perfusion phantom using Dassault Systems SolidWorks® (MA, USA) and built it with a Polyjet 3D printer Objet Eden260 V (Rehovot, ISRAEL). The Stratasys Objet printer resolution in the XY-plane is 200 microns and in the Z-plane it is 17 microns. In Figure 2 we show the design of the uniform perfusion phantom, which has an overall cylindrical shape with a diameter of 20mm. We modeled the phantom with different lengths of 20mm or 30mm. It contains 196 square channels of 300µm×300µm simulating capillaries; these channels were parallel and contiguous making up the inside volume where the flow was allowed. The center to center distance between the capillaries is 500µm. A plastic like material called Duruswhite (Stratasys) was used to print the phantom with the 3D printer. Duruswhite is a polypropylene like Polyjet photo polymer which is very flexible, tough and stable, the mechanical properties are listed in table 1. The support material was cleaned with a WaterJet Objet (Rehovot, ISRAEL) and the square channels were manually cleaned with a 200µ needle.
Figure 2.
a) The SolidWorks design of the phantom showing the dimensions and the simulated capillaries (front view) b) Isometric view of the phantom c) Holder dimensions d) Phantom inserted in the holder to connect to the flow loop.
Table 1.
The mechanical properties of the material (Duruswhite) used to build the perfusion phantom.
| Izod notched impact strength | Tensile strength | Flexural Modulus |
|---|---|---|
| 44Joule/meter | 44% | 1026 Mega Pascal |
2.2 Testing the phantom with an Angiographic system
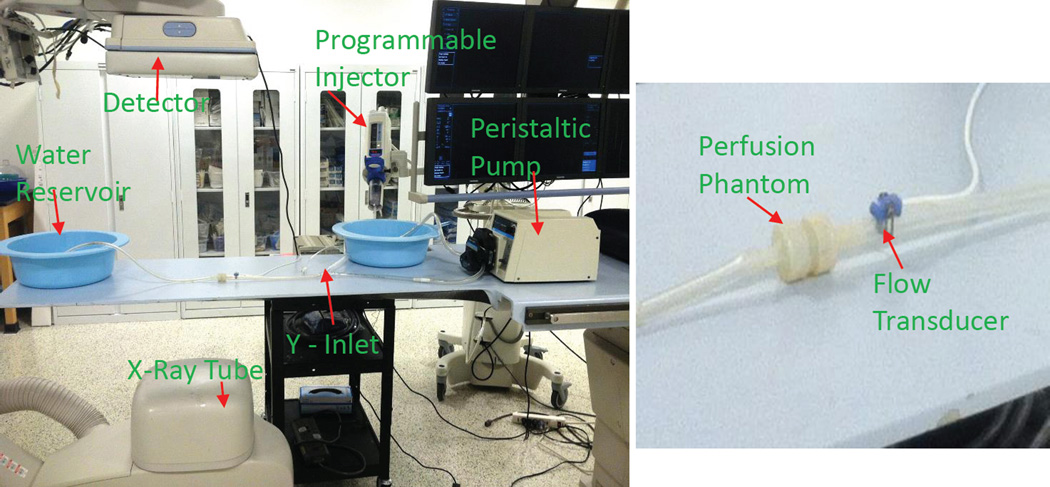
We created a flow loop using a peristaltic pump Masterflex® Model 77201-62 (IL, USA) and contrast agent Omnipaque™ NDC 0407-1414-94 (NJ, USA) was administered using a programmable injector Medrad® Mark V ProVis® PPD 104548 (PA, USA) with a Terumo® 5 Fr. catheter. A bolus of 3ml of contrast was injected at the rate of 20ml/sec through one inlet of the Y-shaped tubing system, the other inlet was being pumped with water. The water and contrast mixed well before they reached the phantom and were collected in a reservoir after passing through the system. The schematic diagram of the experimental setup is shown in the Figure 3.
Figure 3.
The schematic diagram of the experimental
Digital Subtraction Angiographic images and low contrast images with cone beam CT were acquired by a Toshiba Infinix VF-i/BP (CA, USA) after the contrast was injected. We used a flow transducer [Harvard Apparatus GmbH D-79232 (MA, USA)] to select the flow rates at the arterial inlet. To establish good contact between the flow probe and phantom we applied a non-spermicidal sterile lubricating jelly (Priority Care 1). We selected the flow at the rate of 250, 300 and 350 ml/min. The exposure parameters for acquiring the images were tube voltage of 80 kVp, tube current of 160 mA, a source to image distance of 122cm and a field of view of 12.5cm×17.5cm. The experimental setup in the clinical setting is shown in Figure 4.The images were acquired at the rate of 2 frames per second and two runs were taken for every flow rate.
Figure 4.
The experiment setup in the clinical setting
2.3 Analyzing the DSA images with our own software developed in LabVIEW
We developed a LabVIEW based software whose flowchart is shown in Figure 5 to derive TDCs and to calculate flow parameters at the arterial input and venous output and over the perfused area.
Figure 5.
Flowchart of the algorithm of the custom software developed using LabVIEW
2.4 Derive time density curves (TDC) to calculate the maximum slope, area under the curve and flow
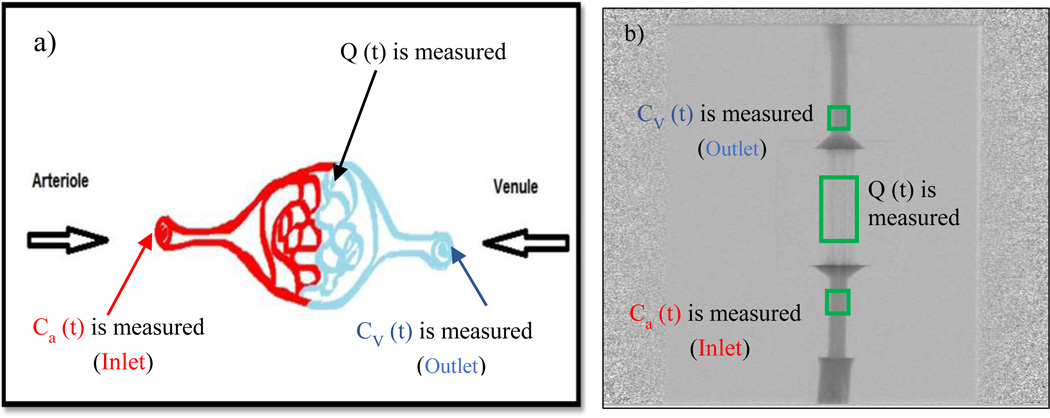
After deriving the TDCs at the regions of interest, we calculated the maximum slope, area under the curve and flow for all the runs. We first verified our system’s accuracy and sensitivity by using the law of conservation of mass. In Figure 6 we show the tissue perfusion of the physiological model and of the phantom. The contrast concentration is measured at the arterial input, venous output and capillary region Q (T).
Figure 6.
a) The physiological model showing the arterial inlet, venous outlet, perfused area b) The DSA image of the phantom showing regions of interest measured
Axel et al [14] first proposed the perfusion measurement using iodinated contrast on a CT scan. When the contrast is injected intravenously, the contrast concentration can be measured with the help of acquired images. The time density curves (TDC) can be derived on every region of interest of the image which helps us to study the path the contrast travels. Using the TDC and based on the Fick principle shown in the equation (1) we can calculate the hemodynamic parameters [15]. These hemodynamic parameters are extensively studied to understand how they relate to pathology. The Accumulated mass of contrast in the capillaries Q (T) is given by
| (1) |
where Ca (t) - contrast concentration in arterial inlet, CV (t) – contrast concentration in venous outlet and CBF- Cerebral Blood Flow
To verify the system’s sensitivity by checking the law of conservation:
| (2) |
To calculate the maximum slope we took the maximum value of the derivative of the contrast as a function of time at the arterial inlet, equation (3). We observed how it varies for different flow rates with the same amount of contrast being injected for every run.
| (3) |
We calculated the area under the TDCs, which will be useful to calculate the cerebral blood volume. We did the numerical integration over the derived curve to obtain the area as shown in the equation (4).
| (4) |
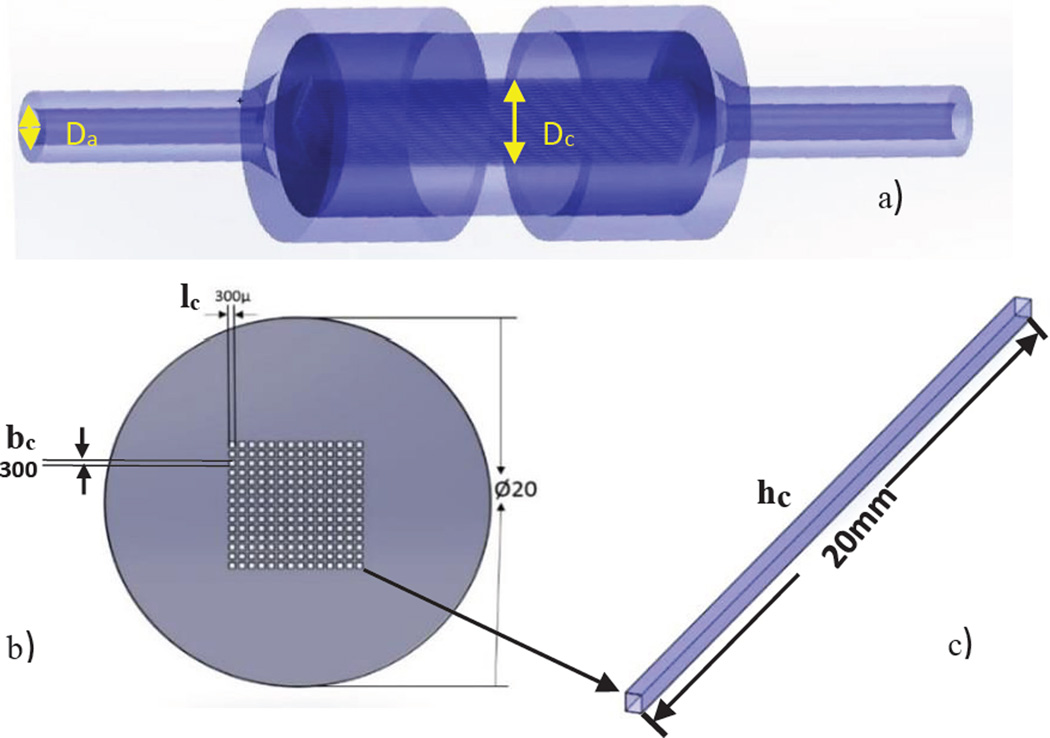
To calculate the flow for our system, we used the Fick principle. The images were acquired using an Angiographic system, therefore we take the natural log of the data first and calculate the flow using equation (5). The volume of the phantom is calculated using equation (7) and illustrated in the Figure 7 using SolidWorks software.
| (5) |
| (6) |
where Da – Diameter of the arterial inlet, Dc – The capillaries length in the X-ray direction, V is the Volume of the perfused area are given by,
| (7) |
where hc= capillary height, lc = capillary length, bc = capillary breadth, n = no of capillaries in the phantom
Figure 7.
a) The arterial input diameter and capillary length in X-ray direction b) Phantom with square channels simulating capillaries c) Capillary Dimensions
To calculate the flow using the Maximum slope equation (8) we do “no venous output” assumption which gives better results for complex and longer phantoms. We compared the obtained flow values with the results calculated using equation (6).
| (8) |
We acquired DSA runs for different flow rates with the same contrast injection conditions and X-ray parameters. For every flow rate we took two runs and calculated the mean and standard deviation to check for the reproducibility of our system.
3. RESULTS
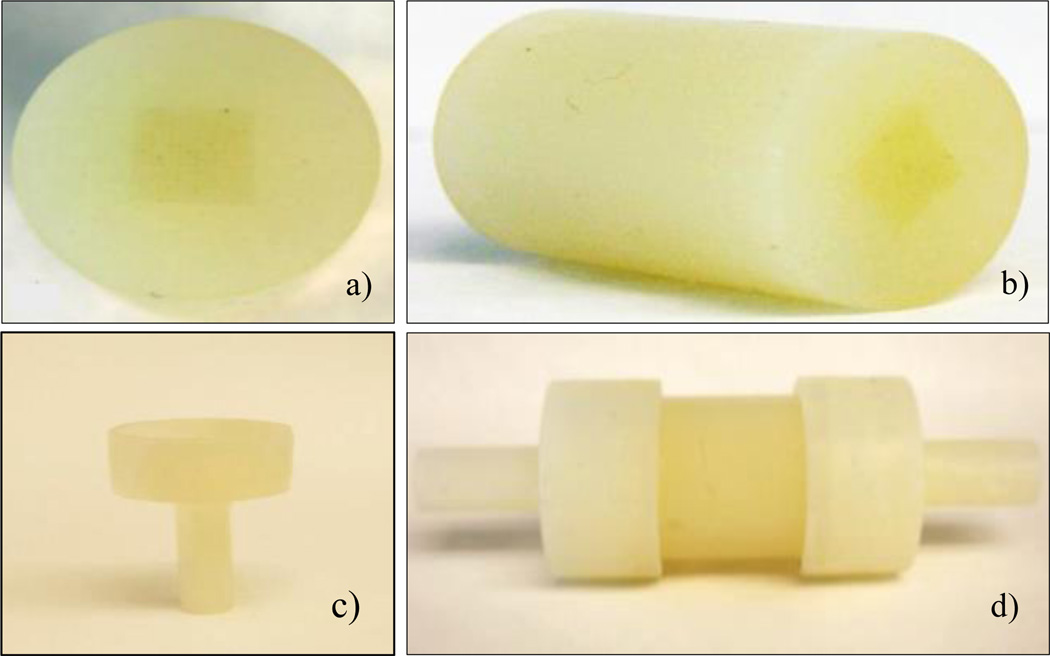
In Figure 8 we show the 3D printed perfusion phantom and holders. The average printing time of the phantom was 2 hours thirty minutes. The phantom was printed in the high quality mode and aligned along the XY direction (channels aligned in the direction of the long axis of the printing head motion) of the printer to ensure better resolution. To clean the support material from the capillaries was quiet challenging as they were micro channels. It took two days to clean the support material completely from capillary region of the printed phantom.
Figure 8.
a) Phantom printed using a 3D printer b) Isometric view of the phantom c) 3D printed holder d) Phantom connected to flow loop with holders
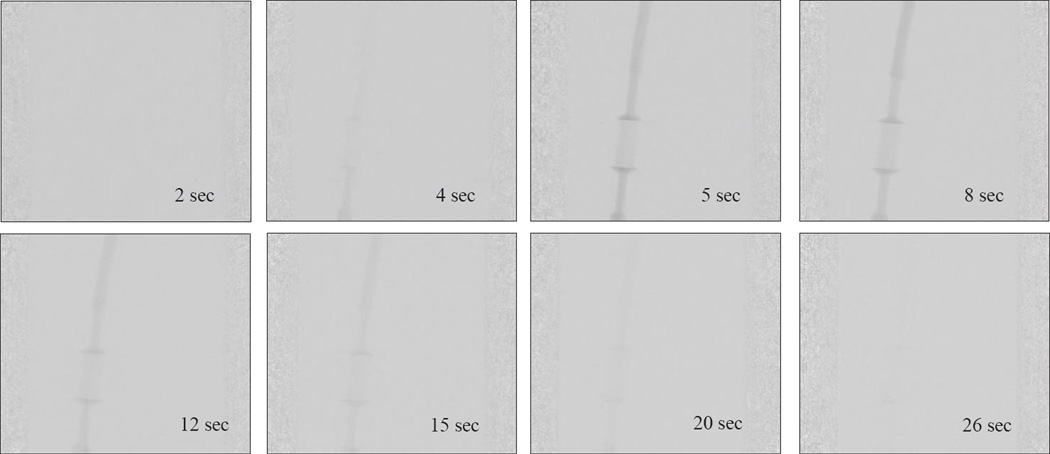
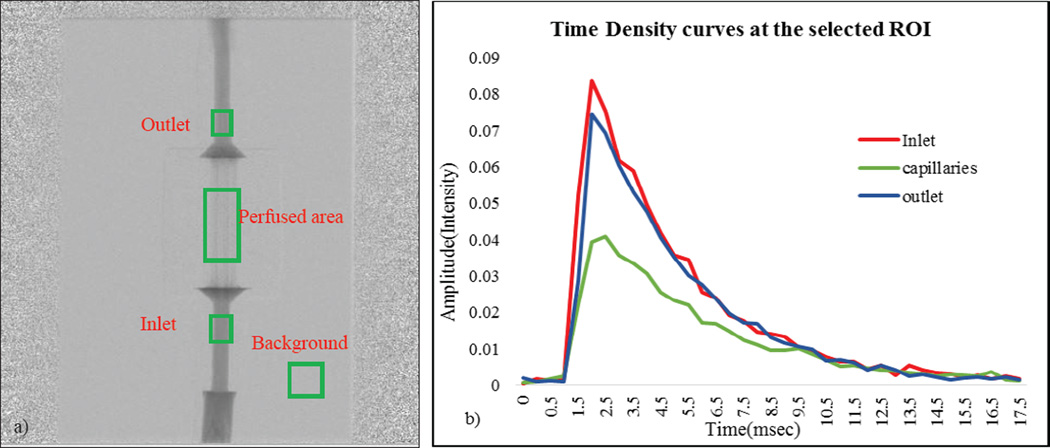
In Figure 9 we show the DSA sequence as the contrast passes through the phantom when connected in a flow loop. The rate at which the contrast clears from the phantom depends on the flow rate. For the contrast to be uniformly distributed throughout the capillaries, the flow rate at the inlet must be a minimum of 200ml/min. In Figure 10(a), we show the regions of interest chosen to measure the contrast concentration using the acquired DSA images. We chose an ROI at the background and subtracted its average value from the main regions of interest to minimize the fluctuations in the signal. In the Figure 10(b), the corresponding TDCs are plotted for a given flow rate. The angiographic system’s linear image processing was turned off and all the results were calculated using the raw data.
Figure 9.
DSA sequence as the contrast passes through the phantom at different time intervals
Figure 10.
a) DSA sequence on which ROI at the inlet, outlet and capillaries b) The TDC for the corresponding ROI
We verified our system’s sensitivity by checking the law of conservation of mass using the equation (2). Using the TDCs we calculated the integral of the contrast concentration at the inlet, outlet and the difference between the two integrals. The percentage error for the difference between the contrast concentration at inlet and outlet was on average 1.15%. The minimal error is due to is the inherent noise of the acquired images. The maximum slope for selected ROI’s at different flow rates was calculated. They were calculated using the integral values of the data. The slope is expected to linearly increase as the contrast bolus moves out of the system faster with higher flow rates.
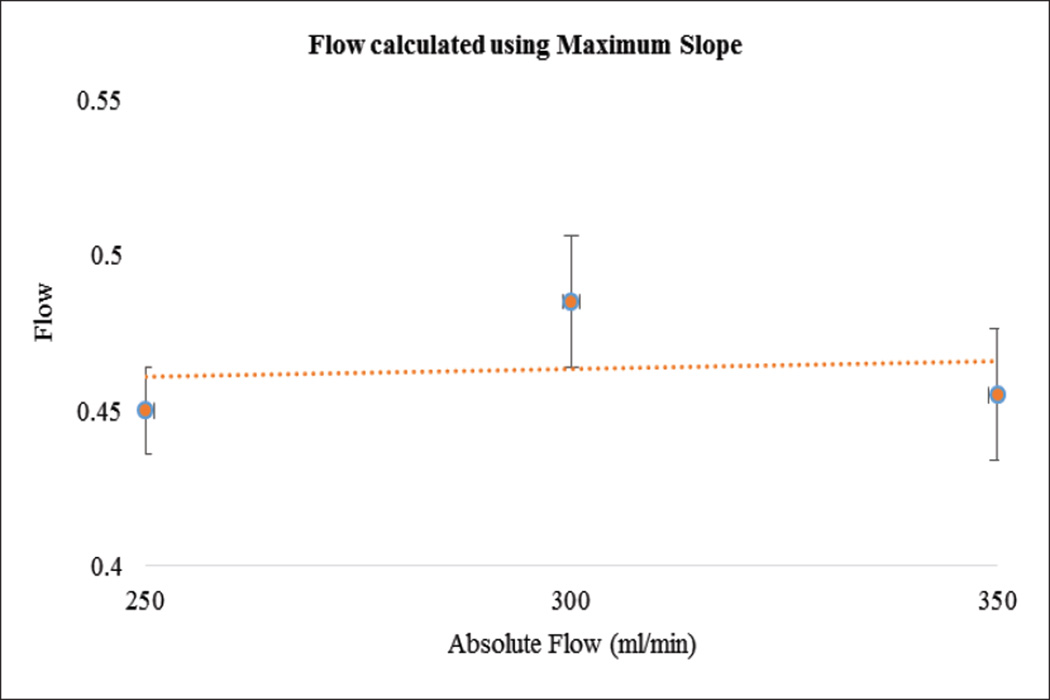
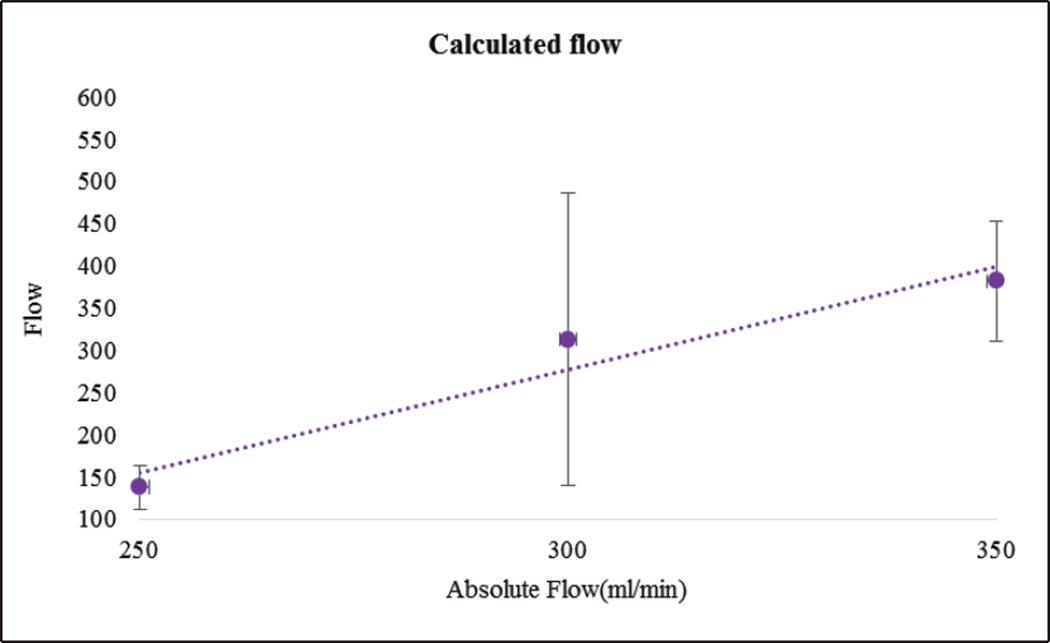
In Figure 11, as expected, maximum slope increased with flow rate. In Figure 12 we show the calculated areas under the curve using the integral values of the data which were sensitive to the flow changes. When the flow rate increased the area under the curve decreased since it takes relatively less time for the contrast to be cleared. The derived TDCs using the integral values of the data at the inlet, outlet and capillaries for different flow rates are shown in Figure 13. The derived TDCs using the maximum values of the data for different flow rates are shown in Figure 14. The amplitude (intensity) over the capillaries is less because the contrast bolus is distributed over a wide region in the capillary bed. The TDCs were well-behaved and we tested the system with varying flows-to show that our phantom is capable of producing TDCs for a wide range of flow rates. In Figure 15 we show the flow calculated using the Maximum slope as shown in equation (8) with respect to the absolute flow. The results were not accurate and did not follow the trend. This method could be used when the phantoms are longer and more complex in structure. As the 3D printed phantoms have support material in the capillaries it is very difficult to clean the longer models. In Figure 16 we show the flow calculated using the Fick Principle as shown in equation (6) with respect to the flow measured.
Figure 11.
(a–c) Maximum slope for the inlet, capillaries and outlet at different flow rates
Figure 12.
(a–c) Area under curve for the inlet, capillaries and outlet at different flow rates
Figure 13.
(a–c) Time Density Curves derived using the raw integral data at the inlet, outlet and capillaries for different flow rates
Figure 14.
(a–c) Time Density Curves using the maximum values of the data at the inlet, outlet and capillaries for different flow rates
Figure 15.
The flow calculated using the Maximum slope versus the absolute flow measured with the sensor
Figure 16.
The flow calculated using the Fick Principle versus the absolute flow measured with the sensor
4. DISCUSSION
The commercially available perfusion measurement systems need to be standardized and to be able to determine the hemodynamic parameters accurately. To meet these requirements, we developed a perfusion phantom which could be a standardized imaging perfusion tool. We were able to mechanically build the phantom with 300 microns “capillaries”, mimicking the brain vasculature at the capillary level. Our results show that the phantom has a potential to be tested with a wide range of flow rates and we derived the TDCs for every flow rate which is useful in validating the perfusion systems. For choosing lower flow rates, we did the contrast injection before the peristaltic pump so that the contrast will be well-mixed with water and distributed properly in the bed of the capillaries. But this kind of injection reduces the signal’s intensity, which is not optimal to test it with a lower rate of flow.
The first part of the validation was to examine our system’s sensitivity by checking the law of conservation of mass. Only minimal error is attributed to the noise of the acquired images. The maximum slope calculations were linearly increasing with increase in flow rate, as the slope will be steeper for higher flow rates. The area under the curve decreases with increase in flow rate, because, for the contrast moving with higher velocity of flow relatively less time is needed to pass through the system. The derived TDCs were physiologically relevant and were sensitive to any change in the flow rate. The TDCs produced were as predicted for flow rates higher than 200ml/min whereas for flow less than 150ml/min we were not able to produce the expected TDCs. We believe this is due to contrast pooling in the perfused area and that it did not clear out until we flushed the phantom with water at higher velocity. We took two runs for every flow rate we measured, calculated the mean and standard deviation to check for the reproducibility of our system. We calculated the flow using the Fick Principle: the percentage error between the flows calculated and the flow measured was 25%. However, the results were linear with increasing flow rate.
The design of the perfusion phantom is compatible to be tested with all the imaging modalities and capable of producing clinical relevant Time Density Curves for a wide range of flow rates. As there is no standard protocol to calibrate the existing imaging perfusion measurement systems, our phantom could be used as a gold standard to test and validate the commercially available systems.
5. CONCLUSIONS
We created a novel perfusion phantom and successfully tested it with an Angiographic imaging system. Since it is a uniform phantom, planar imaging is sufficient to show the initial proof of principle. The phantom design is not limited to angiographic imaging systems, but is compatible to be tested with Computer Tomographic and Magnetic Resonance Imaging systems. Therefore it could be a multimodality imaging perfusion evaluation tool.
ACKNOWLEDGMENTS
This project is supported by NIH grant 2R01EB002873and equipment grant from Toshiba Medical System Corp.
REFERENCES
- 1.Go A, Mozaffarian D, Roger V, Benjamin E, Jarett D. Heart disease and stroke statistics--2014 update: a report from the American Heart Association. Circulation. 2014;129(3):e28–e292. doi: 10.1161/01.cir.0000441139.02102.80. [DOI] [PMC free article] [PubMed] [Google Scholar]
- 2.Lipton P. Ischemic Cell Death in Brain Neurons. Physiological Reviews. 1999;79(4):1431–1516. doi: 10.1152/physrev.1999.79.4.1431. [DOI] [PubMed] [Google Scholar]
- 3.Dimitri PA. Neuropathology, An illustrated interactive course for medical students and residents. [03 December 2014];Neuropathology. < http://neuropathology-web.org/chapter2/chapter2aHIE.html>. www.neuropathology-web.org. [Google Scholar]
- 4.Markus HS. Cerebral perfusion and stroke. Journal of Neurology, Neurosurgery & Psychiatry. 2004;75(3):353–361. doi: 10.1136/jnnp.2003.025825. [DOI] [PMC free article] [PubMed] [Google Scholar]
- 5.Saver JL. Time is brain--quantified. Stroke. 2006;37(1):263–266. doi: 10.1161/01.STR.0000196957.55928.ab. [DOI] [PubMed] [Google Scholar]
- 6.Konstas AA, Goldmakher GV, Lee TY, Lev MH. Theoretic basis and technical implementations of CT perfusion in acute ischemic stroke, part 1: Theoretic basis. American Journal of Neuroradiology. 2009;30(4):662–668. doi: 10.3174/ajnr.A1487. [DOI] [PMC free article] [PubMed] [Google Scholar]
- 7.Fieselmann A, Kowarschik M, Ganguly A, Hornegger J, Fahrig R. Deconvolution-Based CT and MR Brain Perfusion Measurement: Theoretical Model Revisited and Practical Implementation Details. Int J Biomed Imaging. 2011:467–563. doi: 10.1155/2011/467563. [DOI] [PMC free article] [PubMed] [Google Scholar]
- 8.Shetty SK, Lev MH. CT Perfusion in Acute Stroke. Neuroimaging clinics of North America. 2005;15(3):481–501. doi: 10.1016/j.nic.2005.08.004. [DOI] [PubMed] [Google Scholar]
- 9.Wolf-Dieter Heiss. Ischemic Penumbra: Evidence from Functional Imaging in Man. Journal of Cerebral Blood Flow and Metabolism. 2000;20:1276–1293. doi: 10.1097/00004647-200009000-00002. [DOI] [PubMed] [Google Scholar]
- 10.Kudo K, Sasaki M, Yamada K, Momoshima S, Utsunomiya H, Shirato H, Ogasawara K. Differences in CT perfusion maps generated by different commercial software: Quantitative analysis by using identical source data of acute stroke patients. Neuroradiology. 2010 doi: 10.1148/radiol.254082000. [DOI] [PubMed] [Google Scholar]
- 11.Wood R, Iacobucci G, Khobragade P, Ying L, Snyder K, Wack D, Rudin S, Ionita C. Design and Initial Validation of a Precise Capillary Phantom to Test Perfusion Systems. Medical Physics. 2014;41(6):378–378. [Google Scholar]
- 12.Driscoll B, Keller H, Coolens C. Development of a dynamic flow imaging phantom for dynamic contrast-enhanced CT. Medical Physics Pages. 2011;38(8):4866–4880. doi: 10.1118/1.3615058. [DOI] [PubMed] [Google Scholar]
- 13.Seals K, Wack D, Besch S, Fisher J, Creighton T, Snyder K. Flow Phantom for the Validation and Quantitative Analysis of the Computer Tomography Perfusion. Stroke. 2013;44(2):0039–2499. [Google Scholar]
- 14.Axel L. Cerebral blood flow determination by rapid sequence computed tomography. A theoretical analysis. Radiology. 1980;137(3):679–686. doi: 10.1148/radiology.137.3.7003648. [DOI] [PubMed] [Google Scholar]
- 15.Miles K, Eastwood J, Konig Matthias. Multidetector Computed Tomography in Cerebrovascular Disease: CT Perfusion Imaging. American Journal of Neuroradiology. 2008;29(4):e18–e19. [Google Scholar]


