Significance
Historically, pulmonary infections treated with antibiotics killed bacteria while selecting for the unintended development of pathogenic resistance. One strategy to circumvent antibiotic resistance in pulmonary infection involves targeting the host phagosome and augmenting its function. To such an end, we have identified several small molecules, (R)-roscovitine and its derivatives, which restore microbicidal activity to compromised alveolar macrophages in cystic fibrosis (CF) and enhance function in non-CF cells. The compounds utilize G protein signaling pathways that mobilize TRPC-6 channels to the plasmalemma and subsequent phagosomal membrane formation that engulfs the bacterium. The plethora of GPCRs in resident pulmonary macrophages linked to ion channel function provides a rich source for potential therapeutic approaches to macrophage-mediated disease.
Keywords: phagosome, TRPC6, alveolar macrophage, cystic fibrosis, roscovitine
Abstract
Defects in the innate immune system in the lung with attendant bacterial infections contribute to lung tissue damage, respiratory insufficiency, and ultimately death in the pathogenesis of cystic fibrosis (CF). Professional phagocytes, including alveolar macrophages (AMs), have specialized pathways that ensure efficient killing of pathogens in phagosomes. Phagosomal acidification facilitates the optimal functioning of degradative enzymes, ultimately contributing to bacterial killing. Generation of low organellar pH is primarily driven by the V-ATPases, proton pumps that use cytoplasmic ATP to load H+ into the organelle. Critical to phagosomal acidification are various channels derived from the plasma membrane, including the anion channel cystic fibrosis transmembrane conductance regulator, which shunt the transmembrane potential generated by movement of protons. Here we show that the transient receptor potential canonical-6 (TRPC6) calcium-permeable channel in the AM also functions to shunt the transmembrane potential generated by proton pumping and is capable of restoring microbicidal function to compromised AMs in CF and enhancement of function in non-CF cells. TRPC6 channel activity is enhanced via translocation to the cell surface (and then ultimately to the phagosome during phagocytosis) in response to G-protein signaling activated by the small molecule (R)-roscovitine and its derivatives. These data show that enhancing vesicular insertion of the TRPC6 channel to the plasma membrane may represent a general mechanism for restoring phagosome activity in conditions, where it is lost or impaired.
Chronic infection and inflammation in the airways in cystic fibrosis (CF), as well as chronic obstructive pulmonary disease (COPD), tuberculosis, and asthma are now among the most common chronic diseases. Pulmonary infection associated with these diseases has historically been treated with antibiotics that kill bacteria but also select for development of resistance in the pathogen in the chronically infected lung (1, 2). One solution to antimicrobial drug resistance is to target the host rather than the pathogen. This strategy necessitates finding alternative targets or signaling strategies amplifying or restoring bactericidal capacity in the cells charged with the task of resolving chronic infection.
Mononuclear phagocytes orchestrate the innate immune response in the lung through the combinatorial interplay between the phagocytic uptake and killing of bacterial invaders, clearance of apoptotic cells, antigen presentation, and secretion of vesicle-bound signaling molecules to recruit help in the resolution of infection. Ionic fluxes across the phagosomal membrane that encloses the pathogen produce a hostile acidic environment developed through the action of a V-ATPase proton translocation. However, a positive intraphagosomal membrane potential generated by proton translocation minimizes the proton content of the phagosome. An influx of Cl− via Cl− channels reduces the membrane potential generated by the proton pump, thereby, allowing maximal acidification of the phagolysosomal compartment, which in turn maximizes the activation of lysosomal degradative enzymes, generation of hypochlorous acid, and consequent bacterial killing (3, 4). We have previously demonstrated that murine alveolar macrophages (AMs) use the anion channel cystic fibrosis transmembrane conductance regulator (CFTR) as a Cl− permeation pathway in the phagosomal membrane. In CF, loss of functional CFTR in the AM alkalinizes the phagosomal lumen and allows antimicrobial-resistant bacterial pathogens to survive macrophage surveillance.
Not all tissue macrophages use CFTR as a charge compensation pathway in phagolysosomal acidification (4). In fact, recent data suggest that multiple V-ATPase charge-shunt pathways can exist in diverse macrophage lineages (5) via lysosomal recruitment and membrane insertion upon particle uptake. This observation led us to search for possible alternative charge-shunt pathways in pulmonary macrophages and how they might be activated or targeted to the maturing phagosome. Could a pharmacological tool circumvent the defect in CF AMs and activate alternative pathways to rescue both organellar acidification and bactericidal activity in cells expressing mutations in CFTR? Such a tool might activate parallel charge-shunt pathways used in peritoneal macrophages for maximum acidification, thereby allowing them to clear bacteria independently of CFTR expression as well as amplify the microbicidal response in the presence of functional CFTR. The transport proteins and channels active in peritoneal macrophage bacterial clearance have not been described but may involve a K+/H+ exchanger important in promoting excitatory synaptic vesicle filling (6) or a cation channel moving positive charge out of the phagolysosomal compartment, as has been suggested for macrophage cell lines (7).
We began our investigations pursuing a novel pharmacological strategy to identify compounds that would resolve bacterial infection in the CF lung without the use of antimicrobials. We picked a cellular defect in CF because of the availability of animal models and extended our observations to non-CF human pulmonary cells. We designed screening assays of phagosome function, which could be used in a clinical setting as both diagnostic and investigational tools. We interrogated host function by studying surface receptor-mediated mechanisms that might provide parallel signaling pathways in subcellular organellar function in the resolution of disease.
We report that a series of small molecules first identified in chemotherapeutics, (R)-roscovitine [2-(R)-(1-ethyl-2-hydroxyethylamino)-6-benzylamino-9-isopropylpurine] and its derivatives, restore microbicidal function to compromised AMs in CF and enhance function in non-CF cells. The compounds use a G protein-mediated signaling pathway, which results in the mobilization of transient receptor potential canonical-6 (TRPC6) calcium-permeable, nonselective cation channels to the plasma membrane and subsequently to the phagosomal membrane. Members of the TRP channel family have been implicated in a number of critical phagocytic functions, including particle uptake, migration, and reactive oxygen species (ROS) production (5, 8–11). Numerous studies (12–15) have suggested TRP channels as potential targets for the development of therapies in pulmonary inflammation because of their abundant and diverse cellular expression throughout the respiratory tree. Although TRPC6 channels have been previously identified in lung macrophages and shown to be up-regulated in COPD, their precise role in the pathophysiology of the disease is yet to be determined (16). Perhaps more relevant to our study, a TRPC6-mediated Ca2+ influx is increased in human CF airway epithelial cells, possibly because of a functional association between CFTR and TRPC6 that is lost in CF (17), with unknown consequences. To our knowledge, this study is the first to associate TRPC6 channels a specific drug-targeting strategy for the resolution chronic pulmonary infection.
Results
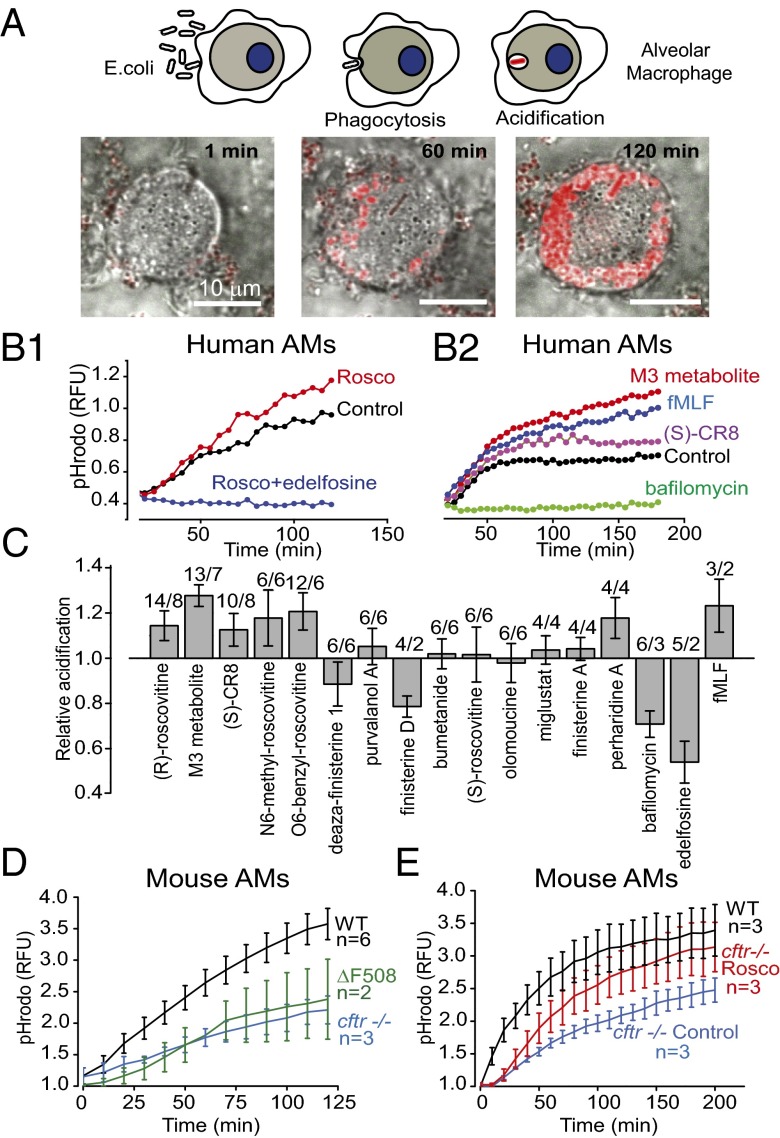
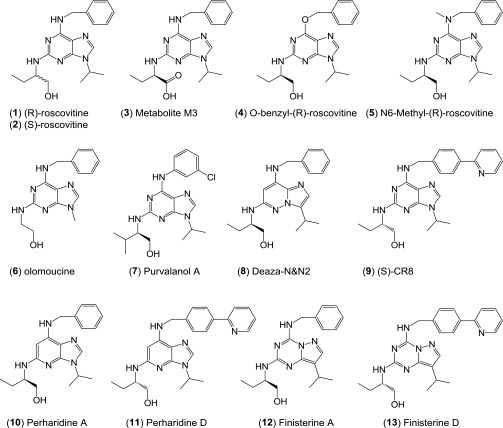
Our goal was to identify compounds that could switch defective CF macrophages to a state of enhanced microbial killing. The phagocytic sequence can be divided into three stages: recognition by and binding of a particle to a surface receptor, internalization and sequestration of the particle by an actin-dependent process, and finally, conversion of the phagosomal compartment into a microbicidal environment. The assay used to screen for innate immunity enhancers targeted the final step in the process. Phagosomal acidification is a prerequisite for efficient bacterial killing (18); thus, our first screen was for compounds that enhanced phagosomal acidification upon internalization of bioparticles conjugated to the pH-sensitive dye pHrodo, as depicted in Fig. 1. Human AMs were isolated from bronchoalveolar lavage (BAL), plated and cultured in multiwell plates, and exposed to dye-conjugated lyophilized Escherichia coli particles for phagocytic uptake (Fig. 1A). The kinetics of phagosomal uptake and acidification were read in a plate reader over a period of 3 h, during which time cells continued to take up particles as well as acidify. In a screen of kinase modulatory small molecules, (R)-roscovitine and related purines were identified as candidate compounds for significantly enhancing acidification of phagosomal pH over that observed in untreated cells (Fig. 1 B and C). Negative controls in the screen included the V-ATPase inhibitor bafilomycin (Baf) and the potent phospholipase C inhibitor edelfosine (ET-18-OCH3), previously shown to prevent phagocytic uptake at the level of actin assembly (19). The N-formyl peptide, fMLF, which binds to a GPCR, inducing mobilization of intracellular Ca2+, production of ROS, and chemotaxis in human and murine phagocytes, was used as a positive control. The fMLF receptor family forms a class of proteins that enhance the innate immune response and have been proposed as viable targets for therapeutic drug development (20). (R)-roscovitine (shortened to roscovitine or “rosco” in the figures), first identified as a cyclin-dependent kinase (CDK) inhibitor, is also capable of resolving inflammation (see ref. 21 for review). The structures and kinase inhibitory activity of (R)-roscovitine and related molecules identified in the screen are given in Fig. S1 and Tables S1 and S2. Some molecules triggering enhanced acidification displayed little or no kinase inhibitory activity [e.g., M3 (oxo-roscovitine), the major hepatic (R)-roscovitine biodegradation metabolite, N6-methyl-roscovitine, “O6-benzyl-roscovitine”], whereas some potent kinase inhibitors [deaza-finisterine, finisterine A and D, (S)-roscovitine, olomoucine] were unable to induce acidification, suggesting that kinase inhibition is unlikely to contribute to the organellar acidification properties of (R)-roscovitine and its analogs. The acidification aspect of the screen was replicated using AMs isolated from cftr+/+ (wild-type), cftr−/−, and ΔF508 mice (Fig. 1D). As in previously published studies (3, 4), cells either lacking CFTR expression or expressing the mutant protein showed decreased acidification compared with cftr+/+ cells. Treatment of cftr−/− cells with (R)-roscovitine (20 µM) restored acidification to a level not significantly different from that observed in cftr+/+ cells (Fig. 1E). Clearly, a parallel non-CFTR–related acidification pathway exists in cftr−/− macrophages.
Fig. 1.
(R)-roscovitine (rosco) and related derivatives potentiate phagosomal acidification in human AMs. (A) Schematic of phagocytosis and pHrodo red-labeled lyophilized E. coli particle acidification. Merged differential interference contrast (DIC) and fluorescence images for AMs following a 120- to 200-min loading with the pH sensor pHrodo red-labeled particles. (Scale bars, 10 µm.) (B1 and B2) Kinetics of acidification for representative compounds in human AMs isolated from BAL. Data in B1 and B2 are representative drug response comparisons in AMs obtained from two patients. (C) Comparative effects of various compounds on relative acidification levels in human AMs measured in a plate reader after 120 min of bioparticle feeding. Data summary from two to eight patients for each compound tested at 10 µM; n = experiments/BAL above each bar. Experimental populations for all figures are summarized in Table S4. (D) Comparison of the relative acidification time course obtained from cftr+/+ (wild-type), cftr−/−, and ΔF508 AMs. (E) Comparison of acidification time course from cftr+/+ (wild-type) AMs and cftr−/− AMs in the presence and absence of 20 µM (R)-roscovitine. Experiments done in triplicate were averaged and presented as means ± SEM; n = mice.
Fig. S1.
Structures and kinase activity of (R)-roscovitine and related small molecules identified in the screen. Protein kinase selectivity of (R)-roscovitine and its metabolite M3 (oxo-roscovitine). (R)-roscovitine and its metabolite M3 were tested at various concentrations on 18 purified kinases, as previously described (12). IC50 values, calculated from the dose–response curves, are reported in micromolars. LmCK1, Leishmania major CK1; PfGSK-3, Plasmodium falciparum GSK-3; all other kinases are mammalian.
(R)-Roscovitine Rescues Phagosomal Acidification in the Absence of Functional CFTR Expression: Direct Video Observations.
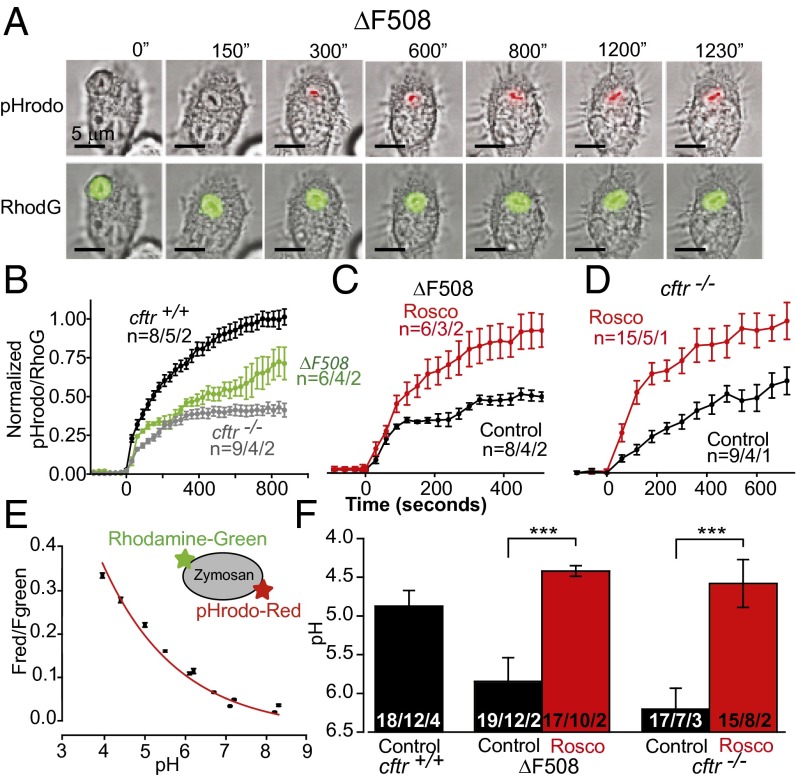
An increase in total acidification registered in the plate assay could be because of an increase in particle uptake, an increase in acidification in unitary phagosomes, or both. To resolve the relative contribution of both pathways to the response, we examined the time course and acidification of individual phagosomes in the presence of candidate compounds, as well as average particle uptake per cell in single-cell live video microscopy (Fig. 2A) on murine cells, where we could manipulate the functional expression of CFTR and, therefore, phagosomal acidification. These experiments examined whether: (i) (R)-roscovitine enhanced phagosomal acidification, particle uptake, or both; and (ii) whether (R)-roscovitine could rescue the acidification/microbicidal defect in cftr−/− and ΔF508 AMs independent of CFTR expression. Cells were exposed to zymosan particles doubly conjugated to the content marker Rhodamine-green and the pH indicator, pHrodo red, in the presence and absence of (R)-roscovitine (20 µM). We examined and compared the relative time course of acidification for all genotypes (Fig. 2B) and compared the rescue of acidification by (R)-roscovitine in AMs from ΔF508 and cftr−/− animals (Fig. 2 C and D). The ratio of pHrodo red to rhodamine green fluorescence was converted to pH using an in situ calibration protocol (Fig. 2E) and used to compare phagosomal pH data across genotypes in Fig. 2F. (R)-roscovitine enhanced phagosomal acidification by 1.5 pH units in ΔF508 AMs (pH 5.9 to pH 4.4) and a similar amount in the cftr−/− cells (pH 6.2 to 4.6). No significant change in phagocytic index was observed for cftr+/+ or ΔF508 AMs (Table S3) following (R)-roscovitine treatment. The average number of ingested particles per cell was 2.48 ± 0.07 (n = 551) before and 2.25 ± 0.07 (n = 409) after (R)-roscovitine treatment for cftr+/+, and 1.93 ± 0.12 (n = 316) before and 2.10 ± 0.10 (n = 387) after (R)-roscovitine treatment for ΔF508 AMs. Surprisingly, however, in addition to restoring acidification, (R)-roscovitine also increased the cellular activation index (the percentage of phagocytizing cells) in ΔF508 AMs from 44% to 69%, which was equivalent to that seen in cftr+/+ cells (73%).
Fig. 2.
Rescue of phagosomal acidification in murine ΔF508 and cftr−/− AMs by (R)-roscovitine. (A) A representative murine (ΔF508) cell loaded with doubly conjugated pHrodo red and rhodamine green zymosan particles and observed over time. (B) Representative averaged time course of phagosomal acidification for the three genotypes in the absence of drug. (C) Comparative time course of acidification in ΔF508 and (D) cftr−/− AMs in the presence and absence of 20 μM (R)-roscovitine. Cells were exposed to drug for 20 min before the addition of zymosan. Data are presented as means of fluorescence ± SEM and were normalized to fluorescence ratio changes observed in untreated control cells in B and to the (R)-roscovitine–treated cells in C and D. (E) pHrodo red and rhodamine green fluorescence ratios (Fred/Fgreen) were calibrated in vivo using a three-component buffer at the indicated pH values in digitonin-permeabilized cells. (F) Summary data using endpoint acidification values obtained in experiments similar and in addition to those in B–D. The endpoint of each treatment was determined as the average of last three time points on the acidification curves. Values for pH were determined by interpolation. The average pH in phagosomes was: cftr+/+ 4.87 ± 0.2; ΔF508 5.85 ± 0.31 and 4.42 ± 0.07 following (R)-roscovitine treatment; cftr/− 6.2 ± 0.27 and 4.58 ± 0.31 following (R)-roscovitine treatment. Data in B–F expressed as mean ± SEM; n = particles per cells per mice. Significance level: ***P < 0.001 (two-way ANOVA).
(R)-Roscovitine Rescues Bacterial Killing in a CFTR- and Kinase-Independent Manner.
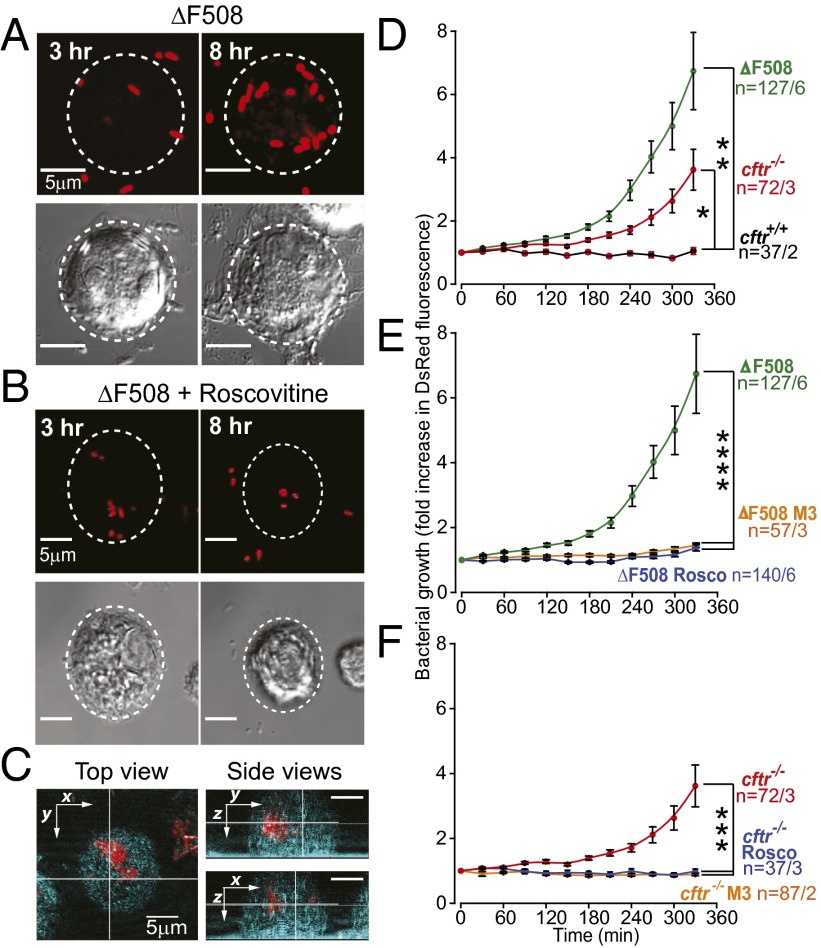
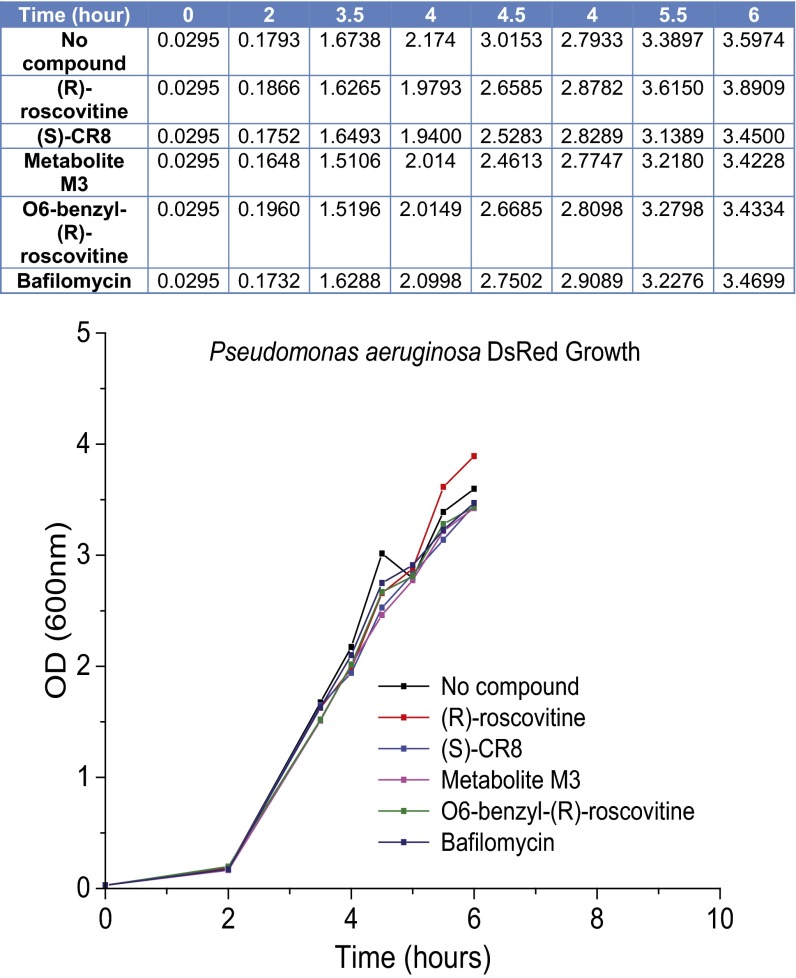
Given the tight coupling between phagosomal acidification, host-signaling response, lysosome fusion, and most importantly, bactericidal activity (3, 22, 23), we examined whether (R)-roscovitine could restore bacterial killing profiles in AMs from cftr−/− and ΔF508 CFTR-expressing mice. In these experiments, cultured AMs were exposed to (R)-roscovitine (20 μM) for 15–30 min before exposing cells to live, DsRed-expressing Pseudomonas aeruginosa. Cells were allowed to ingest bacteria in the continued presence of (R)-roscovitine and were observed by live-cell video microscopy over a 6-h period for an increase in fluorescence indicative of bacterial growth, either in the phagosome or in the cytoplasm following escape from the phagosome (Fig. 3 A–C). Intracellular bacterial growth as a function of genotype is compared in Fig. 3 D–F. As expected, both ΔF508 CFTR and cftr−/− cells showed a reduction in bacterial killing, in contrast to wild-type, cftr+/+ cells (Fig. 3D). (R)-roscovitine significantly rescued bacterial killing in ΔF508 CFTR-expressing cells (Fig. 3E), as well as in cftr−/− cells (Fig. 3F) to levels similar to that seen in cftr+/+. The CDK kinase-inactive derivative of (R)-roscovitine, M3, also rescued bacterial killing, validating that (R)-roscovitine rescue of bacterial killing is independent of its activity as a kinase inhibitor. Neither (R)-roscovitine nor its derivative M3 at a concentration of 20 µM revealed either direct bactericidal or bacteria static activity in cell free assays (Fig. S2).
Fig. 3.
(R)-Roscovitine rescues bacterial killing defects in cftr−/− and ΔF508 AMs. (A) Representative fluorescence and DIC images of an outlined cell from a ΔF508 mouse under control conditions and (B) in the presence of (R)-roscovitine with ingested bacteria at 3 and 8 h. Note: bacteria in B appear smaller because of lower magnification. (C) Intracellular localization of DsRed-expressing bacteria was confirmed by 3D reconstruction of confocal z-stacks of bacterial fluorescence and cellular reflection/backscatter. Orthogonal views inside one cell are shown in two right panels, confirming intracellular bacterial growth. (D) Summary data from at least three separate experiments comparing bacterial growth over time assayed as mean DsRed fluorescence intensity (λ = 607 ± 20 nm) and compared across genotypes, (E) in ΔF508 AMs in the presence and absence of (R)-roscovitine or M3 metabolite, 20 μM, and in (F) in cftr−/− AMs in the presence and absence of either (R)-roscovitine or M3 metabolite, 20 μM. Bacterial growth in cftr−/− cells compared with growth in ΔF508 AMs was not significantly different across all time points. Data are presented as means of fluorescence intensities ± SEM. Significance levels determined by one-way ANOVA (*P < 0.05, **P < 0.01, ***P < 0.001, and ****P < < 0.0001) were determined for six last time points in E and four last time points in F; n = cells per mice.
Fig. S2.
(R)-roscovitine and its analogs do not prevent bacterial growth. The growth rate of DsRed expressing P. aeruginosa was estimated by the measurement of optical density at indicated time intervals. Both (R)-roscovitine and its analogs were unable to prevent bacterial growth when added at the following concentrations: (R)-roscovitine 20 µM, (S)-CR8 20 µM, M3 20 µM, O6-benzyl-(R)-roscovitine 20 µM, bafilomycin 1 µM. P. aeruginosa DsRed from a single colony was grown in gentamicin containing TSB overnight at 37 °C with agitation at 300 rpm. The following day, a new culture at 1/100 dilution was started in an array of tubes and the indicated compounds were added. Optical density of the cultures was measured at 660 nm at 30-min intervals.
Patch Clamp Evidence That (R)-Roscovitine Activates a TRPC6 Conductance in AMs Independent of CFTR Expression.
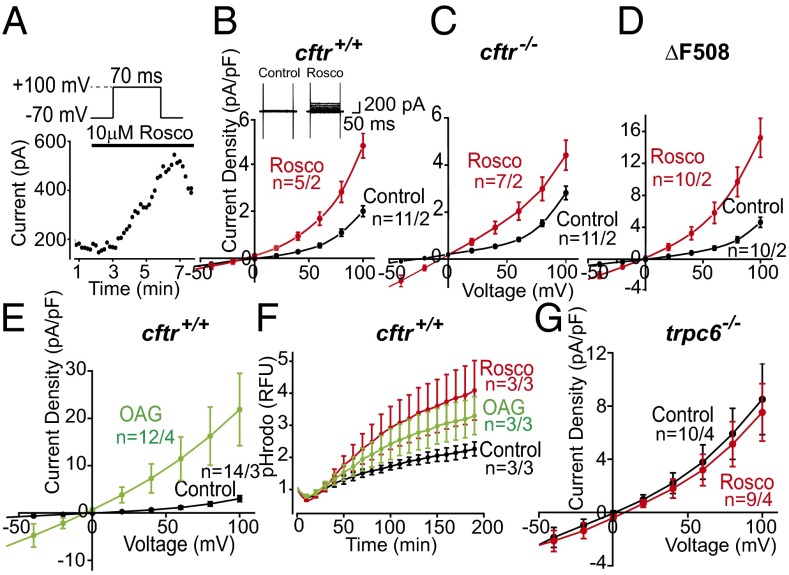
Postulating that (R)-roscovitine might open an unidentified ion channel in the plasma membrane that would eventually be incorporated into the phagosomal membrane during the uptake of cargo, we performed whole-cell voltage-clamp experiments on cultured murine AMs isolated from cftr+/+, cftr−/−, and ΔF508 animals. Experiments were carried out using solutions in which the equilibrium potential for Cl− was set to −31 mV, allowing us to differentiate anion from cation selective currents. We monitored current activation (Fig. 4A) following a 10-µM (R)-roscovitine exposure and observed a lag of ∼3–5 min before a current increase was detected at a depolarized potential of +100 mV. This lag suggested that (R)-roscovitine was not activating channels directly. Drug-induced current activation while maintaining the whole-cell configuration was observed inconsistently, with variable results in both activation time course and current amplitude. We attributed this to the possible loss of a cellular signaling factor integral to the (R)-roscovitine response via the whole-cell patch pipette. To avoid possible current rundown (as seen in Fig. 4A), we performed a population study comparing currents immediately after establishing the whole-cell configuration in cells across genotypes in the presence and absence of (R)-roscovitine (Fig. 4 B–D). In the presence of (R)-roscovitine, AMs of the three genotypes displayed current activation in the voltage range between −50 and +100 mV, exhibiting a reversal potential of ∼0 mV. Thus, the (R)-roscovitine sensitive current was: (i) not a Cl− selective conductance, (ii) was likely a nonselective cation current with significant inward rectification, and furthermore, (iii) was not dependent on CFTR expression. (R)-roscovitine–activated currents were similar in selectivity to those reported (24) for the heterologously expressed recombinant human TRPC6 channels: nonselective cation channels that are Ca2+-permeable. Expression of TRPC6 channels has been reported in human AMs and is known to be elevated in AMs originating from patients who are smokers and from those diagnosed with COPD (16). TRPC6 channels are gated through direct interaction with diacylglycerol (DAG) or its membrane permeant analog 1-oleoyl-2-acetyl-sn-glycerol (OAG). To explore the possibility that TRPC6 channels could contribute to the (R)-roscovitine currents, OAG-induced currents were recorded from cftr+/+ AMs in standard Na+ and K+ containing bath and pipette solutions (Fig. 4E). The OAG-induced current voltage (I-V) relationship was similar to that seen with (R)-roscovitine (Fig. 4 B–D). OAG current density was much larger than that observed with (R)-roscovitine because of the fact that OAG activates channels directly, whereas (R)-roscovitine activation is indirect.
Fig. 4.
(R)-Roscovitine activates TRPC6 conductance in murine AMs. (A) Time course of whole-cell current activation following treatment with (R)-roscovitine. Cells were depolarized to +100 mV for 70 ms from a holding potential of −70 mV at 10-s intervals. Peak current at +100 mV is plotted as a function of time following (R)-roscovitine addition to the bath. (B) Average current-voltage (I-V) relationship from wild-type (cftr+/+) cells examined in either control or 20 μM (R)-roscovitine-containing solutions. (Inset) Representative whole-cell voltage-clamp recording of AM in the initial absence of drug and subsequent application of (R)-roscovitine. (R)-roscovitine-associated whole-cell currents were elicited during a series of test pulses from −100 to +100 mV in 20-mV increments from holding potential −40 mV. (C) Average I-V relationship from cftr−/− cells examined in control solution or solution containing 20 µM (R)-roscovitine, (D) from ΔF508 cells examined in control or solution containing 20 µM (R)-roscovitine, and from (E) wild-type (cftr+/+) cells examined in control solution or in solution containing 100 µM OAG. (Inset) Representative whole-cell voltage-clamp recording of wild-type AMs in bath solution with and without OAG. Voltage protocol as in B, above. (F) Plate-reader comparison of the time course and amplitude of acidification (in arbitrary units) in wild-type AMs as a function of ingested pHrodo red-conjugated E. coli under control conditions (black), with 20 µM (R)-roscovitine (red), or 100 µM OAG (green). Experiments were performed in triplicate and averaged for each mouse with three mice per treatment. (G) Average I-V relationship recorded from trpc6 −/− cells examined in control and 20 µM (R)-roscovitine containing bath solution. Solution compositions for bath and pipette in each experimental condition are given in SI Materials and Methods; number of mice in each experiment is given in Table S4 and indicated in the plots as n = cells per mice.
Plasma membrane TRPC6 channels incorporated into the nascent phagosomal membrane upon particle uptake would facilitate cation loss from the lumen, both divalent and monovalent, augmenting a Cl−-dependent charge-shunt pathway, if present. The two charge-shunt pathways acting in concert would be expected to enhance phagosome acidification as seen in the non-CF human screening data (Fig. 1). Both (R)-roscovitine and OAG significantly enhanced acidification following bioparticle uptake compared with control (Fig. 4F). Thus, either a Cl− entry pathway (control) or the cation efflux [OAG/(R)-roscovitine] pathway could act alone to shunt V-ATPase–mediated accumulation of positive charge in the lumen.
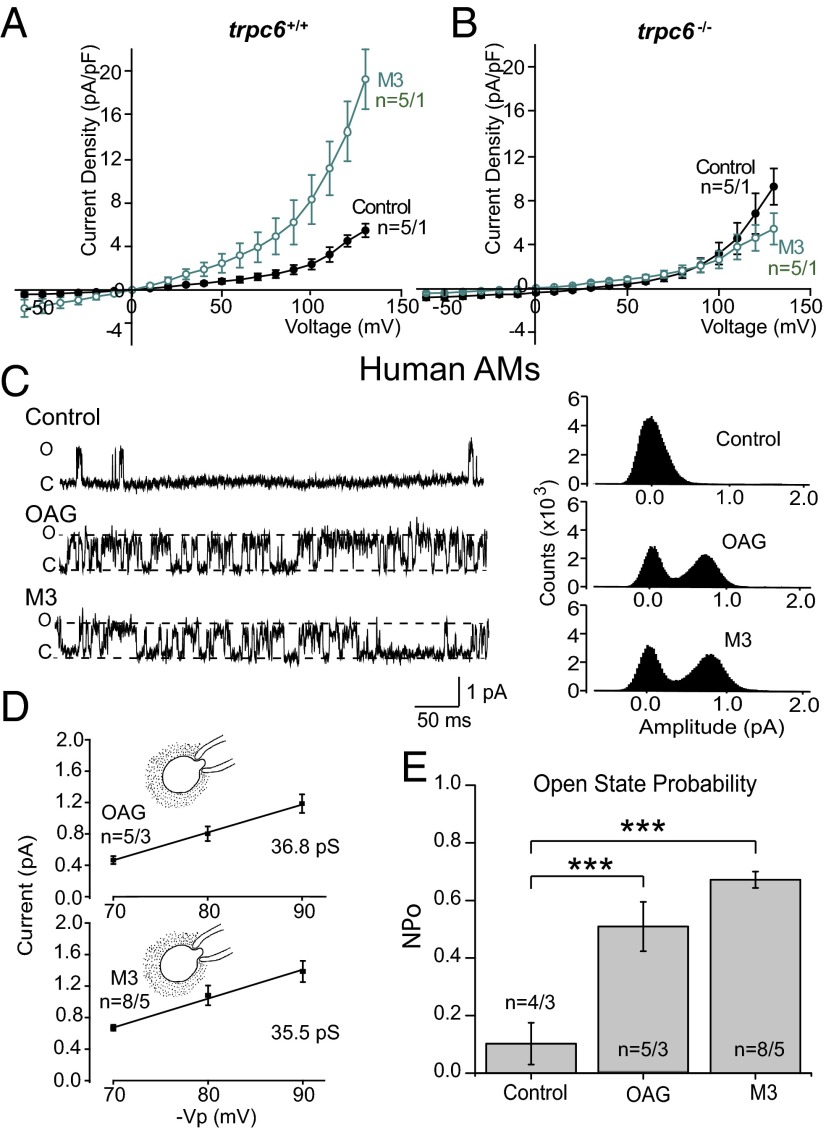
To verify that (R)-roscovitine–activated currents were dependent upon TRPC6 expression, we carried out voltage-clamp experiments on AMs isolated from trpc6−/− animals. As seen in Fig. 4G, (R)-roscovitine failed to induce current activation in the absence of TRPC6 expression. The kinase inactive (R)-roscovitine derivative, M3, showed a similar current-activation profile and was dependent upon TRPC6 expression as well (Fig. 5 A and B). To further establish that (R)-roscovitine activates currents indirectly through a second messenger mechanism active at the internal surface, we performed cell-attached single-channel experiments in which the agonists M3 and OAG were added to the bath solution outside the pipette while currents across the chemically inaccessible patch membrane were observed. Single-channel open-state probability was compared under control conditions and in the presence of either M3 or OAG (Fig. 5C) with a significant increase observed in the presence of either agonist (Fig. 5E). Single-channel I-V relationships for the channels activated in the presence of the bath applied agonists were similar for M3 and OAG, and the observed values were consistent with the single-channel conductance of 35 pS reported for TRPC6 in the literature (25, 26) (Fig. 5D). These data demonstrate that (R)-roscovitine activates channels indirectly and, furthermore, current activation is dependent upon TRPC6 expression.
Fig. 5.
The (R)-roscovitine derivative, M3, activates TRPC6 channels in human and murine AMs using an internal pathway. (A) Peak I-V relationships recorded from wild-type cells examined in control (n = 5 cells) and in 10 µM M3 containing bath solution (n = 5 cells). M3-stimulated whole-cell currents were elicited during a series of test pulses from −60 to +140 mV in 10-mV increments from a holding potential of −40 mV. (B) I-V relationships from trpc6−/− cells examined in control bath solution (n = 5 cells) and in solution containing 10 µM M3 (n = 5 cells). (C) Representative cell-attached single channel recordings in human AMs of OAG and M3 elicited currents with corresponding all-points amplitude histograms. Recordings were taken with 250 nM apamin, 10 µM Pyr10, 10 µM GlyH 101, and 200 µM DIDS in the pipette solution to block contaminating channel currents. (D) Single-channel I-V relationships and single-channel conductance in human AMs detected in the presence of either M3 (10 µM) or OAG (50 µM) outside of the pipette. Cell-attached patches were not exposed to the agonist in the bath. Mean single-channel amplitude was determined from three patches at each voltage. Calculated single-channel conductance was 36.8 pS for OAG treatment and 35.5 pS for M3 treatment. (E) Summary of single-channel open-state probabilities recorded with bath applied OAG or M3 in human AMs as in C. Open-state probabilities were 0.10 ± 0.07 (n = 4 patches) under control conditions, 0.67 ± 0.02 (n = 8 patches) in the presence of M3, and 0.50 ± 0.08 (n = 5 patches) in the presence of OAG. All records were obtained at Vp = +80 mV. Significance level: ***P < 0.001 (two-way ANOVA). Solution composition for bath and pipette in each experimental condition are given in SI Materials and Methods; number of mice and patient BAL samples in each experiment is given in Table S4 and indicated in the plots as n = cells per mice or cells per BAL.
Translocation of TRPC6 to the Plasma Membrane upon Exposure to (R)-Roscovitine and Subsequent Incorporation into Phagosomal Membranes.
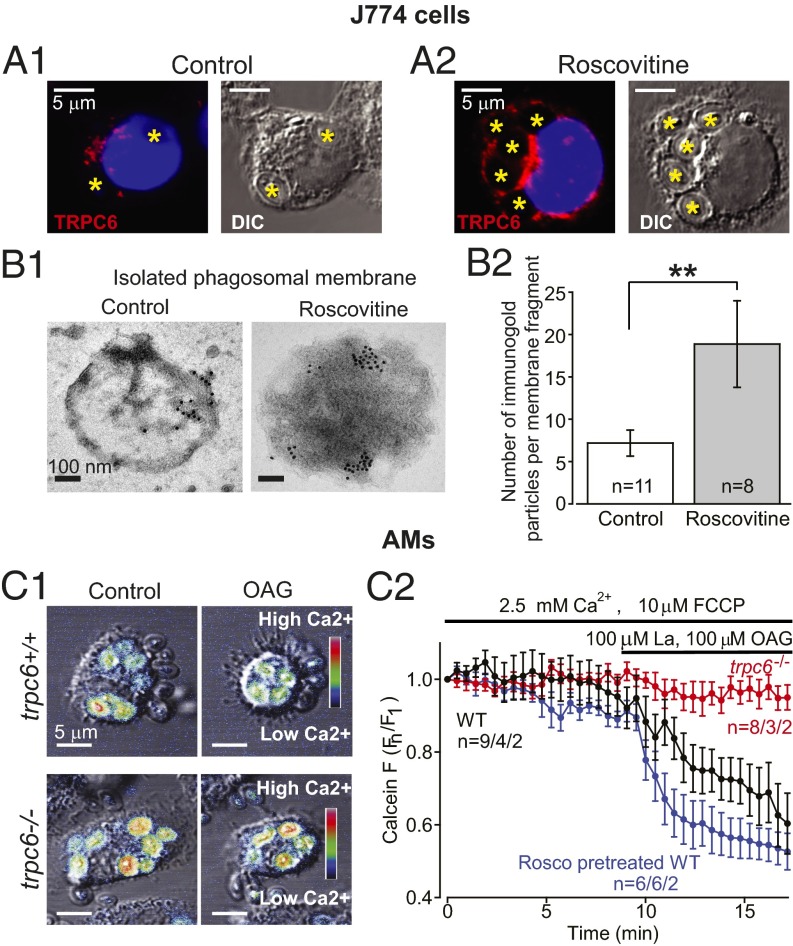
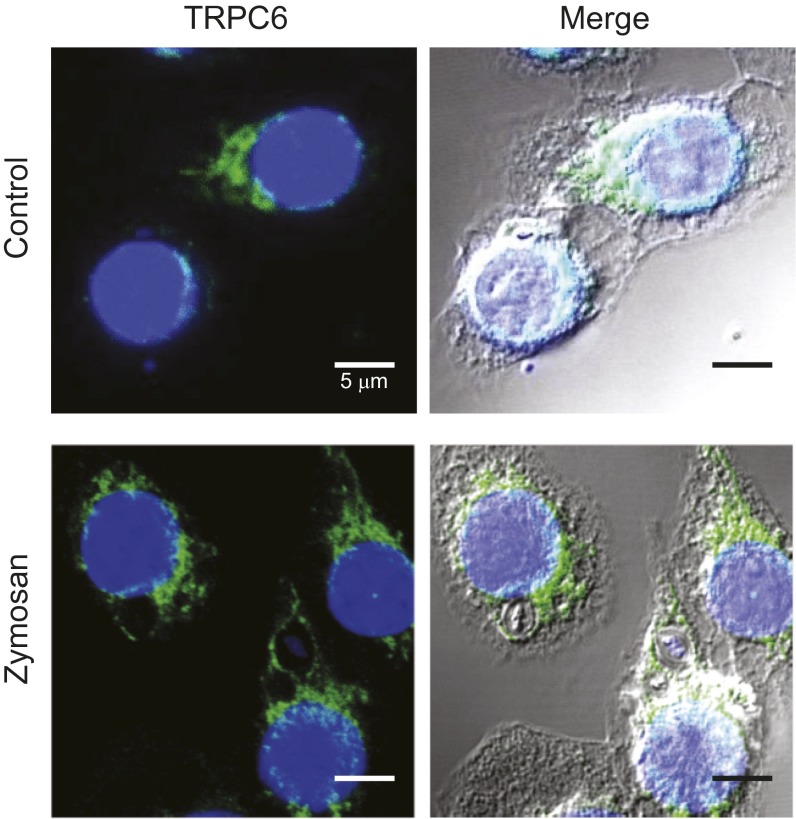
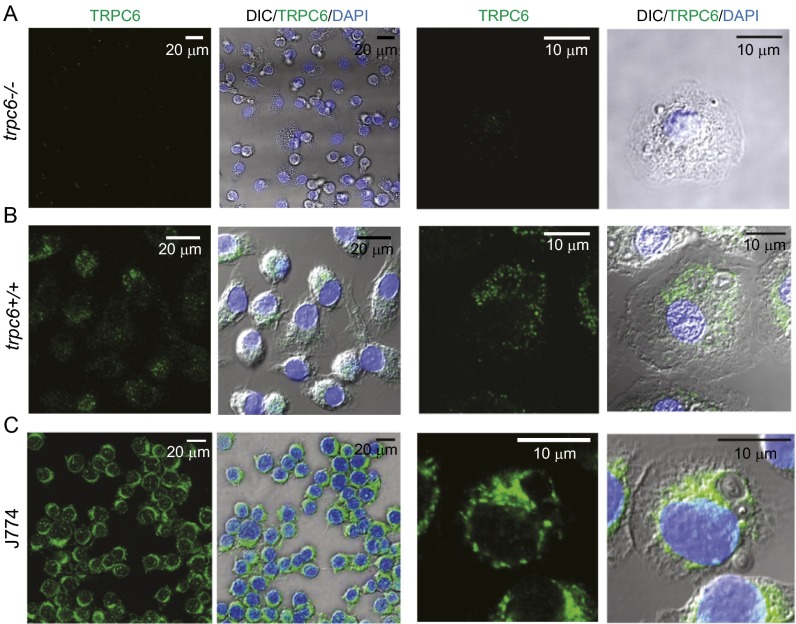
We verified that TRPC6 is expressed in murine macrophage-like J774 cells in experiments using an antibody to the C-terminal cytoplasmic domain, α-hTRPC6796–809, as shown in Fig. 6A and Fig. S4. Significant TRPC6 expression was observed for murine AMs as well (Fig. S3 B and C). TRPC6 was diffusely distributed throughout the cytoplasm of resting cells in a clustered manner suggesting vesicle localization. Although TRPC6 localization around phagocytosed zymosan particles can be visualized in immunocytochemical images, direct proof that TRPC6 is incorporated into the phagosomal membrane is seen at high resolution in the immuno-electron micrographs in Fig. 6 B, 1. Immunogold labeling of isolated phagosomal membrane fragments from (R)-roscovitine-treated cells using α-hTRPC6796–809 demonstrated significant TRPC6 localization over that seen in the control membranes (Fig. 6 B, 2), indicating clustering and possible targeting to membrane lipid rafts as has been reported for a number of TRP channels (27–31). Recent data demonstrate that hypoxia induces TRPC6 translocation to caveolin- and sphingolipid-rich membrane rafts in human pulmonary artery smooth-muscle cells (32).
Fig. 6.
Functional TRPC6 expression in AMs and J774 cells. (A1) Confocal immunofluorescence images of TRPC6 distribution in representative J774 cells following zymosan particle phagocytosis (engulfed zymosan particles are marked with an asterisk). (A2) Following (R)-roscovitine (20 µM) exposure, TRPC6 colocalizes and surrounds the zymosan particles in a ring-like manner. (B1) Immunogold labeling of TRPC6 on isolated phagosomal membranes from nontreated as well as (R)-roscovitine–treated J774 cells. (Scale bar, 100 nm.) TRPC6 antibody staining was undetectable in trpc6−/− AMs, demonstrating antibody specificity for TRPC6 (see Fig. S3). (B2) Comparative summary of immunogold labeling of isolated phagosomal membrane fragments with equivalent area. Data were analyzed for n = 11 phagosomal fragments (images) under control conditions and n = 8 fragments for cells pretreated with (R)-roscovitine before particle uptake. Significance level: **P < 0.01 (Fisher's exact test). (C1 and C2) Calcein-monitored Ca2+ changes in phagosomes before and after (R)-roscovitine or OAG in trpc6+/+ and trpc6−/− AMs: (C1) Merged confocal fluorescent and DIC images of phagocytosed zymosan particles in trpc6+/+ (Upper) and trpc6−/− (Lower) AMs. Zymosan particles were preloaded with calcein (100 µM) and added to cells in bath solution containing 2.5 mM Ca2+ and the protonophore FCCP (10 µM). Upon stimulation with OAG (100 µM), there was a rapid loss of Ca2+ from the phagosomes of trpc6+/+cells, but not from trpc6−/− cells. Calcein fluorescence images were depicted with a heat scale lookup table and merged with DIC images and displayed as before (Control) and after exposure to OAG. (C2) Time course of calcein fluorescence intensity change in phagosomes from: trpc6−/−, trpc6+/+, and trpc6+/+ cells pretreated with (R)-roscovitine (20µM) (with indicated numbers of analyzed phagosomes per cells per mice). Lanthanum (100 µM) was coapplied with OAG to block plasmalemmal TRPC6 channel activation and preserve intracellular Ca2+ levels; 10 µM FCCP was added to prevent phagosomal acidification in the presence of the pH-sensitive calcein. Sample size: n = phagosomes per cells per mice.
Fig. S4.
TRPC6 localization to phagosomal membranes. TRPC6 distributes evenly throughout the cytoplasm of resting J774 cells (Control), then undergoes translocation to phagosomal membranes upon internalization of zymosan particles. Note the circumferential staining around phagocytosed zymosan particles. Staining procedure was the same as described for Fig. S3. Confocal Imaging was performed on Leica TCS SP5 2-photon microscope with a 63× magnification oil objective (NA 1.4).
Fig. S3.
Comparative TRPC6 immunofluorescence in AMs from trpc6+/+ and trpc6−/− mice and cells from the murine cell line J774. Alveolar macrophages from trpc6+/+ and trpc6−/− mice were stained with rabbit polyclonal anti-TRPC6 antibody and NucBlue dye. (A) The lack of antibody staining in tpc6−/− AMs confirms α-hTRPC6796–809 specificity. (B) AMs from trpc6+/+ animals exhibit TRPC6 protein (green) diffusely dispersed in the cytoplasm as punctuate structures of variable intensity. (C) TRPC6 is expressed in cells from the murine macrophage-like cell line, J774. To verify TRPC6 antibody specificity for α-hTRPC6796–809, we compared immunofluorescence in cells derived from trpc6+/+ and trpc6−/− animals. AMs were stained with an affinity-purified rabbit polyclonal antibody generated against residues 796–809 in the C-terminal domain. Adherent cells were treated with 20 µM (R)-roscovitine or vehicle for 10 min, rinsed with PBS, and fixed in ice-cold acetone at –20 °C. After overnight incubation with blocking buffer (10% goat serum, 0.5% BSA and 0.1% Triton X-100), cells were incubated sequentially with primary and secondary antibodies at dilutions of 1:250 for 1 h at room temperature with washes between incubations. Nuclei were stained with NucBlue Live Cell Stain for 20 min, washed with PBS, and mounted with SlowFade reagent (Molecular Probes/Life Technologies). Confocal Imaging was performed on Leica TCS SP5 2-photon microscope with a 63× magnification oil objective (NA 1.4).
Direct Measurement of Ca2+ Loss from Phagosomes Following Activation of TRPC6.
The ionic content of the phagosome initially reflects that of the extracellular solution: high in Ca+2, Na+, and Cl−. Activation of TRPC6 channels in the phagosomal membrane would permit the efflux of Ca2+ as well as Na+ from the phagosomal lumen down their electrochemical gradient. To evaluate this hypothesis, we exposed murine AMs to zymosan particles, which had been saturated in an extracellular solution containing both the fluorescent Ca2+-sensitive dye, calcein (100 µM), and the protonophore, FCCP (10 μM). Cells were allowed to take up the zymosan particles and calcein fluorescence was measured in the absence of TRPC6 activation. Exposure of the cells to an extracellular solution containing 100 μM La3+ to block the plasma membrane Ca2+-permeable channels and 100 μM OAG to activate the phagosomal TRPC6 channels, resulted in the loss of Ca2+-dependent calcein fluorescence from wild-type cells (Fig. 6C). As shown in Fig. 6 C, 2, wild-type cells treated with 20 μM (R)-roscovitine showed an enhanced kinetic loss of fluorescence over wild-type. Phagosomes in trpc6−/− cells showed no loss in Ca2+-dependent calcein fluorescence over the same time period demonstrating directly the functional role of TRPC6 activation in phagosomal membranes.
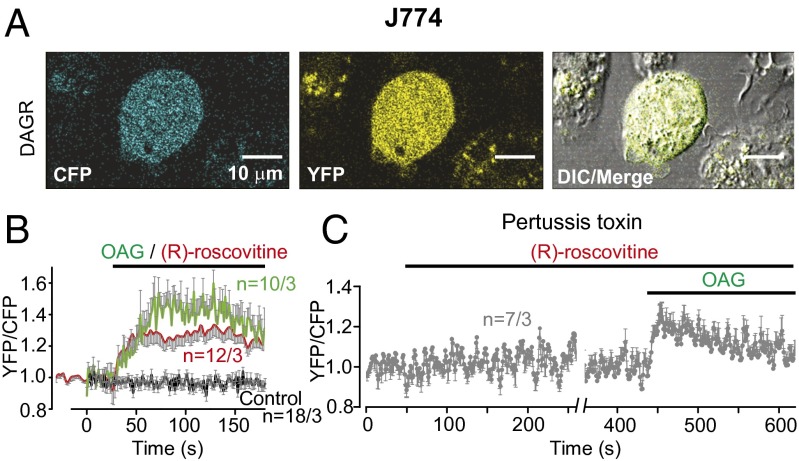
The activation of an OAG-sensitive current, TRPC6, at both the plasma and phagosomal membranes in the presence of OAG and (R)-roscovitine would predict that (R)-roscovitine might be acting indirectly through a GPCR of unknown identity. Such receptors are plentiful on the macrophage surface and include formyl peptide, adenosine, and purinergic, as well as chemokine receptors (33–36). If (R)-roscovitine acts through a GPCR, our prediction would be that we should see measureable DAG generation. The expression of a DAG-sensitive CFP/YFP FRET reporter (DAGR) (37) in J774 cells, allowed us to measure the kinetics of DAG generation in the response to 50 µM (R)-roscovitine (working concentration for J774 cells) and 100 µM OAG (Fig. 7 A and B). In these experiments, OAG acts as a positive control for DAGR expression and function, as both DAG and its analog OAG bind to the DAGR. OAG allowed us to estimate the maximum DAGR response. Both OAG and (R)-roscovitine induced FRET signals, indicative of a (R)-roscovitine–induced GPCR-mediated response. To further confirm that DAG was generated through a GPCR pathway, we repeated the experiment in the presence of pertussis toxin (PTX) (Fig. 7C). The ability of PTX to inhibit (R)-roscovitine-induced DAG generation in the J774 cells confirmed the interaction of (R)-roscovitine with an unidentified GPCR and associated signaling cascade.
Fig. 7.
(R)-roscovitine generates DAG via a PTX-sensitive GPCR activation pathway. (A) Representative cellular expression of the FRET-based CFP/YFP DAG-reporter in J774 cell fluorescent and DIC images. (Scale bar, 10 µm.) (B) Time course of (R)-roscovitine–generated DAG production in transfected J774 cells following exposure to 50 µM (R)-roscovitine (red trace, 12 cells) or 100 µM OAG (green trace, 10 cells) treatment. The gray trace represents cellular responses in DAG reporter-expressing cells in the absence of drug treatment (18 cells). (C) (R)-roscovitine (50 µM) failed to elicit DAG production in J774 cells treated with PTX (300 ng/mL) overnight. Subsequent addition of OAG (100 µM) elicited maximum DAG reporter detection and provided a control for DAGR expression (seven cells). Mean FRET ratio values are indicated as solid lines and error bars in gray indicate SEM. Number of the cells and experiments is given in Table S4 and indicated in the plots as n = cells per experiments.
(R)-Roscovitine Induces an Increase in the Frequency of Intracellular Ca2+ Oscillations, Which Is Dependent Upon External Ca2+.
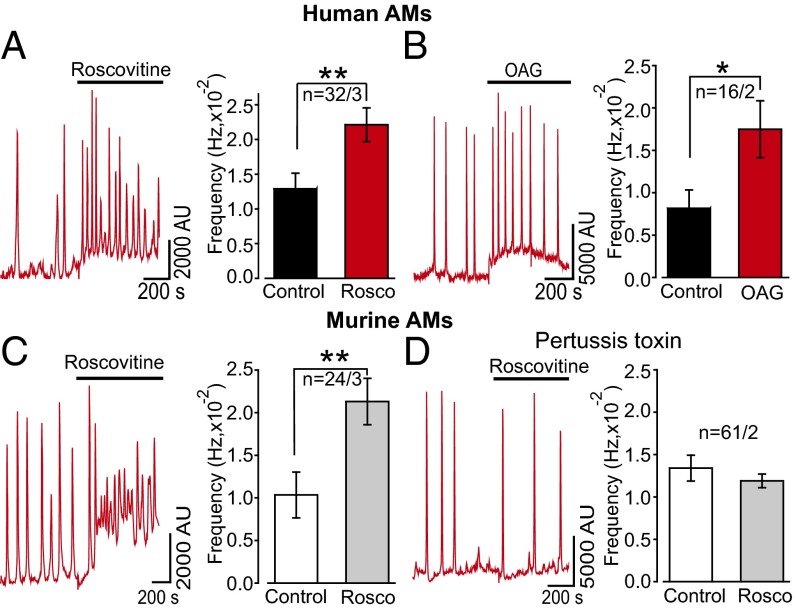
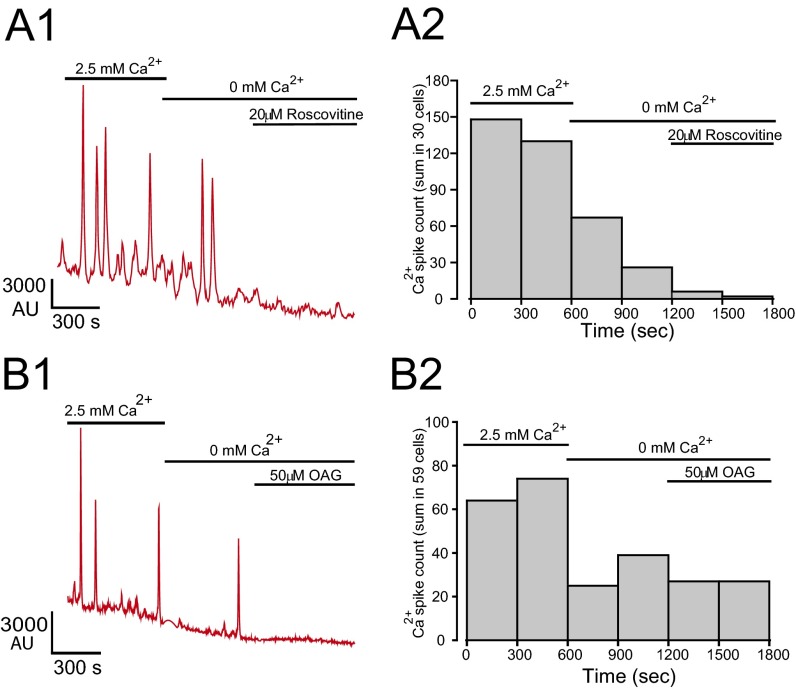
If (R)-roscovitine opens a Ca2+-permeable TRPC6 channel, it follows that we should observe this interaction as an increase in internal Ca2+ dependent upon (R)-roscovitine exposure. In Fluo-4AM imaging experiments carried out on both murine and human AMs, exposure to (R)-roscovitine led to increases in the frequency of spontaneous Ca2+ oscillations (Fig. 8 A and B). Ca2+ oscillations have been previously described in macrophages, however only in association with phagocytosis (38, 39). As in the electrophysiological studies, the TRPC6 agonist, OAG, mimicked (R)-roscovitine in increasing Ca2+ spike frequency (Fig. 8C). Oscillations decayed rapidly following the removal of Ca2+ from the extracellular solution, indicating their dependence upon extracellular Ca2+ influx. Application of (R)-roscovitine did not rescue the decline in oscillations after extracellular Ca2+ withdrawal (Fig. S5), consistent with our electrophysiological observations demonstrating (R)-roscovitine’s indirect activation of TRPC6 Ca2+-permeable channels through a GPCR signaling pathway. Application of OAG in the absence of extracellular Ca2+ also failed to enhance Cai oscillation frequency (Fig. S5), a finding consistent with their genesis through TRPC6 activation and subsequent Ca2+ influx.
Fig. 8.
Intracellular Ca2+ oscillations induced by (R)-roscovitine are dependent upon GPCR activation and mimicked by the DAG analog, OAG, in human and murine AMs. Experiments were carried out on cultured AMs using Fluo-4AM as the Ca2+ indicator dye within 2 d after isolation. (A) Representative traces showing increases in spontaneous Ca2+ oscillation frequency in human AMs (n = 32 cells, 3 BAL human samples) following exposure to (R)-roscovitine (50 μM, 15 min). In any given field, only a subpopulation of cells exhibited oscillatory behavior. In human AMs, 35% exhibited spontaneous oscillations, whereas 18% of murine AMs showed the same behavior. The (R)-roscovitine effect was most visible on oscillating cells; therefore, we confined our analysis to cells with spontaneous oscillations. There was no obvious morphological difference between oscillating and nonoscillating cells at rest. (B) Data from murine AMs (n = 24 cells, 3 mice) are as described for human cells in A. (C) Representative Ca2+ oscillations and frequency analysis of human AMs in response to application of 50 µM OAG (n = 16 cells, 2 BAL human samples). (D) Representative Ca2+ oscillations and frequency analysis of murine macrophages pretreated for 6 h with 300 nM PTX prior application of 50 µM (R)-roscovitine (n = 61 cells, 2 mice). Significance levels: *P < 0.05, **P < 0.01 (two-way ANOVA). Number of mice and BAL in each experiment is given in Table S4 and indicated in the plots as n = cells per mice or cells per BAL.
Fig. S5.
Calcium oscillations induced by (R)-roscovitine and OAG are dependent upon extracellular Ca2+ in murine AMs. Experiments were carried out using the methodology described for Fig. 8. (A1) Oscillatory behavior induced by (R)-roscovitine in murine cells was dependent upon the presence of extracellular Ca2+. Removal of Ca2+-containing bath solution resulted in a rapid diminution of spontaneous oscillations. Sequential application of 20 µM (R)-roscovitine did not rescue the disappearance of Ca2+ oscillations. (A2) A cumulative histogram of Ca2+ spikes (n = 30 cells, two experiments) showing initial high activity in the presence of extracellular Ca2+. Experiments were carried out on cultured AMs using Fluo-4AM as the Ca2+ indicator dye within 1 d after isolation. (B1) Representative Ca2+ oscillations and (B2) frequency analysis of murine AMs in response to application of 50 µM OAG. Sequential application of Ca2+-free media in the external solution followed by the application of 50 µM OAG did not restore Ca2+ oscillations. In B2, cumulative histogram of Ca2+ spikes derived from 59 cells in two experiments as in B1, showing initial high activity in the presence of extracellular Ca2+. Bin width was 300 s.
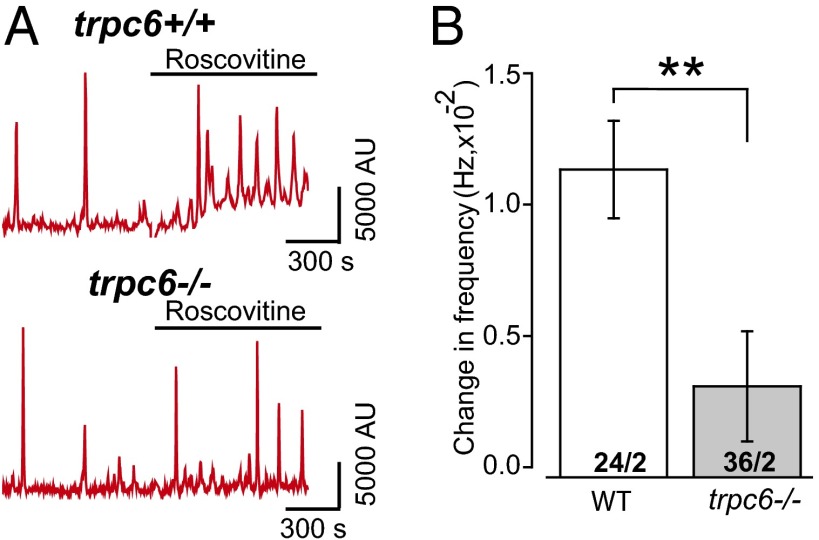
To further elucidate whether (R)-roscovitine gates a Ca2+-selective pathway directly from the external surface or indirectly (i.e., at the cytoplasmic side through a GPCR generating IP3 and DAG to activate TRPC6), we determined whether the (R)-roscovitine–enhanced Ca2+ oscillations were dependent upon G-protein activation. If (R)-roscovitine gates the TRPC6 channel directly independent of a second messenger-signaling pathway, inhibiting G-protein activation with PTX should have no effect on the frequency or amplitude of Ca2+ oscillations. To test this, cells were pretreated with PTX (300 ng/mL) for at least 6 h and examined for (R)-roscovitine enhancement of oscillatory responses. Data from these experiments, summarized in Fig. 8D, demonstrated that PTX treatment prevented the (R)-roscovitine–enhanced increase in Ca2+ oscillation frequency, consistent with (R)-roscovitine acting through a GPCR. (R)-roscovitine–induced oscillations were dependent upon the expression of TRPC6 failing to enhance Ca2+ oscillation frequency in trpc6−/− cells (Fig. 9).
Fig. 9.
(R)-roscovitine–induced increase in internal Ca+2 oscillations is dependent upon TRPC6 expression. (A) Representative Ca2+ oscillations from trpc6+/+ and trpc6−/− mice before and following exposure to 50 µM (R)-roscovitine. (B) Summary of the (R)-roscovitine–induced increase in Ca2+ oscillation frequency comparing first and last 200-s bin time periods [before and after application of (R)-roscovitine] observed in trpc6+/+ (n = 24 cells, 2 mice) and trpc6−/− cells (n = 36 cells, 2 mice). Significance level: **P < 0.01 (two-way ANOVA).
Direct Measurement of (R)-Roscovitine Induced Exocytotic Insertion of TRPC6 into the Plasma Membrane Following GPCR Activation in Human AMs.
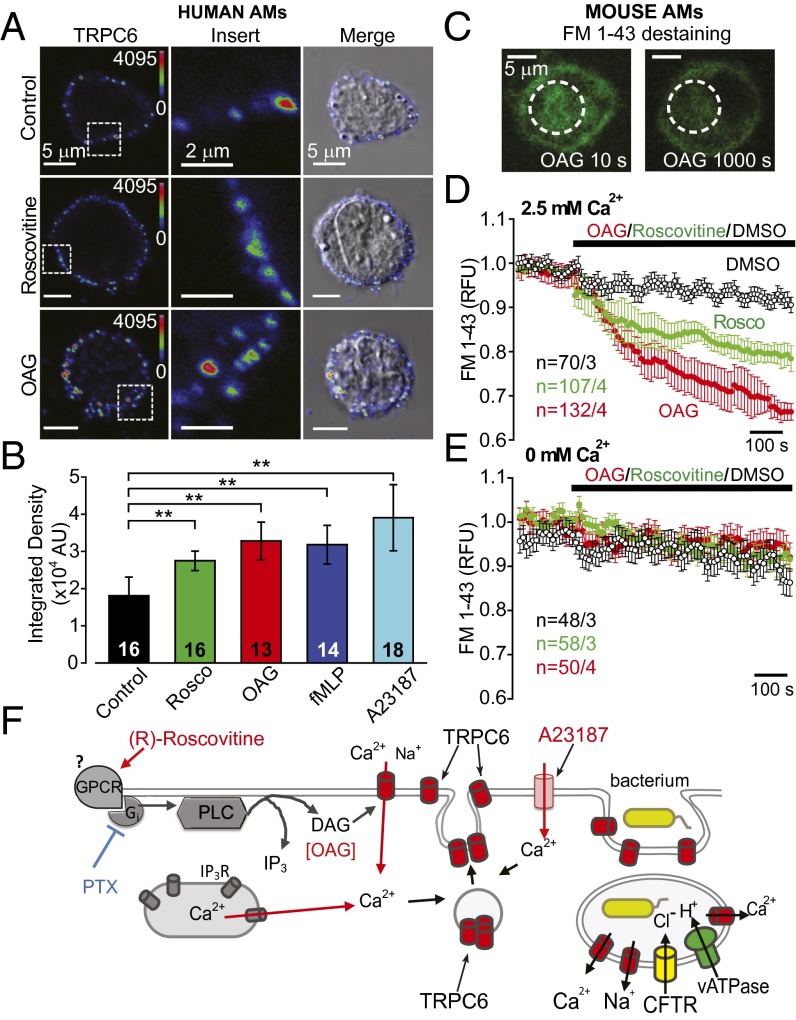
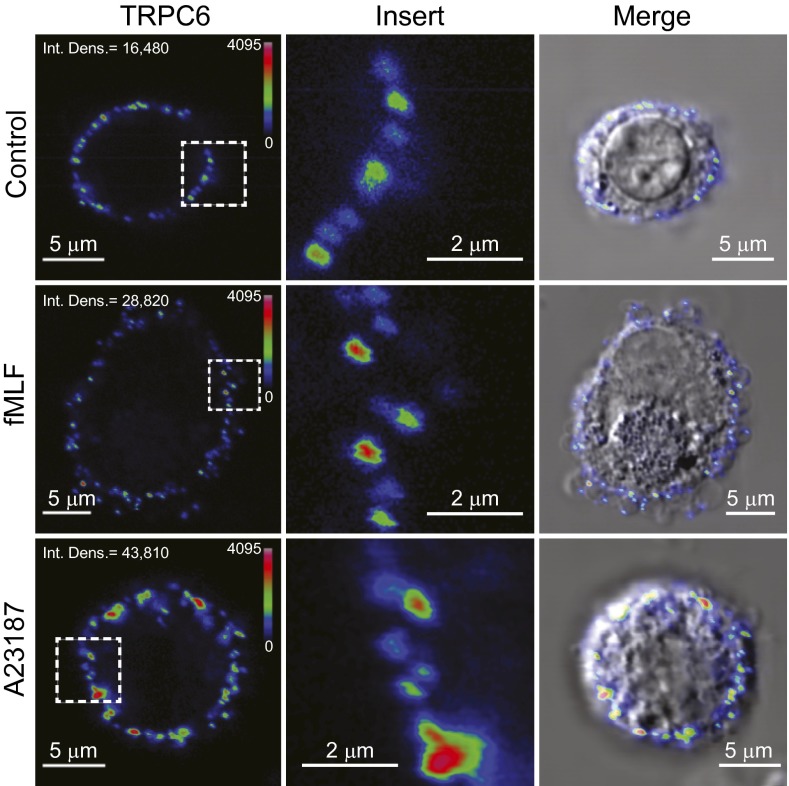
Quantification of the increase in TRPC6 plasma membrane localization following (R)-roscovitine treatment was determined in human AMs using an antibody directed at the extracellular domain of the protein, α-rTRPC6573–586. Fig. 10A shows immunocytochemical surface labeling of representative cells under control conditions and following treatment with (R)-roscovitine and OAG, both shown to enhance current activation and Ca+ signaling. The formyl peptide fMLF and 4-bromo-A23187, both agents known to mobilize Ca2+, also showed significant enhancement of surface localization (Fig. S6). Quantification of the enhancement of surface labeling showed significant increases in surface staining for all compounds over that seen at steady-state in control cells (Fig. 10B), indicating that any stimulus capable of generating increases in DAG and Ca2+ might also be efficient in promoting both phagosomal acidification and killing, as was seen for fMLF in the initial acidification screen (Fig. 1 B and C).
Fig. 10.
(R)-roscovitine as well as OAG induce exocytotic insertion of TRPC6 channels into the plasma membrane. (A) Human AMs were stained with α-rTRPC6573–586; cells were treated with either 20 µM (R)-roscovitine or 100 µM OAG for 15 min at 37 °C before fixation for microscopy. A color gradient scheme (Rainbow) was used to highlight increased density of TRPC6 surface labeling following (R)-roscovitine or OAG treatment. A 5 × 5-µm square of surface staining was highlighted in the Left column of images and expanded in the Center column to clearly illustrate denser TRPC6 surface labeling. The Right column depicts an overlay of the TRPC6 immunofluorescence image with its corresponding DIC image. (B) Comparative summary of surface TRPC6 expression quantified as mean fluorescence integrated density (area × mean value of fluorescence intensity) ± SEM. Significance level: **P ≤ 0.01 (Mann–Whitney rank sum test); cell number in center of the bars. (C) Representative images of murine AMs, loaded with the membrane marker FM1-43, before (10 s) and after (1,000 s) application of OAG. Note the significant decrease in cytoplasmic staining following OAG treatment which reflects the exocytotic release of FM1-43 into the bath following exocytosis. (D) Comparative time-dependent changes in cytoplasmic FM1-43 fluorescence following exposure of murine AMs to 100 µM OAG or 50 µM (R)-roscovitine in 2.5 mM Ca2+-containing bath solution. (E) In Ca2+-free bath solution no significant temporal changes in FM1-43 fluorescence were observed during OAG or (R)-roscovitine treatments. (F) Proposed model for (R)-roscovitine interaction with an as yet unidentified GPCR and the downstream signaling pathway leading to the exocytotic insertion of vesicular TRPC6 channels into plasma membrane and their subsequent activation by DAG. Sample size (n = cells per mice) indicated for each condition and detailed in Table S4.
Fig. S6.
Calcium mobilizing agents induce insertion of TRPC6 channels into the plasma membrane. Human AMs were incubated with either 10 µM fMLF or 5 µM 4-bromo-A23187 for 15 min at 37 °C, fixed in 2% PFA, and stained with α-rTRPC6573–586. The antibody was generated against a peptide composed of residues 573–586, found in the second extracellular loop domain in rat TRPC6 (Alomone,). Immunocytochemistry was performed as described in the Materials and Methods and data analyzed as in Fig. 10.
The membrane dye FM1-43 has been used extensively to track exocytosis, endocytosis, and recycling of secretory granules or vesicles (40). FM1-43 molecules, when present in the extracellular solution, insert into the plasma membrane and are internalized during endocytosis. The newly formed vesicles retain dye in their inner leaflet as well as in the vesicle lumen while in the cytoplasmic compartment (Fig. 10C). When stimulated to undergo exocytosis in a dye-free medium, the vesicles lose their fluorescent content (Fig. 10C). Thus, the exocytotic response is measured as a decrease in intracellular fluorescence or destaining. We used this technique to measure the kinetics of the exocytotic translocation of vesicles upon treatment with either (R)-roscovitine or OAG (Fig. 10D). In the presence of extracellular Ca2+, both (R)-roscovitine and OAG induced significant destaining of the AM intracellular compartment over that observed in the absence of drug. The exocytotic vesicle insertion was dependent upon external Ca2+, as seen in Fig. 10E. Thus, although this technique does not allow for the identification of the vesicle-type or cargo, the correlation between immunocytochemical data (Fig. 10A), electrophysiological current activation, and Ca2+ signaling support the hypothesis that vesicle fusion is responsible for the enhancement TRPC6 plasma membrane expression as schematically represented in Fig. 10F. G protein-mediated activation of phospholipase C leads to the production of DAG and IP3. DAG opens Ca2+-permeable, plasmalemmal TRPC6 channels, whereas IP3 binds to its cognate receptor (IP3R) on the endoplasmic reticulum, triggering release of Ca2+ from internal stores. The consequent rapid rise in cytoplasmic Ca2+ facilitates the translocation and fusion of TRPC6-containing vesicles to the plasma membrane. These same channels are incorporated into phagosomal membranes upon bacterial engulfment.
Causal Relationship Between TRPC6 and Phagosome Acidification.
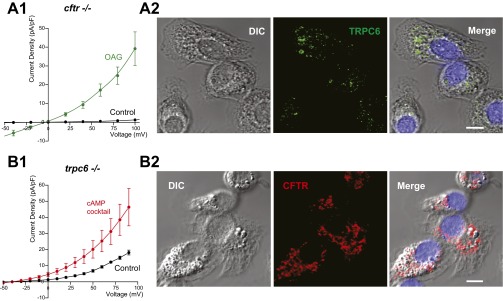
Although it is clear that (R)-roscovitine is causally related to TRPC6 activation and translocation, the next set of experiments were directed at determining whether TRPC6 expression is causally related to enhancement of phagosomal function. If both CFTR and TRPC6 subserve the same charge-shunt function in the phagosome, eliminating the expression of one of the channels would still leave the other to facilitate acidification. Before proceeding, we carried out experiments to determine if CFTR is expressed in trpc6−/− cells and vice versa, the results of which are given in Fig. S7. TRPC6 current was activated by OAG in cftr−/− cells and expression confirmed by immuno-localization, as seen in Fig. S7A. Conversely, the cAMP-elevating mixture elicited current in the trpc6−/− cells, corroborating positive immunostaining for CFTR in Fig. S7B.
Fig. S7.
Activation and localization of TRPC6 in cftr−/− cells and CFTR in trpc6−/− AMs. (A1) I-V relationship obtained from cftr−/− cells in the presence and absence of the DAG analog OAG. Experiment was carried out as in Fig. 4E. Cells were examined in control external solution (n = 6) and in bath solution containing 100 µM OAG (n = 5). The bath solution contained: 125 mM NaCl, 2.5 mM KCl, 10 mM Hepes, 1.5 mM MgCl2, 2.5 mM CaCl2, 6 mM d-glucose, 28 mM sucrose to adjust osmolarity to 310 mOsm, pH 7.3 was adjusted with NaOH. The patch pipettes were filled with solution containing: 130 mM CsCl, 10 mM Hepes (pH 7.3 with CsOH), 0.05 mM EGTA, 1 mM MgCl2, 5 mM MgATP. Sucrose was added to adjust osmolarity to 290 mOsm. (A2) Confocal images of TRPC6 expression in the cftr−/− cells. Note the punctate cytoplasmic distribution of TRPC6 in the unstimulated cells. OAG present in the bath solution in A1 would activate the limited numbers of TRPC6 channels present in the plasma membrane in the unstimulated state. The resultant influx of Ca2+ gives rise to further TRPC6 containing vesicular insertion into the plasma membrane. The positive feedback of Ca2+ influx through inserted TRPC6 channels gives rise to the maximum current activation with OAG seen in A1. Rabbit polyclonal affinity-purified TRPC6 antipeptide antibody, α-hTRPC6796–809, 1:250; DAPI nuclear staining. (Scale bar, 5 µm.) (B1) Average I-V relationships for CFTR currents activated at 110 mM from a holding potential of −40 mV in the presence of the cAMP mixture in the pipette solution (10 µM forskolin, 1 mM IBMX, 400 µM pCPT-cAMP) for n = 3 cells over a period of 15–20 min. The pipette solution contained: 100 mM NMDG-glutamate, 40 mM NMDG-Cl, 2 mM MgCl2, 0.2 mM CaCl2, 1 mM EGTA, 10 mM Hepes, 5 mM Mg-ATP, pH 7.2. The bath solution contained: 140 mM NMDG-Cl, 2 mM CaCl2, 2 mM MgCl2, 10 mM Hepes, pH 7.4. Control currents were obtained immediately after obtaining the whole cell configuration (t = 0) before the diffusion of the cAMP mixture into the pipette. Maximum ICFTR activation was obtained ∼15–20 min later. (B2) Confocal images of CFTR expression in the trpc6−/− cells. Cells stained with R3194 IgG affinity-purified rabbit polyclonal antibody raised against CFTR-C-tail peptide, amino acids 1467–1480 used at 1:100 (kind gift of C. Marino, Memphis VA Medical Center, Memphis, TN). (Scale bar, 5 µm.)
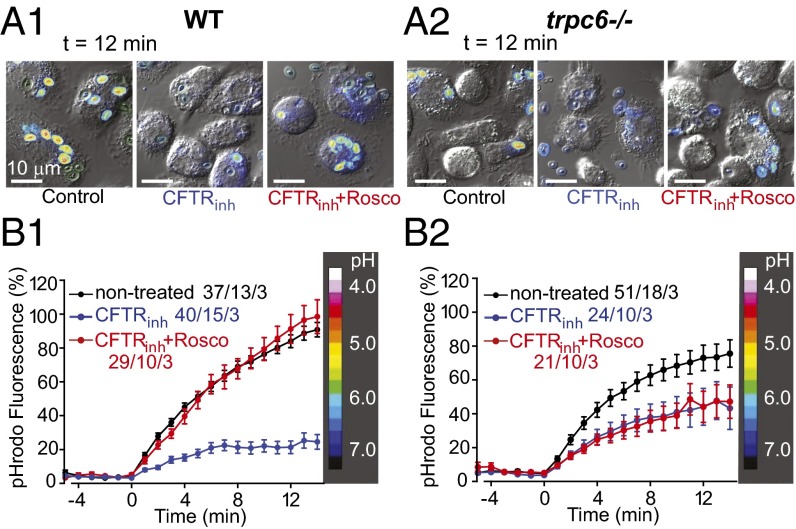
Given these findings, we used the CFTR inhibitor, CFTRinh172, to reveal the effect of TRPC6 on acidification in the presence and absence of (R)-roscovitine. In Fig. 11A we compared the kinetics and magnitude of phagosomal acidification in wild-type AMs expressing both CFTR and TRPC6 (cftr+/+/ trpc6+/+). In these cells, phagosomes containing pHrodo-labeled zymosan particles failed to acidify in the presence of CFTRinh172 (30 μM). Treatment of the cells with both CFTRinh172 and (R)-roscovitine showed phagosomal acidification equal to or modestly enhanced over that observed in untreated control cells, allowing us to conclude that (R)-roscovitine–induced recovery of phagosomal function was not dependent upon CFTR activation. Similar experiments performed in trpc6−/− (cftr+/+/trpc6−/−) cells (Fig. 11B) revealed the unanticipated finding that the absence TRPC6 expression led to a significant decrease in phagosomal acidification over that observed in wild-type (cftr+/+/ trpc+/+) cells, indicating that both anion and cation channels participated in steady-state phagosomal function. As expected, the trpc6−/− cells were highly sensitive to CFTRinh172. Finally, (R)-roscovitine in the presence of CFTRinh172 failed to rescue acidification in the trpc6−/− cells, showing a direct and causal relationship between (R)-roscovitine, TRPC6 expression, and phagosomal acidification.
Fig. 11.
(R)-Roscovitine enhances acidification in CFTRinh172-treated trpc6+/+ (wild-type) cells but not in the trpc6−/− cells. (A1 and A2) Representative fluorescence-DIC image overlays of trpc6+/+ (wild-type) (A1) and trpc6−/− (A2) AMs with pHrodo red-labeled zymosan at t = 12 min following loading under three conditions: DMSO control, 10 µM CFTRinh172, and 10 µM CFTRinh172 plus 20 µM (R)-roscovitine. (B1) Time course of phagosomal acidification in wild-type AMs under the following conditions: DMSO control (black trace), 10 µM CFTRinh172 (blue trace), 10 µM CFTRinh172 plus 20 µM (R)-roscovitine (red trace). (B2) Time course of phagosomal acidification in trpc6−/− AMs under the same conditions as in B1. Heat scale along the right y axis correlates changes in pHrodo red zymosan color intensities in the above images with a calibrated pH value range. Data are displayed as means ± SEM. Sample size (n = phagosomes/cells/mice) indicated for each condition and detailed in Table S4.
Discussion
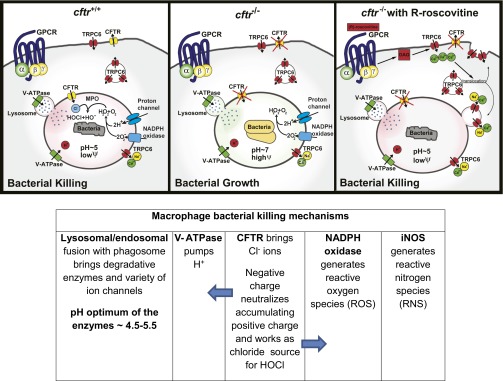
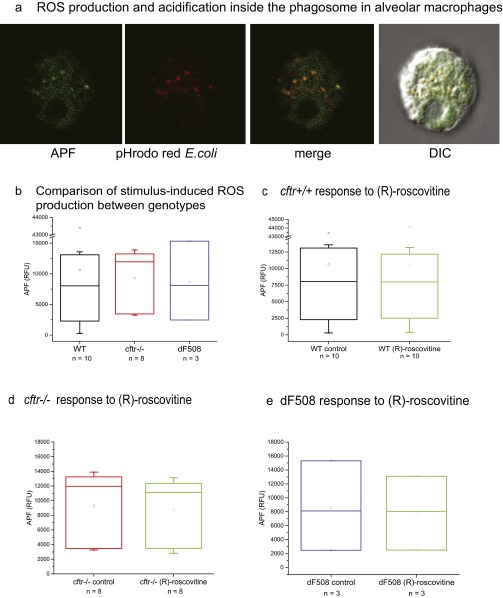
Resolution of chronic pulmonary infection in CF, as well as COPD, asthma, and tuberculosis, without the use of antimicrobials is a necessity in a clinical environment faced with increasing bacterial antibiotic resistance. Our data demonstrate that (R)-roscovitine and related metabolites and derivatives rescue phagocytic function in CF pulmonary macrophages, which is independent of kinase inhibition and of CFTR expression. Our data, which are modeled in Fig. S8, are consistent with a mechanism whereby (R)-roscovitine binds to an as yet unidentified GPCR-activating downstream signaling molecules, including phospholipase C, generating DAG and IP3, giving rise to Ca2+ mobilization from external as well as internal sites. Sequelae include incorporation into and activation of Ca2+-permeable TRPC6 channels in the plasma, as well as phagosomal membrane and mobilization and fusion of endolysosomal vesicles to the maturing phagosome contributing V-ATPase (Fig. S9), all events leading to luminal phagosomal charge neutralization and enhanced acidification, the prelude to enhanced bacterial killing. Inhibition of (R)-roscovitine action by PTX strongly suggests that it is acting through a GPCR-mediated pathway. Ligation of selected subsets of GPCRs is linked to the assembly and activation of NADPH oxidase and the release of free radicals associated with bacterial killing in the phagosomes of blood neutrophils (41), and to a much lesser extent in tissue macrophages (42). Stimulus-induced production of oxidants in tissue macrophages has been shown to be ∼110-fold less than that observed for blood phagosomes of blood neutrophils (43). In agreement with these findings, we were unable to observe an increase in oxidant (ROS) production in murine AMs challenged with bacteria following exposure to (R)-roscovitine (Fig. S10B), nor we were able to see a difference in stimulus-induced generation of ROS production between the murine AM genotypes, cftr+/+ and cftr−/−, either in the presence or absence of (R)-roscovitine (Fig. S10). We have previously shown that murine cftr−/− AMs are not defective in ROS production but are defective in microbicidal function (3), strongly suggesting that other microbicidal enzymatic effectors contributed by lysosomal fusion and activated in the acidic environment of the phagosome play a significant role in bacterial killing. Although both human and murine CF lung macrophages seem to be intrinsically defective in bacterial killing, there is disagreement in the literature as to whether CFTR dysfunction impairs the contribution of ROS production to P. aeruginosa killing (44, 45) and may well be a function of species and tissue source.
Fig. S8.
Schema of TRPC6 restoration of microbicidal activity in CFTR deficient AMs through GPCR activation by (R)-roscovitine and analogs. Proton and Cl− fluxes across AM phagosomal membranes promote intraluminal acidification and the development of a microbicidal environment. GPCR stimulation by (R)-roscovitine triggers a signaling cascade that leads to Ca2+-dependent and vesicle-mediated TRPC6 translocation and insertion into the plasma membrane. Subsequent TRPC6 uptake into phagosomes facilitates the production of an intraluminal microbicidal environment. Cftr+/+ cells: phagosomal acidification begins with the flow of protons into the phagosomal lumen driven by the V-ATPase proton pump. As protons accumulate, an imbalance of positive charge builds in the phagosomal lumen and is compensated for by Cl− influx via CFTR, thereby lowering phagosomal membrane potential and sustaining luminal acidity. Normally, phagosomal lumen pH is ∼5. The acidic luminal environment supports the proteolytic activity of the lysosomal enzymes leading to bacterial killing. Phagosomal NADPH oxidase generates superoxide radicals (O2−) that combines with luminal protons to form hydrogen peroxide (H2O2). Luminal myeloperoxidase sourced from fused lysosomes then combines H2O2 and Cl− to form the very toxic hypochlorous acid (HOCl), an oxidant which participates in bactericidal activity. cftr-/−: absence of Cl− influx raises luminal pH to near neutrality and substantially elevates phagosomal membrane potential. This elevated phagosomal membrane potential reduces proton influx and inhibits proteolytic activity of the lysosomal enzymes creating an environment favoring bacterial growth. Reduced luminal Cl− also prevents the production of HOCl as the endpoint of the oxidative pathway. cftr−/− + (R)-roscovitine: recruitment of the cation channel TRPC6 to the plasma membrane and subsequently to the phagosomal membrane upon particle engulfment, provides an alternative charge-shunt pathway in the absence of CFTR expression. The activation of TRPC6 in the phagosomal membrane by (R)-roscovitine-generated DAG opens a cation efflux pathway from the phagosomal lumen, thereby providing an alternate charge shunt that restores pH regulation and acidification. The phagosomal pH remains ∼5, the membrane potential is kept low, and luminal microbicidal activity is sustained.
Fig. S9.
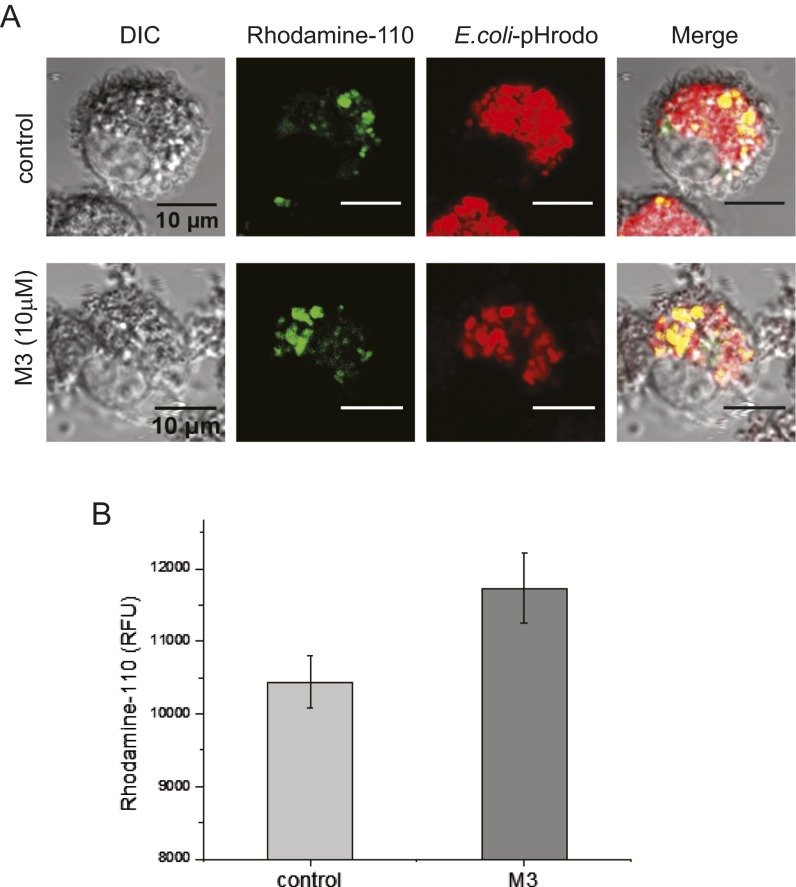
The (R)-roscovitine metabolite M3 enhanced lysosomal fusion with phagosomes in murine alveolar macrophages. Rhodamine-110, bis-(CBZ-l-phenylalanyl-l-arginine amide), is a nonfluorescent substrate that is converted to fluorescent monoamide upon the cleavage of the covalently linked peptide/amino acid by cathepsin. We added Rhodamine-110 to AMs before incubation with pHrodo red-conjugated E. coli particles, providing simultaneous uptake of both probes into phagosomes. Lysosomal fusion with nascent phagosomes introduces proteases, including cathepsin, into the phagosome and triggers rhodamine conversion to a fluorescent state, thereby confirming lysosomal transfer of luminal enzymes to phagosomes. (A) (R)-roscovitine metabolite M3 (10 µM) enhanced lysosomal fusion in mouse AMs over that observed in control cells following pHrodo red-E. coli uptake. Yellow signal in the merged image illustrates overlap between rhodamine and pHrodo red-labeled particles. (B) Summary of the increase in Rhodamine-110 increase in fluorescence corresponding to lysosomal fusion and phagosomal acquisition of cathepsin in the presence of M3 over that observed in control cells. Experiments were carried out in plate-reader format in triplicate for three animals. Cells from individual animals were not pooled but examined separately. Imaging study: Isolated mouse alveolar macrophages were cultured on the poly-l-lysine–coated glass-bottom dishes for 24–48 h. Cells were then treated with 10 µM Rhodamine-110 for 20 min at room temperature in the dark followed by incubation with 0.1 mg/mL pHrodo red-conjugated E. coli particles for 1 h at 37 °C. Cells were washed twice with PBS and fixed with 4% PFA in PBS. Images were acquired immediately after fixation on a Leica TCS SP5 2-photon laser confocal microscope with a 63× (NA1.4) oil objective. Quantification of lysosomal fusion: Isolated murine AMs were plated on a 96-well plate at a density of 3,000–6,000 cells (20–60 µM diameter) per well, incubated in complete DMEM (10% FBS, 1% P/S) at 37 °C under 5% CO2 pressure for 24–48 h. The cells were loaded with 5 µM Rhodamine-110 for 20 min at RT in the dark, then fed with E.coli particles for 1 h at 37 °C. Rhodamine-110 signal was read by a Synergy MX, Biotek plate reader with excitation λ = 498 nm and emission λ = 521-nm wavelengths.
Fig. S10.
ROS production by murine alveolar macrophages activated with opsonized E. coli in response to (R)-roscovitine. Aminophenyl fluorescein (APF) is nonfluorescent until it reacts with the hydroxyl radical, peroxynitrite anion, and hypochlorite anion, two ROS derived from superoxide anions generated by activated NADPH oxidase in phagosomes. (A) Detection of E. coli-induced ROS production by cftr+/+ alveolar macrophages. pHrodo red-conjugated E. coli particles fluoresce red upon acidification inside the phagosome; ROS production was detected from green fluorescing fluorescein (∼490/515 nm) signal. (B) There was no statistically significant difference in E. coli-induced ROS production in wild-type murine AMs and AMs from cftr−/− or ΔF508 mice. (C) AMs were pretreated with 20 µM (R)-roscovitine for 15 min at 37 °C and then pulsed with opsonized E. coli particles. (R)-Roscovitine did not alter E.coli-induced ROS production in AMs from WT mice as well as in CFTR-deficient mice (D and E) compared with nontreated cells. Experiments were carried out in plate-reader format in triplicate; the number of animals examined is given under each box plot. Cells from individual animals were not pooled but examined separately. Murine AMs were plated at a density of at least 3,000 cells per well in 100-µL total well volume. Opsonized pHrodo red-conjugated E. coli particles were mixed with APF (hydroxyl radical, hypochlorite, or peroxynitrite sensor; #A36003; Life Technologies) at a concentration of 2 mg/mL of E. coli and 100 µM APF in HBSS medium, pH 7.3. Ten microliters of the mixture was added per well, the plate was briefly centrifuged and analyzed on a SynergyMX BioTek spectrophotometer (excitation/ emission maxima ∼490/515 nm). Cells were incubated with particles at 37 °C for 3 h after which time endpoint data were obtained. No significant differences in ROS production among groups were observed. Data are summarized in box plots with the number of mice indicated below each bar.
Although we were unable to demonstrate that (R)-roscovitine acted as a corrector for the trafficking defect in the mutant protein, as has been previously reported (46), our electrophysiological experiments on isolated cells did demonstrate that (R)-roscovitine activated a TRPC6 conductance, a response which was absent in trpc6−/− cells. TRPC6 channels are translocated to the plasma membrane upon (R)-roscovitine stimulation and appear to remain in the membrane so long as the stimulus is present. The concept of TRPC6 mobilization to the plasma membrane as a function of G-protein receptor activation has been documented for the muscarinic receptor in heterologous expression systems (47, 48), as well as for lysophosphatidylcholine’s inhibition of mouse aortic endothelial cell migration (49), and serves as a template for expression regulation in the AM. When incorporated into the phagosomal membrane, TRPC6 would serve as charge-shunt pathway, leading to the loss of luminal cations and supporting enhanced V-ATPase proton translocation in the development of the antimicrobial environment of the phagosomal compartment. Our data demonstrate that (R)-roscovitine generated DAG could activate plasma membrane resident TRPC6 channels, providing for a local Ca2+ influx creating a (R)-roscovitine–driven positive feedback loop, supporting enhanced translocation of endosomal Ca2+ permeable TRPC6 channels to the plasma membrane or alternatively to the phagosomal membrane directly, as well as possibly driving lysosomal fusion to phagosomes. Increasing expression of TRPC6 at the plasma membrane would contribute to a microdomain of increased Ca2+ around the phagocytic cup and lead to enhanced incorporation of the Ca2+ conductance into the maturing phagosome. Plasmalemmal TRPC6 incorporated into the phagosomal membrane during particle uptake is then well positioned to act as a charge-shunt pathway, supporting cation movement out of the phagosome, amplifying V-ATPase–driven acidification during the maturation process. In an unanticipated finding, we have shown that TRPC6 appears to participate in phagosomal acidification in the nondrug-treated AM, as well as rescue AM phagosomal function in drug-treated cells defective in CFTR function.
TRPC6 channels are present at low density in the plasma membrane of wild-type and CFTR-deficient cells, as seen in Fig. 10 and Fig. S7A. Their activation contributes to a significant fraction of phagosomal acidification in wild-type cells (Fig. 11B), which may be because of a regulatory interaction between CFTR and TRPC6, as seen the in the studies of Tabeling et al. (32) for pulmonary artery smooth-muscle cells. TRPC6 requires GPCR activation to generate not only DAG as an agonist for the channel, but also Ca2+ to induce channel translocation and insertion. If there is a protein–protein interaction between TRPC6 and CFTR, as in the Tabeling et al. studies, which enhances TRPC6 opening in the wild-type cells, GPCR activation may be essential for channel opening in the CFTR-deficient cells.
Our data examining the optimization of phagosomal function by (R)-roscovitine takes advantage of animal models available for the study of pulmonary inflammation in CF. It serves, however, in a broader sense as a template for the exploration of novel mechanisms, which might resolve inflammation in a host-directed manner in a diversity of pulmonary diseases, including tuberculosis, COPD, and asthma. Knowledge of the signaling and fusion events potentially available to reprogram the phagosome for enhanced microbicidal function is critical for the success of this strategy. The plethora of GPCRs in resident pulmonary macrophages (36) that may be linked to ion channel function provides a rich source for potential therapeutic approaches to macrophage-mediated disease. This theory is further supported by recent report that TRPML1 channels are similarly involved in charge shunting for large phagosomes in bone marrow macrophages (5), and suggests multiple alternatives to CFTR may exist for mitigating bactericidal defects in CF, as well as multiple acidification mechanisms in diverse macrophage lineages.
Materials and Methods
See SI Materials and Methods for details of experimental procedures and summarized data on sample size (number of particles per cells) and number of experiments (human or mice) in Table S4.
Animals.
All studies detailed herein conform entirely to the principles and regulations set forth by the Animal Welfare Act, the National Institutes of Health Guide for the Care and Use of Laboratory Animals (50), and were approved by the University of Chicago Institutional Animal Care and Use Committee.
BAL from Humans.
All procedures were performed on consenting adults following a protocol approved by The University of Chicago Institutional Review Board.
SI Materials and Methods
Reagents.
(R)-roscovitine, (S)-roscovitine, M3 metabolite of (R)-roscovitine, N6-methyl-roscovitine, ′O6-benzyl-roscovitine, olomoucine, (S)-CR8, and purvalanol A were synthesized. Bumetanide, miglustat, bafilomycin, edelfosine, and fMLF were obtained from Sigma-Aldrich. All compounds were prepared in 10-mM stocks in anhydrous DMSO and stored in single-use aliquots at −20 °C. Immediately before use, stock aliquots were sonicated 10–15 min to maintain solubilization of the hydrophobic text compounds.
Animals.
The studies detailed herein conform to the principles set forth by the Animal Welfare Act and the National Institutes of Health guidelines for the care and use of animals in biomedical research and were approved by The University of Chicago Institutional Animal Care and Use Committee. CFTR-null mice (STOCK Cftr < tm1Unc>/TgN(FABPCFTR)#Jaw/Cwr and ΔF508 mutant mice (C57BL/6 Cftr < tm1Kth>-TgN(FABPCFTR)#Jaw/Cwr homozygous for ΔF508 breeding pairs were purchased from The Jackson Laboratory. These mice express the hCFTR protein in the gut under the influence of the rat FABP promoter and are referred to as “gut corrected.” CFTR-null mice were bred according to the strategy used by The Jackson Laboratory from which they were purchased. Females that were heterozygous for the Cftrtm1Unc targeted mutation and homozygous for the FABP-hCFTR transgene were bred with males that were homozygous for both the Cftrtm1Unc-targeted mutation and the FABP-hCFTR transgene (i.e., HET HOM females × HOM HOM males). The ΔF508 mutant mice were purchased from Case Western Reserve University’s Cystic Fibrosis Animal Core and were bred as heterozygotes. The trpc6−/− mice (B6; 129SvEvTrpc6 < Tm1Lbi>) were obtained from the National Institute of Environmental Health Sciences and bred as homozygotes at The University of Chicago. All animals were housed in a specific pathogen-free biohazard level 2 facility maintained by The University of Chicago Animal Resources Center (Chicago). Animal genotyping was performed by Transnetyx.
BAL from Humans.
All procedures were performed on consenting adults following a protocol approved by The University of Chicago Institutional Review Board. The patients included men and women, smokers and nonsmokers, undergoing bronchoscopy for cancer biopsies before clinical treatment. BAL fluid was strained through a 70-μm sterile cell strainer into a 50-mL conical tube centrifuge tube with a maximum BAL volume of 40 mL and a minimum volume of 10 mL, followed by centrifugation at 1,000 × g for 5 min at 4 °C. The BAL supernatant was then discarded and the cell pellet resuspended in 0.1–0.3 mL of cold complete media: DMEM, 10% FBS, 1% (vol/vol) penicillin-streptomycin. Cells were counted on Countess (Invitrogen) with a distribution cut-off of 20–60 µm and cell viability determined by Trypan blue exclusion. In general, the total number of macrophages per BAL was between 104 and 2 × 10⁵. Cells were either plated on MatTek glass-bottom dishes for live-cell video microscopy or in 96- or 384-multiwell plates, depending upon yield and experimental need. Multiwell plates were seeded at a density of 5–10 × 103 cells per well, depending upon yield. Patient cells were not pooled and were maintained in individual cultures. Cells were incubated for at least 3 h to allow macrophage attachment. After 3 h, medium was aspirated from each well or dish and cells were washed gently twice with fresh, warmed complete medium to remove all nonadherent cells. Adherent cells were ∼98% viable and CD68+.
BAL from Mice.
BAL fluids were collected from mice using standard methods. The total number of AMs (20–60 μm in diameter) recovered from BAL depended on the genotype and ranged from ∼0.4–1.2 × 10⁴ per mouse in wild-type mice and 1.1–7.6 × 10⁴ per mouse in ΔF508 mutant mice. Cells were cultured on poly-d-lysine–coated coverslip glass-bottom culture dishes (MatTek) for periods of up to 1 wk and placed in Hepes-buffered Hank’s balanced solution, pH 7.4, before microscopy.
Construction of Pseudomonas aeruginosa 27853 Expressing Red Fluorescence.
Pseudomonas aeruginosa strain 27853 was transformed with constructed plasmid pUCP24/RFP to create the red fluorescent strain. To construct the pUCP24/RFP plasmid, we amplified the gene encoding DsRed-Express2 protein from a plasmid pQE60NA-Express2 using primers Xba1-DsRed 5′GCT-CTA-GAG-ATG-GAT-AGC-ACT-GAG-AAC-3′ and DsRed-HindIII 5′CCC-AAG-CTT-GCT-ACT-GGA-ACA-GGT-GGT-GG-3′ and cloned it in Escherichia coli–P. aeruginosa shuttle vector pUCP24 via Xba1-HindIII cleavage sites to create the plasmid pUCP24/RFP. The plasmid was electroporated into competent cells of P. aeruginosa 27853 and plated on Pseudomonas isolation agar plates containing 100 µg/mL gentamicin. The selected clones were verified for production of red fluorescence with confocal microscopy.
Determination of Bactericidal Activity of Alveolar Macrophages.
AMs from wild-type, cftr−/−, or ΔF508 mutant mice were incubated with DsRed P. aeruginosa (multiplicity of infection < 10) for 40 min at 37 °C with 5% CO2. Noningested bacteria were carefully washed away with culture medium lacking FBS. Cells were incubated with a ceftazidime/amikacin mixture at 1 mg/mL each for 10 min at room temperature to kill remaining external noningested bacteria adherent to the cells and plastic. In our pilot experiments, the kill rate was 95% for P. aeruginosa under these conditions. After two washings, complete DMEM buffered with 20 mM Hepes, pH 7.4, was added to the cells.
Phagocytosed bacteria were followed in live time-lapse series using an Olympus 3I MARIANAS Yokogawa-type confocal microscope with a 100× oil objective and with temperature, gas, and humidity control. The bright field and fluorescence (421-nm excitation and 561-nm emission) data were collected every 0.5 h for 5 h as z-stacks of planes across the cells in 1-μm increments. Special care was taken to preserve the cells from deleterious laser illumination; hence, data collection was performed at 10% laser power with 400-ms exposure time. A pilot study demonstrated that these image-acquisition settings resulted in no detectable photo bleaching. Images were processed using ImageJ and a custom-written macro (V.P.B.). Bacterial growth inside the cells was estimated as fluorescence intensity at 560 nm in the sum of z-planes in individual cells over time. Data are expressed as means ± SEM. Significance between groups was determined using the Student’s t test.
In Vivo pH Calibration of Rhodamine-Green/pHrodo-Labeled Zymosan Bioparticles.
AMs plated on MatTek dishes were pretreated with 0.1 µM bafilomycin for 30 min before addition of doubly conjugated zymosan. The dishes were incubated at 37 °C for 10–20 min until the AMs had sufficiently phagocytosed enough zymosan particles. Dishes were washed three times with calibration buffer before adding 1 mL of triple-component calibration buffer containing Hepes, CHES, citric acid, with 50 µL digitonin [∼0.006% (wt/vol)] added. The pH 4.5–7.5 calibration buffers were used, starting with the highest pH and ending with the lowest pH and washing twice between determinations. Cells were equilibrated for 5–10 min before images were taken with a Leica SP5-II Tandem scanner AOBS Spectral 2-Photon Confocal microscope, sequentially exciting with 488- and 560-nm laser.
Three-Dimensional Reconstruction of Intracellular Bacterial Growth.
A 3D comparison of intracellular bacterial growth in single murine AMs was performed using live-cell microscopy. Cells were pretreated with 20 µM (R)-roscovitine for 20 min, then infected with DsRed-expressing P. aeruginosa (multiplicity of infecgtion < 10) for 30 min at 37 °C. Cells exposed to (R)-roscovitine for 20 min before exposure to bacteria. Adherent and noningested bacteria were then removed by washing and incubation with gentamicin and live AMs were observed microscopically for ∼6 h. Intracellular localization of bacteria was confirmed by 3D reconstruction of confocal z-stacks of bacterial fluorescence and cellular reflection/backscatter.
Phagosomal Acidification Assay: Plate Reader and Single Cell.
Isolated human or mouse AMs were plated on 96-well plates with average density of 2–5 × 10³ cells per well and incubated in complete medium for 24–48 h at 37 °C in a 5% CO2 incubator. In each experiment, sample wells were treated with a panel of compounds in triplicate where possible before exposure to pHrodo red-labeled E. coli particles (Life Technologies). Particle uptake was synchronized by centrifuging plates at 300 × g for 5 min. Acidification and particle uptake were tracked at 37 °C every 5 min with excitation/emission wavelengths of 560/590 nm on a SynergyMX fluorescent spectrophotometer (BioTek). Determination of the kinetics of acidification of single phagosomes containing rhodamine green/pHrodo red-labeled zymosan particles was done according to previously published methods (4). Data were normalized to fluorescence changes observed in untreated control cells for each patient or mouse before averaging. Data were obtained in triplicate for each patient and averaged for all patients with error bars indicating SEM.
Immunocytochemistry.
Cultured human and murine AMs were fixed in ice-cold acetone for 10 min at −20 °C, washed three times with PBS, and blocked in blocking buffer [PBS containing normal goat serum (10%), BSA (0.5%), and Triton X-100 (0.1%)] overnight at 4 °C or 1 h at room temperature. Cells were then incubated for 1 h at room temperature with affinity-purified rabbit polyclonal antibody raised against the C-terminal amino acids 796–809 (QEDAEMNKINEEKK) of human TRPC6 (Proteintech Group). The murine amino acid primary sequence differs from the human sequence with an arginine substitution for isoleucine at residue 804. In our hands, the antibody recognized the TRPC6 epitope both in human and murine cells. We refer to this antibody as α-hTRPC6796–809 in the text. From a stock protein concentration of 0.27 mg/mL, TRPC6 antibody was diluted 1:250 in blocking buffer unless otherwise specified. Primary antibody specificity was determined on murine trpc6−/− AMs (Fig. S3A).
To detect surface expression of TRPC6, we used a rabbit polyclonal affinity-purified antipeptide antibody raised against the peptide (C)DNVKYYNLARIKWD, corresponding to amino acid residues 573–586 of the rat TRPC6 second extracellular loop (Alomone). This antibody is referred to as α-rTRPC6573–586 in the text. Antibody specificity was determined using the antigenic peptide. Validation could not be determined in the trpc6−/− mouse because the truncated nonfunctional protein, which was translated in the mouse, contained the region/peptide to which the antibody was directed. Again, we used a 1:250 antibody dilution in this assay. To preserve membrane structure for TRPC6 surface detection, AMs were fixed in 2% PFA, rinsed, blocked, and stained as described above but without Triton X-100. In both staining protocols, we used goat anti-rabbit IgG-Alexa-fluor 488-conjugated secondary antibody diluted 1:1,000 in blocking buffer and incubated 1 h at room temperature. Cellular nuclei were stained with NucBlue Live Cell Stain for 20 min, washed with PBS, and finally mounted with SlowFade reagent (both reagents from Molecular Probes/Life Technologies). Confocal Images were acquired on Leica TCS AOBS SP5 laser microscope with 63× magnification oil objective (NA 1.4). All images were captured in a 12-bit range of 0–4,095 fluorescence intensities. A color gradient scheme (Rainbow) was used to highlight increased density of TRPC6 surface labeling following (R)-roscovitine or OAG treatment. Blue color indicates low but detectable surface staining of TRPC6, green indicates moderate fluorescence intensity, and red signifies high fluorescence signal. (R)-Roscovitine does induce TRPC6 translocation to the plasma membrane and results in a more even distribution in contrast with the punctate, uneven TRPC6 distribution observed in control cells. OAG induces TRPC6 surface translocation to an even greater extent as indicated by high fluorescence signal in red. Comparative summary of surface TRPC6 expression quantified as mean fluorescence integrated density (area × mean value of fluorescence intensity) ± SEM.
Phagosomal Membrane Preparation for Electron Microscopy.
J774 cells at 90% confluence in complete medium were pretreated with 50 µM (R)-roscovitine or vehicle for 15 min at 37 °C, exposed to magnetic Dynabeads M-270 2.5-µm beads (Life Technologies) for 15 min at 37 °C, washed twice, and allowed to internalize beads for 1 h at 37 °C. All subsequent procedures were performed on ice: cells were scraped in ice-cold PBS, centrifuged, and resuspended in the homogenizing buffer (0.25 M sucrose, 10 mM Hepes, 3 mM MgCl2, 5 mM EDTA, protease inhibitor mixture, 10 mg/mL DNase I) and homogenized by nitrogen cavitation. Tubes were then placed in a magnetic column for 5 min to allow bead attraction by the magnet. Recovered beads were washed three times and frozen at −20 °C. Beads underwent one freeze-thaw cycle to release phagosomal membranes and the resultant membrane-bead mixture was loaded onto nickel grids for immuno-electron microscopy. Beads were washed from the grid leaving purified phagosomal membranes adhered to the grids.
Immunogold Labeling of Purified Phagosomal Membrane for Electron Microscopy.
Isolated phagosomal membrane samples were dropped on glow-discharged 400-mesh nickel grids for 2 min, washed with PBS for 20 min, and blocked in 1% BSA/PBS (blocking buffer) for 20 min. TRPC6 labeled with the anti-hTRPC6796–809 diluted 1:100 in blocking buffer and 15-nm gold-labeled secondary antibody diluted 1:10 in blocking buffer. Samples were postfixed with 1% glutaraldehyde, contrasted with 1% uranyl acetate, and air-dried. The preparations were examined under 300 KV at FEI Tecnai F30.
Electrophysiology.
Whole-cell recordings.
Whole-cell recordings were performed with an Axopatch 200B patch-clamp amplifier (Molecular Devices) and uncoated borosilicate glass pipettes. Patch pipettes were made on either a Narishige PC-10 or Sutter Model P-97 glass capillary pipette puller with resistances of 6–8 MOhm. Currents were low-pass–filtered at 2.8 kHz with an eight-pole Bessel filter and digitized at 10 kHz. Recordings were made from visually identified macrophages at room temperature (26 °C) at Vh = −40 mV or Vh= −70 mV. In the (R)-roscovitine and M3 experiments, (Figs. 4 A–D and 5 A and B), the extracellular NMDG-based bath solution contained: 140 mM NMDG, 140 mM HCl, 2 mM CaCl2, 1 mM MgCl2, 10 mM Hepes, pH 7.3 (310 mOsm, adjusted with sucrose). The patch pipette solution contained: 95 mM KCH3SO3, 30 mM KCl, 8 mM NaCl, 1 mM MgCl2, 10 mM Hepes, 5 mM Na2-ATP, 0.05 mM EGTA, pH 7.1. In experiments with OAG as a stimulus (Fig. 4E) and with trpc6−/− AMs (Figs. 4G and 5 A and B), the extracellular bath solution contained: 125 mM NaCl, 2.5 mM KCl, 10 mM Hepes, 1.5 mM MgCl2, 2.5 mM CaCl2, 6 mM d-glucose, 28 mM sucrose, pH 7.3 (310 mOsm). The patch pipettes contained: 130 mM CsCl, 10 mM Hepes, 0.05 mM EGTA, 1 mM MgCl2, 5 mM MgATP, pH 7.3 titrated with CsOH (290 mOsm, adjusted with sucrose). For CFTR Cl− current (ICFTR) recordings (Fig. S7), the patch pipette solution contained: 100 mM NMDG-glutamate, 40 mM NMDG-Cl, 2 mM MgCl2, 0.2 mM CaCl2, 1 mM EGTA, 10 mM Hepes, 5 mM Mg-ATP, pH 7.2. The bath solution consisted of: 140 mM NMDG-Cl, 2 mM CaCl2, 2 mM MgCl2, 10 mM Hepes, pH 7.4.
Because there was significant attenuation of (R)-roscovitine as well as M3-induced effects during prolonged whole-cell recordings, cells were preincubated in media containing (R)-roscovitine or M3 for the determination of I-V relationships in the presence and absence of drug. In recordings characterizing OAG-activated currents, 100 µM OAG was perfused through the recording chamber during prolonged whole-cell voltage-clamp recording. Current traces were analyzed with Clampfit 10.2 software (Molecular Devices).
Single-channel recordings.
Single-channel recordings (Fig. 5 C–E) were obtained with an EPC9 patch-clamp amplifier (HEKA Instruments) and recorded using Patchmaster v2X73 software (HEKA Instruments). All single-channel recordings were obtained from cell-attached patches. Currents were digitized at 2 kHz and low-pass–filtered at 1 kHz with a four-pole Bessel filter. Pipettes were pulled from thick-walled Quartz glass capillaries (Sutter Instrument Co.) on a P-2000 Micropipette Puller (Sutter Instrument Co.). Pipette resistances were measured at 7–9 MOhms in bath solution. Both the bath and pipette solutions contained: 140 mM NaCl, 5.4 mM KCl, 10 mM Hepes, 2 mM CaCl2, 1 mM MgCl2, pH 7.2. Apamin (250 nM), TRPC3 channel blocker Pyr10 (10 µM), CFTR channel blocker GlyH (10 µM), and DIDS (200 µM) were added to the pipette solution to ensure isolation of TRPC6 currents. In the representative single-channel recordings shown in Fig. 5C, the relevant agonists [OAG, 50 µM and the (R)-roscovitine derivative M3, 10 µM] were perfused through the recording chamber while maintaining the cell-attached patch configuration, during which the pipette potential was held at +80 mV relative to the cell-membrane potential. Single-channel current amplitudes (Fig. 5D) were quantified from the peaks of all-point histograms determined using the Gaussian-fit function in TAC X4.1.5 (Bruxton); histograms were generated using the sweep histogram function, also in TAC. Single-channel conductance values were calculated from the slopes of least-squares linear regression lines fitted to current amplitude vs. voltage plots. Open-state probability was quantified from amplitude histograms as the area beneath a Gaussian curve in the open-state normalized to the sum of the area over all states using the weight function in TAC.
Supplementary Material
Acknowledgments
The authors thank Dr. Rong Ma (University of North Texas, Fort Worth), who generously offered the use of his laboratory and animals in the first experiments involving the trpc6−/− mice; Drs. Radmila Sarac, Theodore Karrison, and Olga Zaborina, for many helpful conversations over the course of the study; Dr. G. Thinakaran for the gift of the many vesicle-directed antibodies; Yimei Chen in the Electron Microcopy Core at the University of Chicago, for his expertise; Dr. Richard D. Ye (University of Illinois at Chicago) for his help in the initial experiments examining whether (R)-roscovitine acted through the formyl peptide receptors; and Dr. Partha Kasturi (University of Kansas) for providing the initial experiments and analysis examining whether (R)-roscovitine modulated V-ATPase activity. This work was supported by National Institutes of Health Grants R01 GM36823, R01 HL125076, and R01 DK080364 (to D.J.N.); Cystic Fibrosis Foundation 12 and 13PO (to D.J.N.); and by the “Intramural Research Program of the NIH”, Project Z01-ES-101684 (to L.B.).
Footnotes
Conflict of interest statement: L.M. is an employee and shareholder of ManRos Therapeutics. L.M. is a founder of ManRos Therapeutics and a member of its scientific advisory board. L.M. is a co-inventor on the roscovitine patent. H.G. is a consultant for and shareholder of ManRos Therapeutics. H.G. is a founder of ManRos Therapeutics and a member of its scientific advisory board. N.O. is an employee of ManRos Therapeutics. N.L. is an employee of the CNRS, funded on a grant from ManRos Therapeutics.
This article contains supporting information online at www.pnas.org/lookup/suppl/doi:10.1073/pnas.1518966112/-/DCSupplemental.
References
- 1.Lieberman TD, et al. Genetic variation of a bacterial pathogen within individuals with cystic fibrosis provides a record of selective pressures. Nat Genet. 2014;46(1):82–87. doi: 10.1038/ng.2848. [DOI] [PMC free article] [PubMed] [Google Scholar]
- 2.Dettman JR, Rodrigue N, Aaron SD, Kassen R. Evolutionary genomics of epidemic and nonepidemic strains of Pseudomonas aeruginosa. Proc Natl Acad Sci USA. 2013;110(52):21065–21070. doi: 10.1073/pnas.1307862110. [DOI] [PMC free article] [PubMed] [Google Scholar]
- 3.Di A, et al. CFTR regulates phagosome acidification in macrophages and alters bactericidal activity. Nat Cell Biol. 2006;8(9):933–944. doi: 10.1038/ncb1456. [DOI] [PubMed] [Google Scholar]
- 4.Deriy LV, et al. Disease-causing mutations in the cystic fibrosis transmembrane conductance regulator determine the functional responses of alveolar macrophages. J Biol Chem. 2009;284(51):35926–35938. doi: 10.1074/jbc.M109.057372. [DOI] [PMC free article] [PubMed] [Google Scholar]
- 5.Samie M, et al. A TRP channel in the lysosome regulates large particle phagocytosis via focal exocytosis. Dev Cell. 2013;26(5):511–524. doi: 10.1016/j.devcel.2013.08.003. [DOI] [PMC free article] [PubMed] [Google Scholar]
- 6.Goh GY, et al. Presynaptic regulation of quantal size: K+/H+ exchange stimulates vesicular glutamate transport. Nat Neurosci. 2011;14(10):1285–1292. doi: 10.1038/nn.2898. [DOI] [PMC free article] [PubMed] [Google Scholar]
- 7.Steinberg BE, et al. A cation counterflux supports lysosomal acidification. J Cell Biol. 2010;189(7):1171–1186. doi: 10.1083/jcb.200911083. [DOI] [PMC free article] [PubMed] [Google Scholar]
- 8.Damann N, Owsianik G, Li S, Poll C, Nilius B. The calcium-conducting ion channel transient receptor potential canonical 6 is involved in macrophage inflammatory protein-2-induced migration of mouse neutrophils. Acta Physiol (Oxf) 2009;195(1):3–11. doi: 10.1111/j.1748-1716.2008.01918.x. [DOI] [PubMed] [Google Scholar]
- 9.Nagasawa M, Nakagawa Y, Tanaka S, Kojima I. Chemotactic peptide fMetLeuPhe induces translocation of the TRPV2 channel in macrophages. J Cell Physiol. 2007;210(3):692–702. doi: 10.1002/jcp.20883. [DOI] [PubMed] [Google Scholar]
- 10.Link TM, et al. TRPV2 has a pivotal role in macrophage particle binding and phagocytosis. Nat Immunol. 2010;11(3):232–239. doi: 10.1038/ni.1842. [DOI] [PMC free article] [PubMed] [Google Scholar]
- 11.Di A, et al. The redox-sensitive cation channel TRPM2 modulates phagocyte ROS production and inflammation. Nat Immunol. 2012;13(1):29–34. doi: 10.1038/ni.2171. [DOI] [PMC free article] [PubMed] [Google Scholar]
- 12.Li S, Westwick J, Poll C. Transient receptor potential (TRP) channels as potential drug targets in respiratory disease. Cell Calcium. 2003;33(5-6):551–558. doi: 10.1016/s0143-4160(03)00060-5. [DOI] [PubMed] [Google Scholar]
- 13.Banner KH, Igney F, Poll C. TRP channels: Emerging targets for respiratory disease. Pharmacol Ther. 2011;130(3):371–384. doi: 10.1016/j.pharmthera.2011.03.005. [DOI] [PubMed] [Google Scholar]
- 14.Dietrich A, Gudermann T. TRPC6: Physiological function and pathophysiological relevance. Handbook Exp Pharmacol. 2014;222:157–188. doi: 10.1007/978-3-642-54215-2_7. [DOI] [PubMed] [Google Scholar]
- 15.Baker KE, et al. Novel drug targets for asthma and COPD: Lessons learned from in vitro and in vivo models. Pulm Pharmacol Ther. 2014;29(2):181–198. doi: 10.1016/j.pupt.2014.05.008. [DOI] [PubMed] [Google Scholar]
- 16.Finney-Hayward TK, et al. Expression of transient receptor potential C6 channels in human lung macrophages. Am J Respir Cell Mol Biol. 2010;43(3):296–304. doi: 10.1165/rcmb.2008-0373OC. [DOI] [PubMed] [Google Scholar]
- 17.Antigny F, et al. Transient receptor potential canonical channel 6 links Ca2+ mishandling to cystic fibrosis transmembrane conductance regulator channel dysfunction in cystic fibrosis. Am J Respir Cell Mol Biol. 2011;44(1):83–90. doi: 10.1165/rcmb.2009-0347OC. [DOI] [PubMed] [Google Scholar]
- 18.Hackam DJ, et al. Regulation of phagosomal acidification. Differential targeting of Na+/H+ exchangers, Na+/K+-ATPases, and vacuolar-type H+-atpases. J Biol Chem. 1997;272(47):29810–29820. doi: 10.1074/jbc.272.47.29810. [DOI] [PubMed] [Google Scholar]
- 19.Botelho RJ, et al. Localized biphasic changes in phosphatidylinositol-4,5-bisphosphate at sites of phagocytosis. J Cell Biol. 2000;151(7):1353–1368. doi: 10.1083/jcb.151.7.1353. [DOI] [PMC free article] [PubMed] [Google Scholar]
- 20.Schepetkin IA, et al. Identification of novel formyl peptide receptor-like 1 agonists that induce macrophage tumor necrosis factor alpha production. Mol Pharmacol. 2008;74(2):392–402. doi: 10.1124/mol.108.046946. [DOI] [PMC free article] [PubMed] [Google Scholar]
- 21.Meijer L, Raymond E. Roscovitine and other purines as kinase inhibitors. From starfish oocytes to clinical trials. Accounts Chem Res. 2003;36:417–425. doi: 10.1021/ar0201198. [DOI] [PubMed] [Google Scholar]
- 22.Ip WK, et al. Phagocytosis and phagosome acidification are required for pathogen processing and MyD88-dependent responses to Staphylococcus aureus. J Immunol. 2010;184(12):7071–7081. doi: 10.4049/jimmunol.1000110. [DOI] [PMC free article] [PubMed] [Google Scholar]
- 23.Sun-Wada GH, Tabata H, Kawamura N, Aoyama M, Wada Y. Direct recruitment of H+-ATPase from lysosomes for phagosomal acidification. J Cell Sci. 2009;122(Pt 14):2504–2513. doi: 10.1242/jcs.050443. [DOI] [PubMed] [Google Scholar]
- 24.Estacion M, Sinkins WG, Jones SW, Applegate MA, Schilling WP. Human TRPC6 expressed in HEK 293 cells forms non-selective cation channels with limited Ca2+ permeability. J Physiol. 2006;572(Pt 2):359–377. doi: 10.1113/jphysiol.2005.103143. [DOI] [PMC free article] [PubMed] [Google Scholar]
- 25.Inoue R, et al. The transient receptor potential protein homologue TRP6 is the essential component of vascular alpha(1)-adrenoceptor-activated Ca(2+)-permeable cation channel. Circ Res. 2001;88(3):325–332. doi: 10.1161/01.res.88.3.325. [DOI] [PubMed] [Google Scholar]
- 26.Li SW, Westwick J, Poll CT. Receptor-operated Ca2+ influx channels in leukocytes: A therapeutic target? Trends Pharmacol Sci. 2002;23(2):63–70. doi: 10.1016/s0165-6147(00)01897-6. [DOI] [PubMed] [Google Scholar]
- 27.Lockwich TP, et al. Assembly of Trp1 in a signaling complex associated with caveolin-scaffolding lipid raft domains. J Biol Chem. 2000;275(16):11934–11942. doi: 10.1074/jbc.275.16.11934. [DOI] [PubMed] [Google Scholar]
- 28.Treviño CL, Serrano CJ, Beltrán C, Felix R, Darszon A. Identification of mouse trp homologs and lipid rafts from spermatogenic cells and sperm. FEBS Lett. 2001;509(1):119–125. doi: 10.1016/s0014-5793(01)03134-9. [DOI] [PubMed] [Google Scholar]
- 29.Torihashi S, Fujimoto T, Trost C, Nakayama S. Calcium oscillation linked to pacemaking of interstitial cells of Cajal: Requirement of calcium influx and localization of TRP4 in caveolae. J Biol Chem. 2002;277(21):19191–19197. doi: 10.1074/jbc.M201728200. [DOI] [PubMed] [Google Scholar]
- 30.Sanxaridis PD, et al. Light-induced recruitment of INAD-signaling complexes to detergent-resistant lipid rafts in Drosophila photoreceptors. Mol Cell Neurosci. 2007;36(1):36–46. doi: 10.1016/j.mcn.2007.05.006. [DOI] [PMC free article] [PubMed] [Google Scholar]
- 31.Bardell TK, Barker EL. Activation of TRPC6 channels promotes endocannabinoid biosynthesis in neuronal CAD cells. Neurochem Int. 2010;57(1):76–83. doi: 10.1016/j.neuint.2010.05.002. [DOI] [PMC free article] [PubMed] [Google Scholar]
- 32.Tabeling C, et al. CFTR and sphingolipids mediate hypoxic pulmonary vasoconstriction. Proc Natl Acad Sci USA. 2015;112(13):E1614–E1623. doi: 10.1073/pnas.1421190112. [DOI] [PMC free article] [PubMed] [Google Scholar]
- 33.Lattin J, et al. G-protein-coupled receptor expression, function, and signaling in macrophages. J Leukoc Biol. 2007;82(1):16–32. doi: 10.1189/jlb.0107051. [DOI] [PubMed] [Google Scholar]
- 34.Lattin JE, et al. Expression analysis of G protein-coupled receptors in mouse macrophages. Immunome Res. 2008;4:5. doi: 10.1186/1745-7580-4-5. [DOI] [PMC free article] [PubMed] [Google Scholar]
- 35.Varani K, et al. Oxidative/nitrosative stress selectively altered A(2B) adenosine receptors in chronic obstructive pulmonary disease. FASEB J. 2010;24(4):1192–1204. doi: 10.1096/fj.09-139485. [DOI] [PubMed] [Google Scholar]
- 36.Groot-Kormelink PJ, Fawcett L, Wright PD, Gosling M, Kent TC. Quantitative GPCR and ion channel transcriptomics in primary alveolar macrophages and macrophage surrogates. BMC Immunol. 2012;13:57. doi: 10.1186/1471-2172-13-57. [DOI] [PMC free article] [PubMed] [Google Scholar]
- 37.Violin JD, Zhang J, Tsien RY, Newton AC. A genetically encoded fluorescent reporter reveals oscillatory phosphorylation by protein kinase C. J Cell Biol. 2003;161(5):899–909. doi: 10.1083/jcb.200302125. [DOI] [PMC free article] [PubMed] [Google Scholar]
- 38.Kruskal BA, Maxfield FR. Cytosolic free calcium increases before and oscillates during frustrated phagocytosis in macrophages. J Cell Biol. 1987;105(6 Pt 1):2685–2693. doi: 10.1083/jcb.105.6.2685. [DOI] [PMC free article] [PubMed] [Google Scholar]
- 39.Myers JT, Swanson JA. Calcium spikes in activated macrophages during Fcgamma receptor-mediated phagocytosis. J Leukoc Biol. 2002;72(4):677–684. [PubMed] [Google Scholar]
- 40.Brumback AC, Lieber JL, Angleson JK, Betz WJ. Using FM1-43 to study neuropeptide granule dynamics and exocytosis. Methods. 2004;33(4):287–294. doi: 10.1016/j.ymeth.2004.01.002. [DOI] [PubMed] [Google Scholar]
- 41.Sun L, Ye RD. Role of G protein-coupled receptors in inflammation. Acta Pharmacol Sin. 2012;33(3):342–350. doi: 10.1038/aps.2011.200. [DOI] [PMC free article] [PubMed] [Google Scholar]
- 42.Nunes P, Demaurex N, Dinauer MC. Regulation of the NADPH oxidase and associated ion fluxes during phagocytosis. Traffic. 2013;14(11):1118–1131. doi: 10.1111/tra.12115. [DOI] [PubMed] [Google Scholar]
- 43.Haugen TS, Skjønsberg OH, Kähler H, Lyberg T. Production of oxidants in alveolar macrophages and blood leukocytes. Eur Respir J. 1999;14(5):1100–1105. doi: 10.1183/09031936.99.14511009. [DOI] [PubMed] [Google Scholar]
- 44.Cifani N, et al. Reactive-oxygen-species-mediated P. aeruginosa killing is functional in human cystic fibrosis macrophages. PLoS One. 2013;8(8):e71717. doi: 10.1371/journal.pone.0071717. [DOI] [PMC free article] [PubMed] [Google Scholar]
- 45.Zhang Y, Li X, Grassmé H, Döring G, Gulbins E. Alterations in ceramide concentration and pH determine the release of reactive oxygen species by Cftr-deficient macrophages on infection. J Immunol. 2010;184(9):5104–5111. doi: 10.4049/jimmunol.0902851. [DOI] [PubMed] [Google Scholar]
- 46.Norez C, et al. Rescue of functional delF508-CFTR channels in cystic fibrosis epithelial cells by the alpha-glucosidase inhibitor miglustat. FEBS Lett. 2006;580(8):2081–2086. doi: 10.1016/j.febslet.2006.03.010. [DOI] [PubMed] [Google Scholar]
- 47.Cayouette S, Lussier MP, Mathieu EL, Bousquet SM, Boulay G. Exocytotic insertion of TRPC6 channel into the plasma membrane upon Gq protein-coupled receptor activation. J Biol Chem. 2004;279(8):7241–7246. doi: 10.1074/jbc.M312042200. [DOI] [PubMed] [Google Scholar]
- 48.Cayouette S, et al. Involvement of Rab9 and Rab11 in the intracellular trafficking of TRPC6. Biochim Biophys Acta. 2010;1803(7):805–812. doi: 10.1016/j.bbamcr.2010.03.010. [DOI] [PubMed] [Google Scholar]
- 49.Chaudhuri P, et al. Elucidation of a TRPC6-TRPC5 channel cascade that restricts endothelial cell movement. Mol Biol Cell. 2008;19(8):3203–3211. doi: 10.1091/mbc.E07-08-0765. [DOI] [PMC free article] [PubMed] [Google Scholar]
- 50. Committee on Care and Use of Laboratory Animals (1996) Guide for the Care and Use of Laboratory Animals (Natl Inst Health, Bethesda), DHHS Publ No (NIH) 85–23.
Associated Data
This section collects any data citations, data availability statements, or supplementary materials included in this article.


