Significance
Phytoplankton transforms large amounts of inorganic to organic carbon, a critical step in the uptake of atmospheric CO2 in the ocean. Although iron is essential for this process, its bioavailability is often low. Phytoplankton has evolved strategies to cope with low environmental iron concentrations. We discovered that the iron storage protein ferritin is strongly regulated by the day/night cycle in the coastal California upwelling region dominated by the picophytoplanktonic genus Ostreococcus. Using genetic approaches, we showed that ferritin is used for short-term recycling of iron over diurnal cycles rather than for long-term iron storage. This work revealing the importance of ferritin in diurnal and circadian regulations of iron homeostasis should have implications for understanding carbon uptake by the ocean.
Keywords: ferritin, phytoplankton, Ostreococcus, circadian, iron
Abstract
In large regions of the open ocean, iron is a limiting resource for phytoplankton. The reduction of iron quota and the recycling of internal iron pools are among the diverse strategies that phytoplankton have evolved to allow them to grow under chronically low ambient iron levels. Phytoplankton species also have evolved strategies to cope with sporadic iron supply such as long-term storage of iron in ferritin. In the picophytoplanktonic species Ostreococcus we report evidence from observations both in the field and in laboratory cultures that ferritin and the main iron-binding proteins involved in photosynthesis and nitrate assimilation pathways show opposite diurnal expression patterns, with ferritin being maximally expressed during the night. Biochemical and physiological experiments using a ferritin knock-out line subsequently revealed that this protein plays a central role in the diel regulation of iron uptake and recycling and that this regulation of iron homeostasis is essential for cell survival under iron limitation.
Iron is a cofactor involved in numerous redox-based biological processes such as DNA synthesis, photosynthesis, nitrogen fixation, mitochondrial respiration, and the detoxification of reactive oxygen species (1–6). Although iron is essential for living organisms, it also is highly reactive and toxic via the Fenton reaction (7). Therefore the homeostasis of iron must be tightly regulated in the cell.
In one-third of the open ocean, iron bioavailability limits phytoplankton growth, as is well illustrated in high-nutrient/low-chlorophyll regions such as the Southern Ocean where a natural continuous iron supply or artificial iron fertilization induces massive phytoplankton blooms (8, 9). Phytoplanktonic species have evolved several strategies to cope with iron-limited conditions and sporadic iron supply to ensure that iron cellular quotas are optimized. Earlier studies have shown that the uptake rates per unit of cell surface are similar among species with different iron requirements and as a consequence smaller cells with higher surface-to-volume ratios are favored under iron limitation (10, 11). Acclimation to low iron induces rapid changes in the Photosystem (PS) II-to-PSI ratio and a global remodeling of the photosynthetic machinery (12), the down-regulation of nitrogen-reducing enzymes such as Fe-dependent nitrate and nitrite reductases, and the up-regulation of enzymes involved in nitrogen recycling (13). In oceanic diatoms, metabolic adaptation to iron limitation involves a decrease of PSI and cytochrome b6/f requirements (14) and the utilization of copper-dependent plastocyanin instead of cytochrome c6 (15, 16).
The ability to take up and store iron under high-iron conditions for subsequent use under low-iron conditions represents another strategy that is likely to be successful when iron supply is sporadic. Ferritin, the main iron-storage protein in eukaryotes, has been found in a number of microalgae, including several diatoms and picoeukaryotes (17). In particular, the ferritin-containing diatom Pseudonitzschia survives iron limitation better than diatoms lacking ferritin (17). Therefore it was proposed that long-term storage of iron in ferritin is a strategy to cope with variable supplies of bioavailable iron. In the land plant Arabidopsis, however, ferritin is regulated by the circadian clock component time for coffee (TIC), suggesting that its function may be to regulate iron homeostasis during the day/night cycle (18).
Day/night recycling of iron was evidenced by a proteomic study in the diazotrophic cyanobacterium Crocosphaera watsonii (19). Although the main iron-binding proteins of PSI and cytochrome b6/f involved in photosynthesis are expressed during the day, the metalloproteins involved in nitrogen fixation are expressed at night, as is consistent with an internal recycling of iron between metalloproteins over the day/night cycle. The occurrence of such diel recycling of iron-binding proteins remains to be determined in nondiazotrophic phytoplanktonic species.
The green alga Ostreococcus (Prasinophyceae, Mamiellales) has a worldwide geographic distribution, with major blooms reported in many locations including the Thau lagoon (20, 21), the West Neck bay (22), and the Chilean Upwelling ecosystem (23). Interestingly, in situ studies have revealed that the two main Ostreococcus clade partitions occur between nutrient-rich coastal waters versus more oligotrophic, open ocean waters (24). Recently an automated Lagrangian sampling of marine microbial communities revealed strong diel rhythms of gene transcripts in picoplankton dominated by the genus Ostreococcus (25). These results, in agreement with those conducted on Ostreococcus tauri cultures, identified clusters of genes associated with specific biological processes such as cell division which are expressed at specific times of the day (26, 27).
In this study, we used O. tauri, a species which has emerged as a model organism thanks to the ease of culture and techniques for functional analyses such as genetic transformation and gene targeting by homologous recombination (28–30). We investigated the diel regulation of ferritin and iron-binding proteins in the field and under laboratory conditions. Functional approaches highlighted the importance of ferritin in the regulation of iron homeostasis and for cell survival under iron limitation.
Results
Day/Night and Circadian Regulation of Genes Encoding Iron-Containing Proteins.
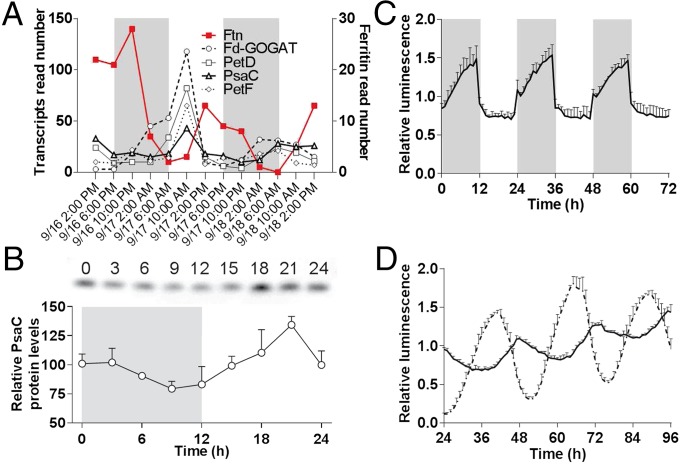
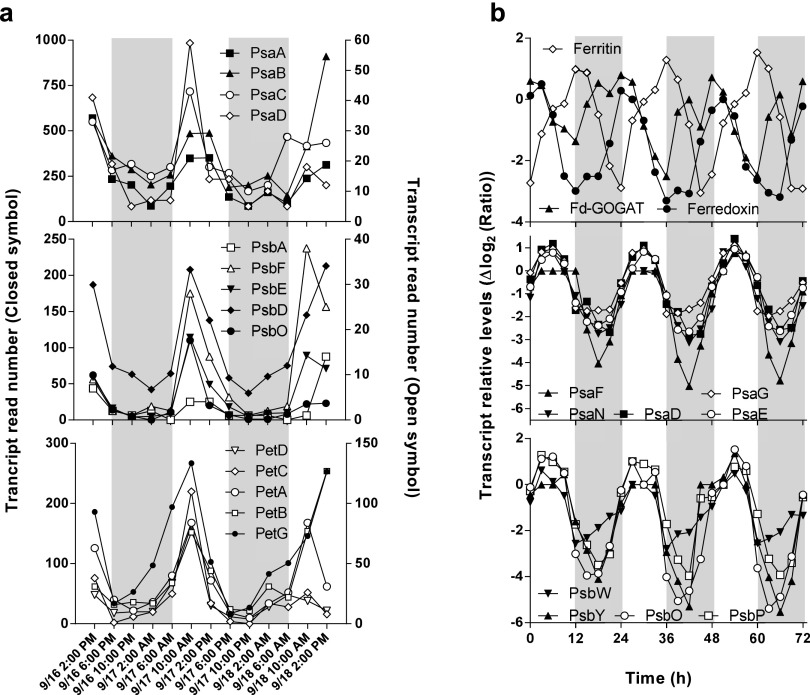
In an earlier paper (25), we analyzed the expression patterns of genes encoding iron-containing proteins in an environmental dataset collected during day/night cycles in an open ocean environment, which was published earlier. Within the phytoplankton community the genus Ostreococcus was dominant and exhibited robust rhythms of gene expression. Ostreococcus genes encoding the main Fe-S cluster proteins of PSI (PsaC), PSII (PsbE), cytochrome b6/f (subunit IV), ferredoxin, and proteins involved in nitrogen metabolism such as ferredoxin-dependent glutamate synthase (Fd-GOGAT) had similar patterns of expression during day/night cycles. Transcripts peaked in late morning and decreased during the afternoon. Low levels of mRNA persisted throughout the night (Fig. 1A and Fig. S1A). In contrast the gene encoding the main iron storage protein ferritin had an opposite pattern of expression with a maximum level of transcript around dusk. Similar expression patterns were observed for genes encoding photosynthesis Fe-S proteins and ferritin in cultures of O. tauri grown under day/night conditions (Fig. S1B).
Fig. 1.
Day/night and circadian regulation of ferritin and major iron-containing proteins in the field and in cultures. (A) Relative transcript abundance of ferritin (Ftn) and iron-containing proteins of PSI (PsaC), cytochrome b6/f (PetD), ferredoxin (PetF), and ferredoxin (Fd-GOGAT) during two complete day/night cycles [from an environmental dataset sampled on the Pacific Coast of the United States between September 16 and September 18, 2010 (25)]. The gray areas indicate the night period [photosynthetically active radiation (PAR) = 0]. (B) Day/night changes in the level of the PsaC protein. (Upper) Western blot analysis of PsaC under 12-h/12-h light/dark conditions. (Lower) Density quantitation of PsaC levels normalized to the mean signal. Data are shown as mean ± SD (n = 3). (C) Day/night changes in the level of ferritin inferred from the relative luminescence of the ferritin-luc (FTN-luc) translational reporter normalized to the mean signal. Data are shown as mean ± SD (n = 5). (D) Circadian regulation of ferritin expression. Translational reporters of FTN-luc (solid line) and circadian clock-associated 1 protein (CCA1-Luc, dashed line) were placed in constant light after entrainment under 12-h/12-h light/dark conditions. Normalized luminescence to the mean signal is shown (mean ± SD, n = 5).
Fig. S1.
Comparison of day/night patterns of transcripts in environmental metatranscriptomic data and O. tauri cultures. (A) Transcripts abundance of Ostreococcus sp in an environmental dataset from the Pacific Coast of the United States (25). Shown are transcript read numbers for PSI (Top), PSII (Middle), and Cytb/6f (Bottom) genes. (B) Gene-expression profiles from microarray data of O. tauri cells grown under day/night conditions: ferritin/ferredoxin (Top), PSII (Middle), and PSI (Bottom) genes. Changes in gene expression are expressed in a Δlog2 ratio. In each panel gray areas represent night time; for in situ experiments, night time corresponds to periods when PAR = 0.
The protein levels of the main iron-containing protein (PsaC) and ferritin were determined in O. tauri cultures exposed to day/night cycles. Western blot analysis confirmed a rhythmic expression of PsaC with a maximum protein level in the middle of the day (Fig. 1B). A ferritin-luciferase (FTN-luc) translational reporter line (corresponding to a random insertion in the genome of the entire ferritin gene fused in frame to luciferase) was used to estimate O. tauri ferritin protein regulation in living cells (Fig. 1C). Under a day/night cycle, FTN-luc reporter lines showed rhythmic luminescence patterns. The luminescence increased abruptly after dusk and remained high during the night. A rapid drop in luminescence was observed at dawn, followed by a slow decrease until the end of the day. Rhythmic patterns of luminescence of FTN-luc were still observed when cells entrained under a 12-h/12-h day/night cycle were transferred to constant light, i.e., conditions in which FTN-luc is driven only by the circadian clock (Fig. 1D). The period of oscillation was close to 24 h, indicating that the expression of ferritin is regulated by the circadian clock.
Ferritin in the Regulation of Cellular Iron Content and Uptake.
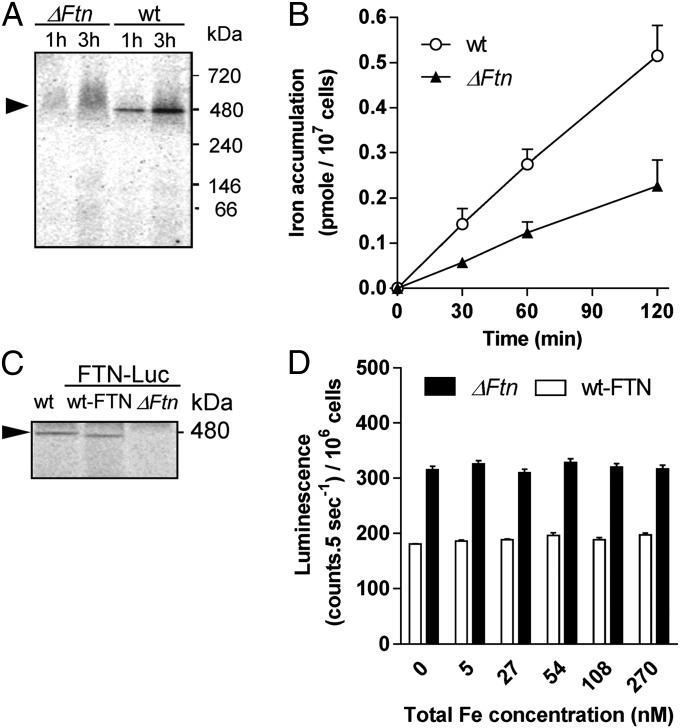
The iron-binding capacity of O. tauri ferritin was investigated using short-term (1- to 3-h) incubations of WT cells and a ΔFtn ferritin knock-out line (30) in the presence of 1 µM 55Fe(III) citrate in Mf medium. We evidenced iron-binding proteins on blue native gels, using the mild detergent digitonin to avoid iron release from proteins (31). As we previously reported (32), this is a convenient method for studying iron-containing proteins, even if we cannot rule out the possibility that some iron-containing proteins other than ferritin may be destabilized in the presence of digitonin. Autoradiography of radiolabeled proteins revealed a major band around 480 kDa in WT cells which was not detected in ΔFtn cells, suggesting that this band corresponds to a functional ferritin complex (Fig. 2A).
Fig. 2.
Functional analysis of ferritin in O. tauri. (A) Detection of ferritin on blue native PAGE. WT and ΔFtn cells were incubated in Mf medium with 1 µM 55Fe(III) citrate for 1 or 3 h and were washed twice with Mf medium. Protein extracts (25 µg per lane) were separated by blue native PAGE. Autoradiography of dried gel reveals one band at 480 kDa (black arrow) in WT but not ΔFtn protein extracts. (B) Iron uptake by WT and ΔFtn cells incubated in Mf medium with 1 µM 55Fe(III) EDTA (1:2). Values are means ± SD from three experiments. (C) Iron binding to ferritin in FTN-Luc (ΔFtn) knock-in and FTN-Luc (WT-FTN). 55Fe-labeled proteins (25 µg per lane) were analyzed in blue native PAGE as described in A. (D) Iron-dependent regulation of ferritin in FTN-Luc (ΔFtn) knock-in and FTN-Luc (WT-FTN). Cells acclimated for 7 d in 270nM Fe(III) EDTA were transferred to Aquil medium containing various amounts of total Fe. In vivo luminescence of reporter lines is plotted as a function of total Fe concentration. Data shown are means ± SD from five experiments (n = 5).
The cellular content of 55Fe was 2.5-fold higher in WT than in ΔFtn cells after 120 min of incubation with 1 µM 55Fe(III) EDTA, indicating that the ferritin complex contributes significantly to cellular iron content (Fig. 2B). The iron uptake rate (ρFe) from Fe(III) EDTA was about 0.42 fmol/min per 106 cells in WT cells, versus 0.18 fmol/⋅min per 106 cells in ΔFtn cells.
The regulation of ferritin synthesis in response to extracellular iron was determined by using luciferase reporter lines in two different genetic backgrounds (Fig. 2C); FTN-luc (WT-FTN), described above, and FTN-luc (ΔFtn), a line in which the luciferase is fused in frame to ferritin (24 kDa) at the native locus giving rise to a 90-kDa protein (30). A radiolabeled band at the expected size for the ferritin complex (480 kDa) was observed in WT but not in ΔFtn cells grown in the presence of 1 µM 55Fe(III) citrate. This result confirmed that the FTN-luc (ΔFtn) line lacks a functional ferritin complex but that the FTN-luc fusion protein did not prevent the formation of a functional ferritin complex in the FTN-luc (WT-FTN) line. Fig. 2D shows the luminescence levels of the two FTN-Luc reporter lines in response to changes in extracellular iron concentration. To buffer iron in the culture medium, it was provided as Fe(III) EDTA (33). Cells were first acclimated in Aquil medium containing a concentration of 270 nM Fe(III) EDTA (at lower concentrations the growth rate decreased progressively, reaching nearly 0 for concentrations below 54 nM). Cells then were transferred to medium containing various concentrations of Fe(III) EDTA. In FTN-luc (WT-FTN) and FTN-luc (ΔFtn) cells, no variation of luminescence was observed when the total Fe concentration was decreased below 270 nM. These results suggest that ferritin expression is not induced or repressed in response to iron limitation.
Ferritin in the Day/Night Regulation of Iron Uptake.
The results presented in Fig. 2 show that ferritin plays a role in iron uptake. Furthermore the ρFe varies throughout the day/night cycle (33). Because ferritin gene expression is regulated by the day/night cycle (Fig. 1), we measured the ρFe of the ΔFtn versus the WT line at different times of the day/night cycle in exponentially growing cells (about one division/d) in Fe(III) citrate Mf medium.
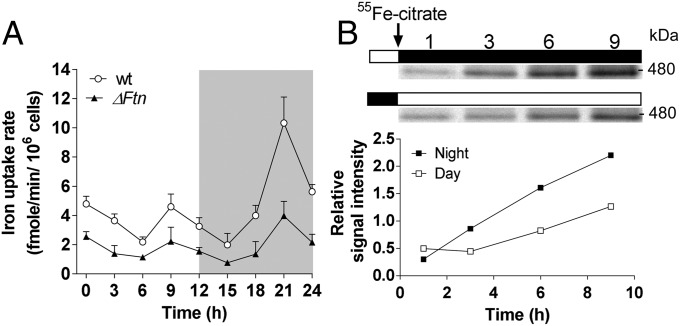
Iron uptake kinetics (15 min long) were performed every 3 h over a 12-h/12-h day/night cycle (Fig. 3A). WT cells displayed two main peaks in ρFe, one at the end of the day (8 fmol/min per 106 cells) and one at the end of the night (12 fmol/min per 106 cells), as previously described (33). ΔFtn cells showed drastically reduced ρFe with maximal rates of 2.2 and 4 pmol/min per 106 cells, corresponding to 2.1- to 2.6-fold reductions compared with WT maximal peaks of ρFe at 9 and 21 h, respectively (Fig. 3A).
Fig. 3.
Role of ferritin in the day/night regulation of iron uptake in exponentially growing cells of O. tauri. (A) Regulation of iron uptake through a day/night cycle. WT and ΔFtn cells were grown under day/night conditions for 5 d in Mf medium containing 0.1 µM Fe(III) EDTA and then were shifted to iron-free Mf medium until the exponential growth phase. Every 3 h, 50 mL (about 20 × 106 cells/mL) of each culture were harvested. The cells were washed with iron-free medium before 1 µM of 55Fe(III) citrate was added. The uptake rate of 55Fe (ρFe) was determined for 15 min. Data shown are means ± SD from three experiments. (B) Kinetics of ferritin loading. WT and ΔFtn cells grown as described in A were incubated beginning at dawn or dusk with 1 µM 55Fe(III) citrate. (Upper) Ferritin was detected by autoradiography of proteins (25 µg per lane) on blue native PAGE at 480 kDa. (Lower) Quantitation of ferritin band intensity was normalized to the mean signal.
The kinetics of ferritin iron loading was assessed in the same conditions (Fig. 3B). WT cells were incubated with 55Fe beginning at either dawn or dusk (Fig. 3B). When iron was provided at dawn, incorporation of 55Fe into ferritin increased progressively from 3 h after dawn until the end of the day. On the other hand, when iron was supplied at dusk, ferritin loading was continuous during the night. In addition, the relative rate of incorporation of 55Fe was twofold higher during the night than during the day.
Day/Night Rhythms of Iron-Binding Proteins.
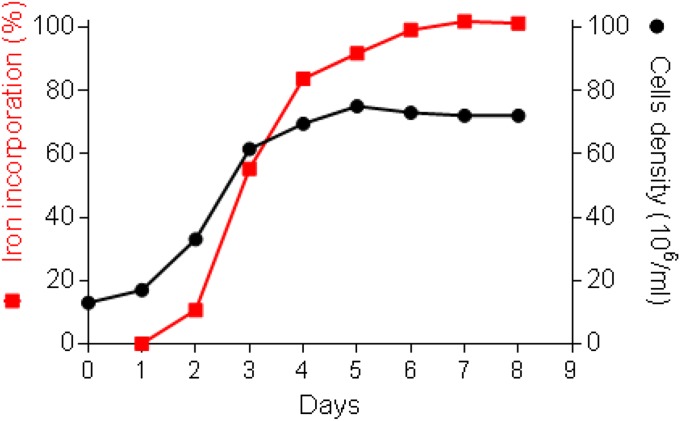
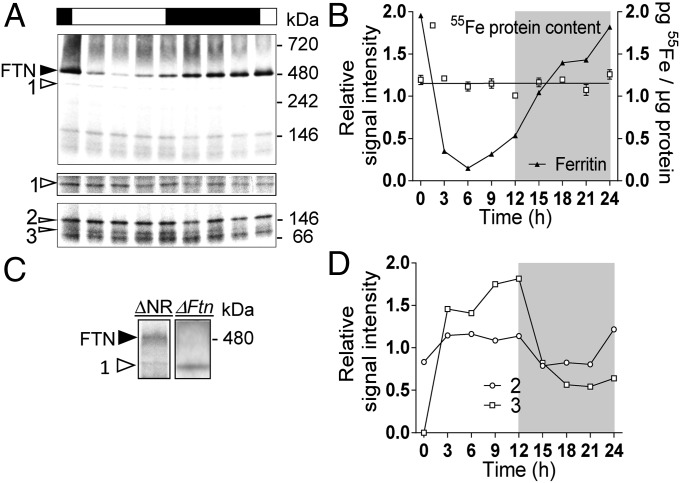
In the following experiment, cells were grown for 1 wk (stationary growth phase, no cell division) in Mf medium containing 1 µM of 55Fe(III) citrate under 12-h/12-h light/dark cycles. Under these conditions, more than 99% of the soluble radioactive iron was depleted from the medium after 6 d (Fig. S2).We analyzed the fate of iron (total cellular iron, iron bound to ferritin, and iron associated to other proteins) over one day/night cycle (Fig. 4). Analysis on nondenaturing gels revealed that ferritin (around 480 kDa) was the most prominently labeled protein (Fig. 4A). Ferritin labeling was maximal at dawn and decreased sharply until midday before increasing progressively again until dusk and increasing more markedly during the night until dawn (Fig. 4A). Although the total cellular iron per milligram of protein did not change over the day/night cycle, strong variations were observed in the levels of the 55Fe-radiolabeled ferritin band, with a more than 10-fold difference between the highest and lowest levels (Fig. 4B). With longer times of autoradiography, several bands also were detected at lower molecular weight (Fig. 4A, Bottom). Proteins from these bands were analyzed by electrospray ionization tandem mass spectroscopy (ESI-MS/MS), which revealed several proteins involved in nitrate metabolism (Table S1). Best Mascot score for band 2 (around 150 kDa) was attributed to Fd-GOGAT with 58 unique peptides. Around 100 kDa the plastid-targeted nitrite reductase (NiR) was the first putative iron-binding Fe-S protein (fourth Mascot score, 42 unique peptides). Nitrate reductase (NR) was the first putative iron-binding protein identified, at around 350 kDa in band 1 (19 unique peptides, 22nd Mascot score), and the radiolabeled band at 350 kDa was not detected in a nitrate reductase (ΔNR) knock-out line (Fig. 4C). All these protein bands (except NR), showed a day/night variation in their iron content (Fig. 4D). The amount of iron associated with NiR and Fd-GOGAT was higher during the day than during the night.
Fig. S2.
Kinetics of 55Fe incorporation from 55Fe(III) citrate into O. tauri growing cells. 55Fe(III) citrate (1 µM) was added to cultures of O. tauri inoculated at 10 × 106 cells/mL at day 1 after 24 h of culture. Cell growth was monitored by flow cytometry for 1 wk (black circles). The amount of intracellular iron was quantified by scintillation counting after the cells were washed twice with an oxalate/EDTA buffer. The cell cultures reached stationary phase (70 × 106 cells/mL) after 4 to 5 d. After 5 d in culture, more than 99% of added Fe(III) citrate had been incorporated by the cells (red squares). Data shown are the mean of two independent experiments.
Fig. 4.
Detection of iron-binding proteins under a day/night cycle in stationary growth-phase cells of O. tauri. Proteins (25 µg per sample) from WT cells grown for 7 d with 1 µM 55Fe(III) citrate in Mf medium under a 12-h/12-h light/dark cycle were separated on blue native PAGE. (A) Autoradiography of radiolabeled proteins. Black and white boxes represent night and day, respectively; the two lower panels correspond to longer exposure time of the same gel. Arrowheads indicate the main iron-binding proteins, identified as ferritin (FTN) and putative NR (1), Fd-GOGAT (2), and NiR (3). See Table S1. (B) Quantitation of ferritin band intensity, normalized to the mean signal, reveals strong variation of radiolabeling over the day/night cycle. The 55Fe content of whole-protein extracts measured by liquid scintillation remained constant between the samples. (C) Autoradiography of Blue native PAGE (25 µg of protein in two different gels) of ΔFtn and ΔNR proteins from cells grown in Mf medium containing 1 µM 55Fe(III) citrate. Band 1 was absent from ΔNR cells but was present in ΔFtn cells which lack ferritin. (D) Quantitation of the main iron-binding proteins in A. The signal intensity is normalized to the mean signal.
Table S1.
Mass spectrometry analysis of the main iron-binding proteins presented as a Mascot report
| Accession | Description | Score | Coverage | No. of proteins | No. unique peptides | No. of peptides | No. of PSM | Area | No. of AAs | Mass, kDa | Calc. pI |
| 350 kDa | |||||||||||
| 308798739 | P-type ATPase (ISS) [O. tauri] | 1,088.96 | 28.92 | 1 | 49 | 31 | 39 | 1,172 | 128.2 | 6.25 | |
| 308801239 | Sor-like protein (ISS) [O. tauri] | 1,002.01 | 42.94 | 1 | 19 | 14 | 41 | 9.294E7 | 347 | 37.5 | 7.39 |
| 308799545 | Glutamine synthetase, catalytic domain (ISS) [O. tauri] | 913.21 | 43.33 | 1 | 38 | 24 | 50 | 8.668E7 | 690 | 75.4 | 5.83 |
| 308811799 | Peptide exporter, ABC superfamily (ISS) [O. tauri] | 873.10 | 25.95 | 1 | 34 | 25 | 31 | 2.965E6 | 1,079 | 119.3 | 6.49 |
| 308799207 | Acetyl-CoA carboxylase (ISS) [O. tauri] | 872.52 | 21.38 | 1 | 71 | 40 | 42 | 1.346E6 | 2,123 | 233.6 | 6.24 |
| 308809732 | Unnamed protein product [O. tauri] | 846.71 | 28.82 | 1 | 31 | 20 | 31 | 1.250E7 | 864 | 95.1 | 6.62 |
| 308801004 | Pyruvate, phosphate dikinase, chloroplast [Precursor] (IC) [O. tauri] | 818.15 | 31.15 | 2 | 40 | 25 | 40 | 1.071E7 | 931 | 100.4 | 5.25 |
| 308807779 | ACA11_ARATH Potential calcium-transporting ATPase 11, plasma membrane-type (ISS) [O. tauri] | 796.92 | 31.73 | 1 | 55 | 29 | 34 | 3.013E6 | 1,062 | 114.1 | 6.01 |
| 113170470 | Ribulose-1,5-bisphosphate carboxylase/oxygenase large subunit [O. tauri] | 752.73 | 46.95 | 1 | 36 | 19 | 40 | 3.484E7 | 475 | 52.5 | 6.48 |
| 308811204 | Chaperone HSP104 and related ATP-dependent Clp proteases (ISS) [O. tauri] | 686.41 | 37.77 | 2 | 41 | 26 | 26 | 3.347E6 | 781 | 86.0 | 5.30 |
| 308813361 | Putative hsp70 (ISS) [O. tauri] | 598.65 | 31.03 | 1 | 26 | 18 | 26 | 5.411E6 | 651 | 72.2 | 8.82 |
| 308806445 | Chloroplast inner envelope protein-related (ISS) [O. tauri] | 597.57 | 21.55 | 1 | 33 | 23 | 25 | 1.153E6 | 1,174 | 127.6 | 6.18 |
| 308802856 | Magnesium chelatase H subunit (ISS) [O. tauri] | 597.57 | 22.91 | 1 | 46 | 25 | 26 | 1.561E6 | 1,397 | 153.6 | 5.59 |
| 308808950 | NADP-glyceraldehyde-3-phosphate dehydrogenase (IC) [O. tauri] | 578.93 | 50.79 | 2 | 20 | 15 | 23 | 6.713E6 | 378 | 40.2 | 8.25 |
| 113170490 | Atp1 [O. tauri] | 565.70 | 37.99 | 1 | 25 | 17 | 19 | 5.579E6 | 508 | 55.1 | 5.76 |
| 113170421 | AtpB [O. tauri] | 563.54 | 40.17 | 1 | 25 | 15 | 21 | 1.343E7 | 483 | 51.8 | 4.93 |
| 308800160 | Bip Luminal binding protein precursor, probable (IC) [O. tauri] | 545.76 | 25.94 | 1 | 26 | 15 | 19 | 1.816E6 | 663 | 73.2 | 5.03 |
| 113170436 | TufA [O. tauri] | 527.42 | 50.12 | 1 | 22 | 16 | 26 | 5.358E6 | 409 | 44.4 | 5.15 |
| 308810280 | RuBisCO subunit binding-protein alpha subunit, chloroplast [Prec (IC) [O. tauri] | 500.14 | 28.35 | 1 | 27 | 12 | 13 | 3.977E6 | 575 | 61.2 | 5.10 |
| 308806437 | Transketolase (ISS) [O. tauri] | 481.87 | 17.45 | 1 | 23 | 10 | 11 | 2.134E6 | 745 | 80.8 | 6.47 |
| 308809675 | Tricorn protease homolog (ISS) [O. tauri] | 473.04 | 15.95 | 1 | 31 | 20 | 23 | 1.971E6 | 1,467 | 161.1 | 6.80 |
| 308806706 | Acetyl-CoA carboxylase (ISS) [O. tauri] | 451.56 | 19.81 | 1 | 31 | 24 | 25 | 1.353E6 | 1,272 | 137.4 | 6.38 |
| 308808432 | Nia, nitrate reductase apoenzyme (IC) [O. tauri] | 450.30 | 20.59 | 1 | 26 | 17 | 18 | 1.724E6 | 952 | 106.1 | 6.25 |
| 308800570 | Ggh geranylgeranyl reductase (IC) [O. tauri] | 440.59 | 31.82 | 1 | 21 | 12 | 14 | 8.770E5 | 462 | 51.4 | 8.03 |
| 308811769 | Unnamed protein product [O. tauri] | 436.99 | 11.91 | 2 | 34 | 14 | 14 | 6.838E5 | 1,536 | 171.8 | 4.83 |
| 150 kDa | |||||||||||
| 308811414 | Ferredoxin-dependent glutamate synthase (ISS) [O. tauri] | 1,994.81 | 50.72 | 1 | 63 | 57 | 104 | 7.169E7 | 1,382 | 148.1 | 5.83 |
| 308806437 | Transketolase (ISS) [O. tauri] | 1,834.99 | 46.04 | 1 | 23 | 22 | 73 | 1.943E8 | 745 | 80.8 | 6.47 |
| 308811328 | Mitochondrial elongation factor (ISS) [O. tauri] | 1,133.92 | 44.27 | 1 | 44 | 35 | 55 | 4.494E7 | 820 | 91.3 | 5.90 |
| 308813361 | Putative hsp70 (ISS) [O. tauri] | 1,084.78 | 36.71 | 1 | 26 | 24 | 45 | 3.701E7 | 651 | 72.2 | 8.82 |
| 308800160 | Bip Luminal binding protein precursor, probable (IC) [O. tauri] | 1,034.57 | 44.19 | 1 | 26 | 29 | 42 | 2.053E7 | 663 | 73.2 | 5.03 |
| 308799607 | Unnamed protein product [O. tauri] | 907.30 | 32.43 | 1 | 12 | 11 | 34 | 4.117E7 | 441 | 46.9 | 4.49 |
| 308810280 | RuBisCO subunit binding-protein alpha subunit, chloroplast [Prec (IC) [O. tauri] | 897.85 | 40.87 | 1 | 27 | 20 | 26 | 1.355E7 | 575 | 61.2 | 5.10 |
| 308803252 | Heat shock protein 70/HSP70 (ISS) [O. tauri] | 874.42 | 39.52 | 1 | 25 | 21 | 27 | 1.068E7 | 673 | 72.0 | 5.67 |
| 308808950 | NADP-glyceraldehyde-3-phosphate dehydrogenase (IC) [O. tauri] | 871.07 | 57.67 | 2 | 20 | 21 | 41 | 4.118E7 | 378 | 40.2 | 8.25 |
| 308799163 | Oxidoreductase (ISS) [O. tauri] | 837.17 | 45.06 | 1 | 32 | 29 | 34 | 6.722E6 | 790 | 86.1 | 8.22 |
| 308799545 | Glutamine synthetase, catalytic domain (ISS) [O. tauri] | 813.04 | 35.65 | 1 | 38 | 18 | 33 | 4.371E7 | 690 | 75.4 | 5.83 |
| 308798869 | Enolase (ISS) [O. tauri] | 769.55 | 21.58 | 1 | 27 | 23 | 37 | 1.760E7 | 1,228 | 134.4 | 8.66 |
| 308806027 | Rubisco subunit binding-protein beta-2 subunit (60 kD Chaperonin (IC) [O. tauri] | 758.16 | 37.36 | 1 | 30 | 22 | 25 | 1.113E7 | 621 | 65.9 | 5.49 |
| 308806473 | Elongation factor G, chloroplast precursor (ISS) [O. tauri] | 729.53 | 30.63 | 1 | 23 | 20 | 26 | 7.540E6 | 790 | 86.5 | 5.44 |
| 308810507 | EF-1 alpha-like protein (ISS) [O. tauri] | 726.56 | 45.92 | 3 | 29 | 21 | 33 | 2.520E7 | 490 | 54.1 | 8.16 |
| 100 kDa | |||||||||||
| 308798869 | Enolase (ISS) [O. tauri] | 1,186.95 | 21.58 | 1 | 27 | 23 | 51 | 1.848E7 | 1,228 | 134.4 | 8.66 |
| 308808950 | NADP-glyceraldehyde-3-phosphate dehydrogenase (IC) [O. tauri] | 1,029.64 | 52.38 | 2 | 20 | 17 | 40 | 2.606E7 | 378 | 40.2 | 8.25 |
| 308813361 | Putative hsp70 (ISS) [O. tauri] | 1,023.10 | 35.64 | 1 | 26 | 22 | 41 | 1.883E7 | 651 | 72.2 | 8.82 |
| 308808434 | Nii. plastid-targeted nitrite reductase apoenzyme (IC) [O. tauri] | 981.43 | 44.22 | 1 | 43 | 38 | 53 | 1.062E7 | 986 | 108.4 | 7.08 |
| 308806437 | Transketolase (ISS) [O. tauri] | 902.05 | 27.65 | 1 | 23 | 15 | 28 | 8.908E6 | 745 | 80.8 | 6.47 |
| 308812292 | MGC53673 protein (ISS) [O. tauri] | 862.74 | 53.92 | 1 | 33 | 29 | 49 | 1.205E7 | 651 | 71.2 | 8.02 |
| 113170421 | AtpB [O. tauri] | 848.06 | 44.10 | 1 | 25 | 16 | 34 | 1.057E7 | 483 | 51.8 | 4.93 |
| 308813696 | Predicted serine-pyruvate aminotransferase (ISS) [O. tauri] | 814.87 | 24.19 | 1 | 19 | 14 | 36 | 2.226E7 | 868 | 93.7 | 7.18 |
| 308806027 | Rubisco subunit binding-protein beta-2 subunit (60 kD Chaperonin (IC) [O. tauri] | 766.87 | 44.12 | 1 | 30 | 23 | 29 | 9.201E6 | 621 | 65.9 | 5.49 |
| 308801693 | Putative ketol-acid reductoisomerase (ISS) [O. tauri] | 712.47 | 33.58 | 1 | 22 | 16 | 25 | 8.480E6 | 545 | 59.3 | 6.74 |
| 308802948 | RuBisCO Activase (IC) [O. tauri] | 692.59 | 49.39 | 1 | 21 | 15 | 29 | 1.089E7 | 407 | 44.5 | 6.44 |
| 113170436 | TufA [O. tauri] | 689.08 | 42.79 | 1 | 22 | 14 | 25 | 7.940E6 | 409 | 44.4 | 5.15 |
| 308800160 | Bip Luminal binding protein precursor, probable (IC) [O. tauri] | 671.20 | 32.13 | 1 | 26 | 20 | 25 | 6.636E6 | 663 | 73.2 | 5.03 |
| 308809581 | Cytosolic phosphoglucose isomerase (ISS) [O. tauri] | 664.07 | 29.32 | 2 | 18 | 17 | 29 | 7.081E6 | 590 | 65.0 | 5.86 |
| 308806473 | Elongation factor G, chloroplast precursor (ISS) [O. tauri] | 653.82 | 30.89 | 1 | 23 | 20 | 30 | 4.777E6 | 790 | 86.5 | 5.44 |
| 308810280 | RuBisCO subunit binding-protein alpha subunit, chloroplast [Prec (IC) [O. tauri] | 636.98 | 37.91 | 1 | 27 | 17 | 18 | 2.468E6 | 575 | 61.2 | 5.10 |
| 308808936 | Putative UV-damaged DNA binding factor (ISS) [O. tauri] | 634.55 | 20.90 | 2 | 27 | 23 | 25 | 1.786E6 | 1,282 | 140.8 | 5.34 |
Ferritin Is Required for Cell Survival Under Iron Limitation in Day/Night and Circadian Conditions.
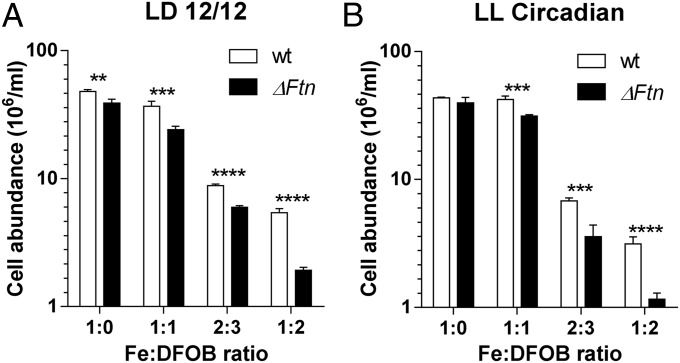
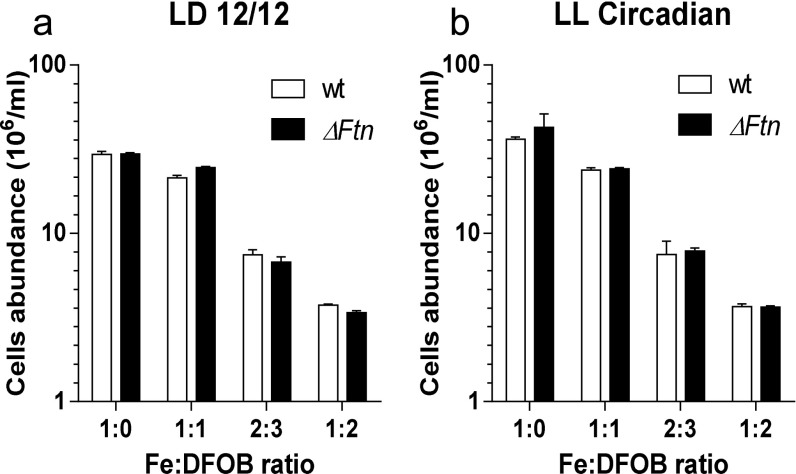
The importance of ferritin for cell survival under day/night conditions was investigated by exposing WT and ΔFtn cells to various concentrations of the siderophore desferrioxamine B (DFOB). DFOB acts as a strong extracellular chelator of iron because the Fe-DFOB complex cannot be used as an iron source by O. tauri (34). Under control conditions (without DFOB) ΔFtn cells reached cellular abundances that were significantly lower than those of WT cells (n = 5; P < 0.01 in multiple t-test using Holm–Sidak method; α = 0.5%) (Fig. 5). The addition of DFOB to final concentrations of 2 µM compromised cell survival to a much larger extent in ΔFtn than in WT cells, with the abundance of cells lacking ferritin reaching only 35% of cell abundance in WT cultures (P < 0.0001).
Fig. 5.
The role of ferritin in O. tauri cell survival under iron limitation. Cell survival of WT and ΔFtn cells grown in Mf medium containing 1 µM Fe(III) citrate in the presence of increasing concentrations of DFOB under a light irradiance of 100 µmol⋅quanta−1⋅m−2⋅s−1. Cell abundances were determined by flow cytometry. (A) Cells were grown under 12-h/12-h light/dark conditions. (B) Cells entrained under 12-h/12-h light/dark conditions for 5 d were transferred under constant light corresponding to circadian free-running conditions of constant light. Data are shown as mean ± SD (n = 4). Significant differences in cell abundances between WT and ΔFtn cells were determined by the multiple t-test using the Holm–Sidak method, α = 0.5% (**P < 0.01; ***P < 0.001; ****P < 0.0001).
The same experiment was performed under constant light after an initial entrainment under 12-h/12-h light/dark cycles. In these circadian conditions the synthesis of ferritin was driven only by the circadian clock (Fig. 2). Cell survival was 50% lower in ΔFtn than in WT cells (P < 0.001) at concentrations of 1.5 µM DFOB and was 60% lower at concentrations of 2 µM (P < 0.0001).
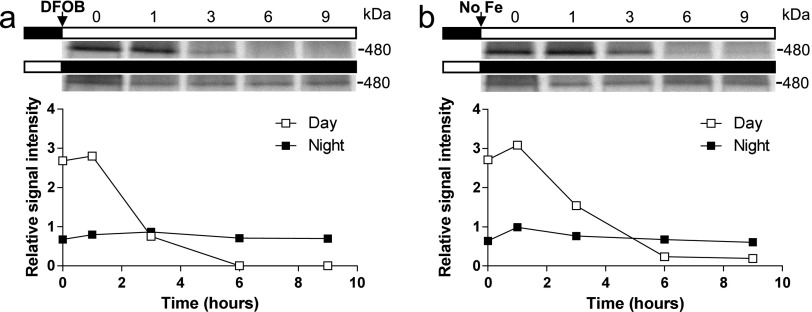
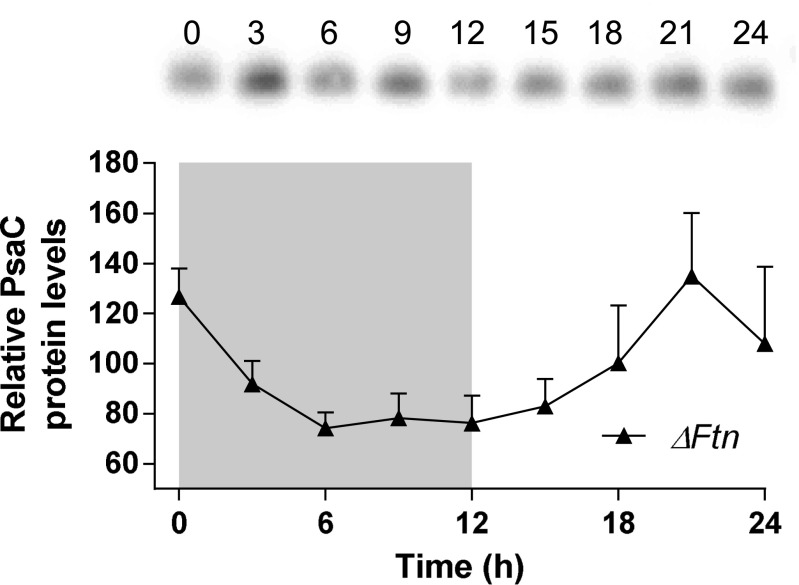
DFOB was added at dawn or dusk to cells that were previously loaded with 55Fe for 1 wk, as described above (Fig. 4A). When DFOB was added at dawn, ferritin 55Fe labeling decreased sharply after 1 h to reach undetectable levels in less than 6 h (Fig. S3). In contrast, ferritin 55Fe labeling remained fairly constant when DFOB was added at dusk. These results suggest that when the external supply of iron is inhibited by DFOB, release of iron from ferritin is during the day and during the night, in agreement with the results presented above (Fig. 4); i.e., iron can be released from ferritin rapidly during the day but not during the night. Monitoring the levels of the Fe-S protein PsaC in ΔFtn cells revealed day/night rhythms similar to those in WT cells (Fig. 1C and Fig. S4), indicating that the turnover of the PsaC protein occurs even in the absence of ferritin and raising the question whether ferritin could be used at night to store iron released from proteins such as PsaC or NiR. To test this hypothesis, we performed the experiment described in Fig. 5, at lower light intensities (20 μmol quanta.cm−2⋅s−1 vs. 100 μmol quanta.cm−2⋅s−1). Under these conditions, where light stress is reduced, no significant differences in cell survival were observed between WT and ΔFtn cells (Fig. S5).
Fig. S3.
Effect of DFOB on the kinetics of ferritin iron unloading under day/night conditions. Cells grown in 1 µM 55Fe(III) citrate were washed and resuspended in Mf medium. (A) Cells treated with 1.5 µM DFOB. (B) Control cells in Mf medium. Upper panels in A and B show autoradiography of 55F-labeled ferritin from dawn (upper band) or dusk (lower band) on a blue native PAGE. Lower panels in A and B show quantization of ferritin band intensity normalized to the mean signal. During the night, DFOB had no effect on ferritin labeling.
Fig. S4.
Western analysis of PsaC level under day/night conditions in in ΔFtn cells. (Upper) Western blot analysis of anti-PsaC. Cells were harvested every 3 h during a 12-h/12-h day/night cycle. (Lower) Normalized density quantization of the anti-PsaC blot. The gray area represents the night period. Data shown are means ± SD from three experiments (n = 3) expressed in percent of mean signal.
Fig. S5.
Role of ferritin in O. tauri cell survival under iron limitation and low light. (A) Cell survival of WT and ΔFtn cells grown in Mf medium containing 1 nM Fe(III) citrate in the presence of increasing concentrations of DFOB under light irradiance of 20 µmol⋅quanta−1⋅m−2⋅s−1. Cell abundances were determined by flow cytometry. (B) Cells entrained under 12-h/12-h light/dark (LD) conditions for 5 d were transferred to constant light (LL) corresponding to circadian free-running conditions of constant light. Data shown are mean ± SD (n = 4). No significant differences in cell abundances between WT and ΔFtn were determined by multiple t-tests using the Holm–Sidak method, α = 0.5%.
Discussion
Ferritin in the Day/Night Regulation of Iron Homeostasis.
Both in situ metatranscriptomic data and RNA microarray culture studies indicate that in the genus Ostreococcus ferritin gene expression is regulated by the day/night cycle with transcription peaking at the end of the day. The profile of the FTN-luc translational reporter further suggests that the ferritin protein is translated during the night and is degraded soon after the dark/light transition. In cultures of iron-limited cells, iron binding to ferritin also decreases dramatically after dawn. Comparison of FTN-luc levels and iron binding to ferritin suggests that the low level of iron-labeled ferritin after dawn may result from a light-dependent degradation of ferritin that ultimately results in lower amounts of the ferritin complex per cell. Maximal iron binding to ferritin, in contrast, is observed a few hours before dawn, that is, after a sustained synthesis of ferritin during the night as inferred from the FTN-luc reporter. In other words, our results suggest that transcriptional, translational, and light-dependent regulation of ferritin contributes strongly to the level of ferritin and ultimately of intracellular iron storage in the ferritin complex. This key role of ferritin in the regulation of iron homeostasis is well illustrated by the fact two- to threefold reduced iron cell content and reduced ρFe displayed by ΔFtn cells compared with WT cells (Fig. 2).
In exponentially growing cells of O. tauri, iron uptake is regulated by the day/night cycle with maximal ρFe before dawn and dusk. Under the same conditions, iron binding to ferritin increases progressively from midday to dusk and increases markedly throughout the night, suggesting that the variations in iron loading of ferritin do not result only from differential iron uptake over the day/night cycle. Internal ferritin-dependent recycling of iron also may operate during the exponential phase. In support of this hypothesis, the genes encoding ferritin and most other iron-binding proteins are regulated under a day/night cycle in exponentially growing cell cultures (Fig. 1).
ΔFtn cells display two- to threefold lower ρFe. A biphasic profile with maximal ρFe before dawn and dusk was observed, albeit with a reduced amplitude in ΔFtn cells, suggesting that ferritin itself is not the primary component in the diel regulation of iron uptake. The lower ρFe and ultimately lower iron content is most likely related to a perturbation of iron homeostasis in ΔFtn cells.
Significance of the Ferritin-Dependent Diel Recycling of Iron.
In stationary growth-phase cells that were preloaded with iron, 24-h cycles of iron loading and unloading of ferritin were observed, with maximum iron loading at night. A possible explanation is that ferritin acts as a diel storage for nighttime-acquired iron that then can be used to populate PSI and other day-expressed iron-binding proteins such as NR or NiR. The preferential uptake at dusk and during the night supports this hypothesis in exponentially growing cells. However, cycles of ferritin iron loading/unloading were observed in nondividing stationary-phase cells that already had taken up more than 99% of the extracellular iron and for which total protein iron remained constant during the time course of our experiments (Fig. 4). These cycles thus are more likely to arise from intracellular iron recycling than from differential uptake of iron over the day/night cycle. Under the same conditions, the main iron-binding proteins identified are involved in nitrogen reduction, among which the Fe-S cluster proteins NiR and GOGAT are expressed during the day. Other iron-rich proteins such as PsaC, cytochrome b6/f, and ferredoxin were not detected on blue native gels. The use of the detergent digitonin may have destabilized some metalloproteins, resulting in the loss of 55Fe, possibly explaining why some well-known iron-binding proteins were not detected by autoradiography in our experiments. It also is possible that some native high-molecular-weight protein complexes, such as those of PSI or the respiratory chain, were not resolved during the electrophoresis process. A more complete analysis of iron proteins would require the use of emerging metalloproteomic methods such as native multidimensional chromatography (35). The PsaC protein, however, also exhibited 24-h rhythms of expression with maximum levels during the day. Taken together, these data suggest that some of the iron contained in PSI and nitrogen-reducing enzymes during the day is transferred and stored in ferritin at night. At dawn, iron is released from ferritin and becomes available to the iron-containing proteins of PSI and nitrogen metabolism during the day. Interestingly, such a mechanism of iron conservation operates in the diazotrophic cyanobacterium Crocosphaera watsonii, and it has been proposed that iron is transferred from PSI proteins during the day to nitrogen fixation (Nif) proteins involved in nitrogen reduction at night (19).
The importance of ferritin-dependent recycling of intracellular iron is highlighted in cells grown in the presence of the extracellular chelator of iron DFOB, which prevents iron uptake from the extracellular medium. In this condition, cell survival is more severely compromised in ΔFtn cells than in WT cells. In mutant cells, day/night regulation of some iron-binding proteins still occurs, as shown for PsaC. Iron released by the degradation of proteins such as PsaC may accumulate as unbound iron, leading to increased mortality because of the high toxicity of iron (through the Fenton reaction). Another explanation is that, in cells lacking ferritin, (i) iron uptake is reduced and (ii) iron efflux is activated during day/night recycling of iron. In support of this hypothesis, it was reported that in a ferritin triple mutant of the plant Arabidopsis there is a massive accumulation of iron in the apoplastic space, suggesting that in the absence of iron buffering cells activate iron efflux and/or repress iron influx to limit the amount of free iron in the cell (36). Because O. tauri is unicellular, it is possible that in ΔFtn cells at dusk iron is exported outside the cell, where it would be bound either to the plasma membrane (34) or to exopolysaccharides (37, 38), thus remaining bioavailable for later uptake before dawn and dusk. In the presence of DFOB, extracellular iron would be irreversibly chelated and therefore would be unavailable to the cells. Overall our results suggest that the main function of ferritin in O. tauri is not so much the long-term storage of iron as the temporal storage of iron over the day/night cycle. Such a mechanism would be efficient for repairing and recycling damaged/oxidized iron-binding proteins while keeping the intracellular stock of iron intact for the following day. It has been proposed in pennate diatoms that long-term storage of iron in ferritin is a strategy for coping with sporadic iron supply (17). If ferritin is involved in the day/night regulation of iron recycling in these microalgae, as it is in O. tauri, then the day pool of iron-binding proteins (e.g., PSI proteins) should be sufficient to store transiently during the day the iron released from ferritin at dawn. It would be interesting to test this hypothesis experimentally.
Together our results suggest that in stationary-phase cells that do not take up extracellular iron, some internal iron bound to iron-rich proteins such as PSI proteins and NiR is released at the end of the day and transferred to ferritin. The biological significance of such iron recycling remains puzzling. A possible explanation is that upon the turnover of iron-binding proteins (e.g., in response to photodamage at the end of the day), the released iron is stored in ferritin until the proteins are synthesized de novo during the next day. In support of this hypothesis, we observed no difference between WT and ∆Ftn cell survival under low light, and it was reported that in the green alga Chlamydomonas the ferritin knock-down lines are more sensitive to photo-oxidation (39, 40). Day/night recycling of iron would be particularly important in iron-limited cells that are exposed to oxidative stress.
In summary, our results in O. tauri highlight the central role of ferritin in regulating several aspects of iron homeostasis (1). Ferritin is regulated by the day/night cycle under circadian clock control (2). Ferritin regulates the amplitude of iron uptake (iron which could be acquired during the night for chemical or ecological reasons that remain to be determined) (3). In cells that do not take up extracellular iron, cycles of ferritin iron loading and unloading may be used to store transiently the iron released from degraded iron-binding protein at night. Such storage would preserve the internal pool of iron for subsequent use the next day.
Methods
Algal Strains and Cell Culture Media.
The construction of the ferritin knock-out (ΔFtn), FTN-Luc knock-in translational reporters (WT and KO background), and NR knock-out (ΔNR) cells has been described elsewhere (30). Cells were grown at 20 °C under a 12-h/12-h light/dark regime or under constant light for monitoring circadian expression unless otherwise stated.
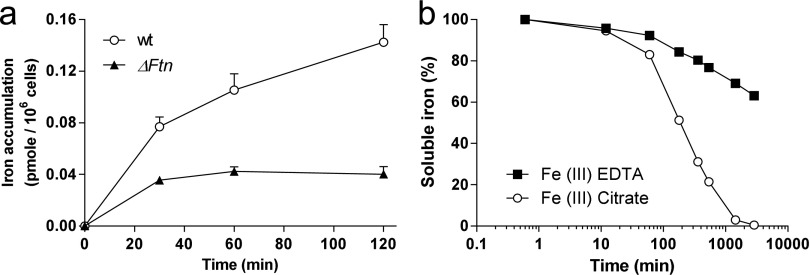
Different culture media were used depending on the experiment. When a precise control of the iron concentration and speciation were required, we used AQUIL medium (41, 42) with 100 µM EDTA. Different final concentrations of total iron were obtained by adding different amounts of Fe(III) EDTA complex. For all other experiments such as short-term Fe(III) uptake rate measurements and identification of iron-loaded proteins in one-dimensional gels, we used an EDTA-free medium (Mf) (34) containing Fe(III) citrate (1:20) at a final concentration of 1 µM. The higher uptake rates of iron by cells in this medium, compared with AQUIL medium, allow enough radioactive 55Fe to accumulate within the cells after short-term incubation to be detected by scintillation counting or autoradiography (Fig. S6A). The drawback of using Fe(III) citrate in a culture medium is that iron can precipitate rapidly. However, we have demonstrated that more 90% of 1 µM Fe(III) citrate is still present as soluble species 1 h after the addition of the complex to the medium (Fig. S6B). Because there is no consensus in the literature on the affinity constants for the different Fe(III) citrate complexes, we did not attempt to calculate the speciation of Fe(III) citrate precisely (43).
Fig. S6.
Fe(III) citrate uptake and precipitation. (A) Iron accumulation in WT and ΔFtn cells incubated with 1 µM Fe(III). The uptake was performed as described in Fig 2B but with Fe(III)-citrate instead of Fe(III) EDTA. Between 0 and 30 min the ρFe of WT cells was, as expected, about sixfold higher in Fe(III) citrate (2.57 fmol/min per 106 cells) than in Fe(III) EDTA (0.42 fmol/min per 106 cells). For ΔFtn cells a fourfold difference was observed. More importantly, ρFe decreased after 30 min in WT and ΔFtn cells, indicating that the Fe(III) citrate source should be used only for short-term experiments. (B) Time course of iron precipitation from 1 µM Fe(III)citrate (1 Fe: 20 citrate) and 1 µM Fe(III)-EDTA (1:2) in cell-free Mf medium. After 20 min, 95% of Fe(III) citrate is still in solution.
Iron Uptake Assays.
Iron uptake assays were performed with concentrated cell suspensions (50–100 × 107 cells/mL) incubated in the Mf medium described above. 55Fe (29,600 MBq/mg) was added as Fe(III) citrate at a final concentration of 1 µM. The cells were collected at intervals and were washed by centrifugation with an oxalate/EDTA mixture as described in ref. 4). The iron content of the cells was determined by scintillation counting after photosynthetic pigments were bleached with sodium hypochlorite.
Electrophoresis and Identification of Iron-Binding Proteins.
Cells grown in Mf medium with radiolabeled 55Fe(III) citrate (1 µM) were disrupted by sonication on ice. Proteins were solubilized with 0.5% digitonin and resolved in a blue native PAGE using the Novex Native PAGE Bis-Tris Gel 3–12% System (Invitrogen) according to the manufacturer’s protocol. The gels were vacuum dried and autoradiographed for 2–10 d using a Typhoon Trio PhosphorImager (Amersham). The 55Fe signals were quantified using ImageJ software (45). The main labeled proteins were cut from the gel and analyzed by ESI-MS/MS as described in SI Methods
SI Methods
Cell Culture in an Iron-Free Room.
All culture work and subsampling were conducted in a clean room (class 10,000) equipped with a laminar flow hood (class 100). We used polycarbonate bottles and plastic ware soaked in 10% HCl for 24 h and subsequently soaked overnight with ultrapure water (18.2 Mohm resistivity; Elga). All lab ware was sterilized three times by microwaving (5 min, 750 W) and then was dried under the laminar flow hood before use. Synthetic ocean water (41) and solutions of inorganic nutrients (NO3− and PO43-) were purified separately by removing trace metals using Chelex 100 ion-exchange resin (Bio-Rad). All solutions were filtered through metal-free 0.2-mm syringe Acrodisc filters (Pall Corporation) before use. Final nutrients concentrations were 300 µM NO3− and 10 µM PO43−. Trace metal solutions were buffered with 0.1 M EDTA to result in free-ion concentrations similar to those calculated in ref. 46. Cell number was determined with an Accuri C6 flow cytometer (BD).
Luminescence Recording and Analysis of Circadian Rhythms.
Luminescence was acquired for 5 s every hour using an automated microplate luminometer (LB Centro; Berthold Technologies, https://www.berthold.com). Statistical analyses were performed using BRASS (biological rhythms analysis software system; P. E. Brown, Warwick University, Coventry, UK). Fast Fourier transform nonlinear least square analysis was used to estimate the relative amplitude error (RAE, a measure of goodness of fit to a theoretical sine wave) and free running period (FRP), which were taken as objective measures of the rhythmicity of bioluminescence traces.
Identification of Iron-Binding Proteins by Mass Spectrometry.
Plugs were reduced with 10 mM DTT, alkylated with 55 mM iodoacetamide, and incubated overnight at 37 °C with 20 μL of 25 mmol/L NH4HCO3 containing sequencing-grade trypsin (12.5 μg/mL; Promega). The resulting peptides were sequentially extracted with 30% acetonitrile, 0.1% formic acid and 70% acetonitrile, 0.1% formic acid. Peptide analyses were performed by a LTQ Velos Orbitrap (Thermo Fisher Scientific) coupled to an Easy-nLC Proxeon 1000 chromatographic system (Thermo Fisher Scientific). Chromatographic separation of peptides was performed with the following parameters: Acclaim Pepmap100 precolumn (5 mm, 300-μm i.d., C18, 5 μm, 100 Å) and Acclaim PepMap-RSLC Proxeon column (50 cm, 75-μm i.d., C18, 2 μm, 100 Å), 300 n/min flow, gradient rising from 90% solvent A (2% acetonitrile, 0.1% formic acid) to 40% solvent B (100% acetonitrile, 0.1% formic acid) in 100 min and then rising to 80% B in 5 min. The peptides were analyzed in the Orbitrap in full ion scan mode at a resolution of 30,000 (at m/z 400), a mass range of 400–1,800 mass-to-charge ratio, and with an MS full scan maximum ion time of 100 ms. Fragments were obtained with collision-induced dissociation activation with a collisional energy of 35% and an activation collisional endothermicity of 0.250 for 10 ms and were analyzed in the LTQ in a second scan event. The ion-trap MS/MS maximum ion time was 50 ms. MS/MS data were acquired in a data-dependent mode in which the 20 most intense precursor ions were isolated, with a dynamic exclusion of 20 s and an exclusion mass width of 10 ppm. Data were processed with Proteome Discoverer 1.4 software (Thermo Fisher Scientific) coupled to an in-house Mascot search server (Matrix Science; version 2.4). The mass tolerance of fragment ions was set to 7 ppm for precursor ions and 0.5 Da for fragments. The following modifications were used in variable parameters: oxidation (Met) phosphorylation (Ser/Thr/Tyr), carbamidomethylation (Cys), acetylation (Lys/N-terminal), and deamidation (Asp/Asn). The maximum number of missed cleavages was limited to two for trypsin digestion. MS/MS data were compared with the O. tauri sequence database extracted from the National Center for Biotechnology Information nonredundant database. Q-values of peptides were calculated using the percolator algorithm, and a 1% filter was applied as a false-discovery rate threshold.
Quantitation of PsaC Protein by Immunoblotting.
PsaC protein standard (Agrisera) was used as a calibration standard curve. Samples were resolved for 40 min at 200 V in an MES-SDS running buffer (Invitrogen). Proteins were transferred onto a methanol prehydrated PVDF membrane (Sigma-Aldrich) using a liquid transfer system (Invitrogen) for 70 min at 30 mA for two membranes, in a transfer buffer consisting of 1.25 mmol/L N,N-bis (2-hydroxyethyl) glycine (Bicine), 1.25 mmol/L Bis(2-hydroxyethyl)iminotris (hydroxymethyl) methane (Bis-Tris), 0.05 mmol/L EDTA, 5 mmol/L DTT, 2.5 mmol/L chlorobutanol, and 10% methanol, pH 7.2. The membrane was immersed immediately in Tween 20–Tris-buffered saline (Tween-TBS) (Sigma-Aldrich) buffer, pH 7.6, (0.1% Tween 20, 350 mmol/L sodium chloride, 20 mmol/L Trizma base) containing 2% (wt:vol) blocking agent (Amersham Biosciences) and incubated overnight at 4 °C. Primary antibody PsaC (PSI core subunit; Agrisera) was diluted at 1:50,000 in Tween-TBS in the presence of 2% blocking agent, and the membrane was soaked in this solution for 1 h with slow agitation at room temperature. The primary antibody solution then was discarded, and the blot was washed extensively in Tween-TBS. Anti-rabbit secondary antibody coupled to HRP (Bio-Rad) diluted at 1:50,000 in Tween-TBS buffer containing 2% blocking agent was added for 1 h. The membrane was washed three times for 15 min in Tween-TBS buffer before revelation using the ECL Advance blocking reagent (Amersham Biosciences). Signals were measured using the Quantity One software (Bio-Rad). Protein standard curves were generated by fitting a two-factor polynomial function, and the protein concentrations were determined by fitting the sample signal values on the standard curve. Pilot experiments were performed to ensure that sample signals fell within the range spanned by the standard curve.
Acknowledgments
We thank Mak Saito for suggestions about interpreting our data. F.Y.-B., E.L, and C.B. received funding from the French National Research Agency “PhytoIron” Grant 11BSV7 018 02. H.B. was supported by a fellowship from the Institut National des Sciences de l’Univers (CNRS). R.S. was supported by Czech Science Foundation Grant 13-25349S and Project BIOCEV, CZ.1.05/1.1.00/02.0109. C.B. was the recipient of the European Research Council Advanced Award Diatomite.
Footnotes
The authors declare no conflict of interest.
This article is a PNAS Direct Submission.
This article contains supporting information online at www.pnas.org/lookup/suppl/doi:10.1073/pnas.1506074112/-/DCSupplemental.
References
- 1.Lukianova OA, David SS. A role for iron-sulfur clusters in DNA repair. Curr Opin Chem Biol. 2005;9(2):145–151. doi: 10.1016/j.cbpa.2005.02.006. [DOI] [PubMed] [Google Scholar]
- 2.Müh F, Glöckner C, Hellmich J, Zouni A. Light-induced quinone reduction in photosystem II. Biochim Biophys Acta. 2012;1817(1):44–65. doi: 10.1016/j.bbabio.2011.05.021. [DOI] [PubMed] [Google Scholar]
- 3.McHugh JP, et al. Global iron-dependent gene regulation in Escherichia coli. A new mechanism for iron homeostasis. J Biol Chem. 2003;278(32):29478–29486. doi: 10.1074/jbc.M303381200. [DOI] [PubMed] [Google Scholar]
- 4.Rueter JG, Ades DR. The role of iron nutrition in photosynthesis and nitrogen assimilation in Scenedesmus quadricauda (Chlorophyceae) J Phycol. 1987;23(3):452–457. [Google Scholar]
- 5.Tortell PD, Maldonado MT, Granger J, Price NM. Marine bacteria and biogeochemical cycling of iron in the oceans. FEMS Microbiol Ecol. 1999;29(1):1–11. [Google Scholar]
- 6.Mittler R. Oxidative stress, antioxidants and stress tolerance. Trends Plant Sci. 2002;7(9):405–410. doi: 10.1016/s1360-1385(02)02312-9. [DOI] [PubMed] [Google Scholar]
- 7.Halliwell B, Gutteridge JM. Biologically relevant metal ion-dependent hydroxyl radical generation. An update. FEBS Lett. 1992;307(1):108–112. doi: 10.1016/0014-5793(92)80911-y. [DOI] [PubMed] [Google Scholar]
- 8.Blain S, et al. Effect of natural iron fertilization on carbon sequestration in the Southern Ocean. Nature. 2007;446(7139):1070–1074. doi: 10.1038/nature05700. [DOI] [PubMed] [Google Scholar]
- 9.Ellwood MJ, et al. Iron stable isotopes track pelagic iron cycling during a subtropical phytoplankton bloom. Proc Natl Acad Sci USA. 2015;112(1):E15–E20. doi: 10.1073/pnas.1421576112. [DOI] [PMC free article] [PubMed] [Google Scholar]
- 10.Sunda WG, Huntsman SA. Interrelated influence of iron, light and cell size on marine phytoplankton growth. Nature. 1997;2051(1977):1193–1197. [Google Scholar]
- 11.Lis H, Shaked Y, Kranzler C, Keren N, Morel FMM. Iron bioavailability to phytoplankton: An empirical approach. ISME J. 2015;9(4):1003–1013. doi: 10.1038/ismej.2014.199. [DOI] [PMC free article] [PubMed] [Google Scholar]
- 12.Lommer M, et al. Genome and low-iron response of an oceanic diatom adapted to chronic iron limitation. Genome Biol. 2012;13(7):R66. doi: 10.1186/gb-2012-13-7-r66. [DOI] [PMC free article] [PubMed] [Google Scholar]
- 13.Nunn BL, et al. Diatom proteomics reveals unique acclimation strategies to mitigate Fe limitation. PLoS One. 2013;8(10):e75653. doi: 10.1371/journal.pone.0075653. [DOI] [PMC free article] [PubMed] [Google Scholar]
- 14.Strzepek RF, Harrison PJ. Photosynthetic architecture differs in coastal and oceanic diatoms. Nature. 2004;431(7009):689–692. doi: 10.1038/nature02954. [DOI] [PubMed] [Google Scholar]
- 15.Peers G, Price NM. Copper-containing plastocyanin used for electron transport by an oceanic diatom. Nature. 2006;441(7091):341–344. doi: 10.1038/nature04630. [DOI] [PubMed] [Google Scholar]
- 16.Castruita M. 2006. Iron storage proteins in the marine environment. PhD dissertation (Princeton University, Princeton)
- 17.Marchetti A, et al. Ferritin is used for iron storage in bloom-forming marine pennate diatoms. Nature. 2009;457(7228):467–470. doi: 10.1038/nature07539. [DOI] [PubMed] [Google Scholar]
- 18.Duc C, Cellier F, Lobréaux S, Briat J-F, Gaymard F. Regulation of iron homeostasis in Arabidopsis thaliana by the clock regulator time for coffee. J Biol Chem. 2009;284(52):36271–36281. doi: 10.1074/jbc.M109.059873. [DOI] [PMC free article] [PubMed] [Google Scholar]
- 19.Saito MA, et al. Iron conservation by reduction of metalloenzyme inventories in the marine diazotroph Crocosphaera watsonii. Proc Natl Acad Sci USA. 2011;108(6):2184–2189. doi: 10.1073/pnas.1006943108. [DOI] [PMC free article] [PubMed] [Google Scholar]
- 20.Vaquer A, Troussellier M, Courties C, Bibent B. Standing stock and dynamics of picophytoplankton in the Thau Lagoon (northwest Mediterranean coast) Limnol Oceanogr. 1996;41(8):1821–1828. [Google Scholar]
- 21.Bec B, Husseini-Ratrema J, Collos Y, Souchu P, Vaquer A. Phytoplankton seasonal dynamics in a Mediterranean coastal lagoon: Emphasis on the picoeukaryote community. J Plankton Res. 2005;27(9):881–894. [Google Scholar]
- 22.O’Kelly CJ, Sieracki ME, Thier EC, Hobson IC. A transient bloom of Ostreococcus (Chlorophyta, Prasinophyceae) in West Neck Bay, Long Island, New York. J Phycol. 2003;39(June):850–854. [Google Scholar]
- 23.Collado-Fabbri S, Vaulot D, Ulloa O. Structure and seasonal dynamics of the eukaryotic picophytoplankton community in a wind-driven coastal upwelling ecosystem. Limnol Oceanogr. 2011;56(6):2334–2346. [Google Scholar]
- 24.Demir-Hilton E, et al. Global distribution patterns of distinct clades of the photosynthetic picoeukaryote Ostreococcus. ISME J. 2011;5(7):1095–1107. doi: 10.1038/ismej.2010.209. [DOI] [PMC free article] [PubMed] [Google Scholar]
- 25.Ottesen EA, et al. Pattern and synchrony of gene expression among sympatric marine microbial populations. Proc Natl Acad Sci USA. 2013;110(6):E488–E497. doi: 10.1073/pnas.1222099110. [DOI] [PMC free article] [PubMed] [Google Scholar]
- 26.Monnier A, et al. Orchestrated transcription of biological processes in the marine picoeukaryote Ostreococcus exposed to light/dark cycles. BMC Genomics. 2010;11:192. doi: 10.1186/1471-2164-11-192. [DOI] [PMC free article] [PubMed] [Google Scholar]
- 27.Moulager M, et al. Light-dependent regulation of cell division in Ostreococcus: Evidence for a major transcriptional input. Plant Physiol. 2007;144(3):1360–1369. doi: 10.1104/pp.107.096149. [DOI] [PMC free article] [PubMed] [Google Scholar]
- 28.Bouget F-Y, et al. Transcriptional versus non-transcriptional clocks: A case study in Ostreococcus. Mar Genomics. 2014;14:17–22. doi: 10.1016/j.margen.2014.01.004. [DOI] [PubMed] [Google Scholar]
- 29.Corellou F, et al. Clocks in the green lineage: Comparative functional analysis of the circadian architecture of the picoeukaryote ostreococcus. Plant Cell. 2009;21(11):3436–3449. doi: 10.1105/tpc.109.068825. [DOI] [PMC free article] [PubMed] [Google Scholar]
- 30.Lozano JC, et al. Efficient gene targeting and removal of foreign DNA by homologous recombination in the picoeukaryote Ostreococcus. Plant J. 2014;78(6):1073–1083. doi: 10.1111/tpj.12530. [DOI] [PubMed] [Google Scholar]
- 31.Wittig I, Braun H-P, Schägger H. Blue native PAGE. Nat Protoc. 2006;1(1):418–428. doi: 10.1038/nprot.2006.62. [DOI] [PubMed] [Google Scholar]
- 32.Morrissey J, et al. A novel protein, ubiquitous in marine phytoplankton, concentrates iron at the cell surface and facilitates uptake. Curr Biol. 2015;25(3):364–371. doi: 10.1016/j.cub.2014.12.004. [DOI] [PubMed] [Google Scholar]
- 33.Botebol H, et al. Different iron sources to study the physiology and biochemistry of iron metabolism in marine micro-algae. Biometals. 2014;27(1):75–88. doi: 10.1007/s10534-013-9688-1. [DOI] [PMC free article] [PubMed] [Google Scholar]
- 34.Sutak R, et al. A comparative study of iron uptake mechanisms in marine microalgae: Iron binding at the cell surface is a critical step. Plant Physiol. 2012;160(4):2271–2284. doi: 10.1104/pp.112.204156. [DOI] [PMC free article] [PubMed] [Google Scholar]
- 35.Aguirre JD, et al. A manganese-rich environment supports superoxide dismutase activity in a Lyme disease pathogen, Borrelia burgdorferi. J Biol Chem. 2013;288(12):8468–8478. doi: 10.1074/jbc.M112.433540. [DOI] [PMC free article] [PubMed] [Google Scholar]
- 36.Roschzttardtz H, et al. New insights into Fe localization in plant tissues. Front Plant Sci. 2013;4(Sep):350. doi: 10.3389/fpls.2013.00350. [DOI] [PMC free article] [PubMed] [Google Scholar]
- 37.Gledhill M, Buck KN. The organic complexation of iron in the marine environment: A review. Front Microbiol. 2012;3(February):69. doi: 10.3389/fmicb.2012.00069. [DOI] [PMC free article] [PubMed] [Google Scholar]
- 38.Hassler CS, Schoemann V, Nichols CM, Butler ECV, Boyd PW. Saccharides enhance iron bioavailability to Southern Ocean phytoplankton. Proc Natl Acad Sci USA. 2011;108(3):1076–1081. doi: 10.1073/pnas.1010963108. [DOI] [PMC free article] [PubMed] [Google Scholar]
- 39.Long JC, Sommer F, Allen MD, Lu S-F, Merchant SS. FER1 and FER2 encoding two ferritin complexes in Chlamydomonas reinhardtii chloroplasts are regulated by iron. Genetics. 2008;179(1):137–147. doi: 10.1534/genetics.107.083824. [DOI] [PMC free article] [PubMed] [Google Scholar]
- 40.Ravet K, et al. Ferritins control interaction between iron homeostasis and oxidative stress in Arabidopsis. Plant J. 2009;57(3):400–412. doi: 10.1111/j.1365-313X.2008.03698.x. [DOI] [PubMed] [Google Scholar]
- 41.Sunda WG, Price NM, Morel FMM. Algal Culturing Techniques. Elsevier; Amsterdam: 2005. Trace metal ion buffers and their use in culture studies; pp. 35–63. [Google Scholar]
- 42.Fourquez M, et al. Effects of iron limitation on growth and carbon metabolism in oceanic and coastal heterotrophic bacteria. Limnol Oceanogr. 2014;59(2):349–360. [Google Scholar]
- 43.Silva AMN, Kong X, Parkin MC, Cammack R, Hider RC. Iron(III) citrate speciation in aqueous solution. Dalton Trans. 2009;(40):8616–8625. doi: 10.1039/b910970f. [DOI] [PubMed] [Google Scholar]
- 44.Tang D, Morel FMM. Distinguishing between cellular and Fe-oxide-associated trace elements in phytoplankton. Mar Chem. 2006;98(1):18–30. [Google Scholar]
- 45.Abràmoff MD, Magalhães PJ, Ram SJ. Image processing with ImageJ. Biophotonics Int. 2004;11(7):36–42. [Google Scholar]
- 46.Granger J, Price NM. The importance of siderophores in iron nutrition of heterotrophic marine bacteria. Limnol Oceanogr. 1999;44(3):541–555. [Google Scholar]


