

Abstract
Phospholipids having a polyunsaturated acyl chain are abundant in biological membranes, but their behavior in lipid mixtures is difficult to study. Here we elucidate the nature of such mixtures with this report of the first ternary phase diagram containing the polyunsaturated lipid SDPC in mixtures of BSM/SDPC/Chol (brain sphingomyelin/1-stearoyl-2-docosahexaenoyl-sn-glycero-3-phosphocholine/cholesterol). These mixtures show coexisting macroscopic liquid-disordered (Ld) and liquid-ordered (Lo) phase separation, with phase boundaries determined by FRET and by fluorescence microscopy imaging of giant unilamellar vesicles (GUVs). Surprisingly, SDPC mixes with BSM/Chol similarly to how DOPC and POPC mix with BSM/Chol. Notably, intermediate states are produced within the Ld + Lo liquid-liquid immiscibility region upon addition of fourth component POPC. These mixtures of BSM/SDPC/POPC/Chol exhibit nanoscopic Ld + Lo domains over a very large volume of composition space, possibly because Ld/Lo line tension is not high.
Keywords: ternary lipid phase diagram, polyunsaturated lipid, modulated phases, SDPC PUFA lipid, lipid rafts
Graphical abstract
1 Introduction
Eukaryotic plasma membranes comprise a complex chemical mixture of proteins and lipids [1]. These membranes are both protective barriers, and also participate in a variety of cellular processes including signaling, protein sorting, endocytosis, and virus entry and exit. The thermodynamics of mixing provides a powerful framework for describing such complex mixtures.
The mixtures studied here are ternary lipid bilayer mixtures containing cholesterol and exhibiting phase separation. They can be grouped into two categories [2]: Type II diagrams exhibit macroscopic regions of Ld + Lo and Ld + Lβ + Lo immiscibility, with domains resolved under the light microscope. Type I mixtures seem to have the same phase coexistence regions, but with nanoscopic domains [3]. These systems have liquid-liquid immiscibility regions that might resemble phase separation in real cells [4–9] where domains have been proposed to be in the nanoscopic range between 20–200 nm [8, 9]. Nanoscopic domains are detected in vivo in plasma membranes by methods that are sensitive to small length scales, such as Forster resonance energy transfer (FRET) [10, 11], fluorescence recovery after photobleaching (FRAP) [12], electron spin resonance (ESR) [13], and stimulated emission depletion (STED) far-field fluorescence nanoscopy [14]. Nanodomains that have Ld and Lo characteristics have been detected with FRET [10] and ESR [12] in live cells. Thus, there is experimental evidence that lipid raft domains, enriched in cholesterol and sphingolipids, together with non-raft domains, are present in plasma membranes [12, 15–20].
To date, a number of lipid mixture phase diagrams have been solved [21–29], but none of these lipid mixtures have included polyunsaturated lipids, in large part because of the experimental difficulties in working with polyunsaturated fatty acids (PUFAs). In this study we solve the phase diagram of a ternary mixture containing a PUFA-containing lipid together with two other biologically abundant species, BSM/SDPC/Chol. We also discuss overcoming experimental difficulties in with working with PUFAs.
The predominant high-Tm components of the mammalian plasma membrane (PM) are sphingomyelins (SM). We chose to study the natural sphingomyelin derived from porcine brain, BSM. Cholesterol, present at 35–45 mol% in mammalian plasma membranes [30], is an indispensable component of any plasma membrane model mixture. SDPC contains a stearoyl chain and the omega-3 polyunsaturated fatty acyl chain docosahexaenoic acid (DHA), with 22-carbons and 6 double bonds [31, 32].
In the inner leaflet of some animal cell plasma membranes PUFAs comprise up to ~50% of sn-2 fatty acyl chains [http://lipidlibrary.aocs.org/Lipids/complex.html [19]]. In retinal rod outer segment disk membranes DHA comprises ~50% of the total acyl chains, with this high percentage required for optimal rhodopsin function [33, 34]. DHA is also found at high concentrations in certain other membranes, including synaptosomes [35] and sperm [36]. The importance of DHA and PUFAs for human health has been well-studied [37–39]. Spectroscopic, computational, and other biophysical methods [40–54] have established significant PUFA effects on membrane properties. PUFAs seem to have a weaker interaction with cholesterol compared with saturated or monounsaturated acyl chains [55]. A relatively low solubility of cholesterol in PUFA-containing membranes was measured using both X-ray diffraction and solid-state 2H NMR [56–64]. It has been proposed [57, 59] that DHA could be directly involved in inducing lateral phase separations into DHA-rich/cholesterol-poor and DHA-poor/cholesterol-rich lipid domains.
Despite the abundance and importance of DHA-containing lipids such as SDPC, SDPE (1-stearoyl-2-docosahexaenoyl-sn-glycero-3-phosphatidylethanolamine), PDPC (1-palmitoyl-2-docosahexaenoyl-sn-glycero-3-phosphocholine), and PDPE (1-palmitoyl-2-docosahexaenoyl-sn-glycero-3-phosphatidylethanolamine), very few different PUFA-containing lipid compositions have been examined. The vast majority of studies conducted on DHA-containing lipids have focused on only a few sample compositions, most commonly 1/1/1 = DHA-containing lipid/SM/Chol [52, 53, 65]. Here, we show that mixing behavior over all possible compositions of these three-component mixtures, including the key regions of immiscibility, can be described by use of a triangular phase diagram.
Since 1999, GUVs have proven to be useful tools for the visualization of bilayer phases and have been widely used to study phase behavior in model membranes [21–25, 66–68]. However, GUVs have their own characteristic limitations. One such limitation is the relatively low compositional resolution of ~5% that can be achieved with this method (but see [69] for higher compositional precision). Also, GUVs are not useful for finding phase boundaries of mixtures with coexisting domains that are much smaller than the wavelength of light, due to the limits of optical resolution. Other GUV limitations are the potential for electrolysis-induced artifacts associated with the electroswelling method, and oxygen- and free radical-induced artifacts [67, 68]. These particular problems can be mitigated by forming GUVs by use of “gentle hydration” [94]. Cuvette-based spectroscopic methods such as FRET can be used to establish phase boundaries with few artifacts and with the higher compositional resolution of ~2%, but a large number of samples is required. FRET experiments are cuvette-based, enabling sample preparation by use of rapid solvent exchange (RSE), which minimizes potential lipid demixing, especially of cholesterol, that can occur when lipid mixtures are dried [70]. RSE also has the benefit of convenient maintenance of an inert atmosphere at all stages of sample preparation, minimizing oxygen-induced artifacts that are a significant problem in mixtures with PUFA-containing lipids.
Biological membrane phase behavior can be modeled rather well by mixtures of four lipids, enabling study of Ld + Lo domain size from a few nanometers to many microns, controlled by composition. Why do we care about the switch of domain size from nano to macro? The tens of nanometer scale seems to describe the phase-separated domains in animal cell plasma membranes better than does the micron scale [71–73]. Silvius [74] proposed the presence of nanodomains in a lipid bilayer with compositions mimicking the outer leaflet bilayer. Lipids such as SOPC or POPC, having one saturated sn-1 chain and one monounsaturated sn-2 chain, naturally occur as the most abundant phospholipid species in animal cell membranes [19]. Optical microscopy studies on such lipids in ternary mixtures with cholesterol and a high-melting lipid show uniform membranes [21, 75], yet other methods indicate the presence of lateral heterogeneity [27, 75–77] invisible to optical microscopy imaging. We have previously reported the presence of intermediate states that have so-called modulated phase morphology in the 4-component mixture DSPC/DOPC/POPC/Chol [78, 79, 28]. Modulated phase morphology occurs when two liquid phases coexist, if the line tension that drives the minimization of domain perimeter is opposed by a long-range interaction such as bending energy of a curved membrane that acts to break up domains [79, 80].
We report that the phase diagram of BSM/SDPC/Chol at constant temperature is remarkably similar to phase diagrams having DOPC or POPC instead of SDPC. We also report the existence of modulated phases upon the addition of POPC as a fourth component to BSM/SDPC/Chol, finding that with SDPC-containing mixtures, only a small fraction of POPC results in nanodomains, compared to the much larger fractions of POPC required for nanodomains in DOPC-containing mixtures.
2 Materials and Methods
2.1 Materials
Phospholipids were purchased from Avanti Polar Lipids (Alabaster, AL), and cholesterol from Nu Chek Prep (Elysian, MN). Fluorescent dyes C12:0 DiI and BoDIPY-PC were from Invitrogen (Carlsbad, CA), DHE was from Sigma-Aldrich (St. Louis, MO). Lipid stock solutions were prepared in HPLC grade chloroform with lipid concentration determined to better than 1% precision by inorganic phosphate assay [80]. BSM stocks included 0.5% methanol by volume to prevent precipitation during humid weather. Phospholipid purity was verified to be > 99% by thin-layer chromatography (TLC) of ~ 20 micrograms of lipid on washed and activated Adsorbosil TLC plates (Alltech, Deerfield, IL), developed in the solvent system chloroform/methanol/water = 65/25/4. SDPC stocks were frequently checked for purity using a spectroscopic absorbance method (see Section 2.2 for more details). Cholesterol stocks were prepared analytically and purity checked with TLC in petroleum ether/diethyl ether/chloroform = 7/3/3. Probe extinction coefficients were obtained from lot certificates of analysis: 91800 M−1cm−1 at 504 nm for BoDIPY-PC and 12900 M−1cm−1 at 324 nm for DHE. Fluorescent dyes were checked for purity with the following solvent systems: BoDIPY-PC in chloroform/methanol/water = 65/25/4; C12:0 DiI in chloroform/methanol = 10/1. Concentrations of fluorescent dyes were measured by absorption spectroscopy using an HP 8452A spectrophotometer (Hewlett-Packard, Palo Alto, CA).
2.2 Control for PUFA lipid breakdown
PUFA breakdown is readily initiated by free-radical formation and subsequent propagation of a chain-reaction that proceeds auto-catalytically [82–85]. Therefore, it is crucial to eliminate or greatly minimize factors such as oxygen, multivalent cations especially iron, and light, which initiate or propagate this breakdown pathway [82–86]. Our experimental protocol produces less than 2% breakdown after all experimental steps, as measured by TLC and a UV spectroscopic assay for lipid breakdown. All physical handling of lipids is performed in an inert atmosphere under low light conditions. All solvents and buffers that come into contact with SDPC were deoxygenated by bubbling with inert gas to carry away dissolved oxygen. A low oxygen atmosphere was achieved by handling SDPC inside a glove box with O2 levels reduced from the atmospheric reading of 18.2% down to the glove box reading of ~0.02%, as measured by an oxygen sensor (OXY-sen oxygen monitor, Alpha Omega Instruments). Minimization of iron ions was achieved by the addition of 50 μm DTPA, efficient in chelating iron [86], to all aqueous solutions in contact with SDPC. SDPC was purchased from Avanti packaged into small aliquots of 2.5 mg per vial, enabling use of a fresh vial for every week of experimental work. Purity of lipid stocks was checked by TLC and UV spectroscopic assay for lipid breakdown. Samples for UV spectroscopic assay were prepared by extracting aqueous lipid suspensions from GUVs using Bligh-Dyer conditions [87]. A mixture of cyclohexane/EtOH = 10/1 was used to redissolve the dry film for spectroscopy. Lipids without conjugated double bonds have a single strong absorption peak at ~200 nm. Breakdown-induced conjugation yields a strong peak at 235 nm. The ratio of peak heights at 235/200 was used to monitor breakdown.
2.2.1 Control for photooxidation and light-induced phase separation
Oxidation and photooxidation, as well as free radical-induced polymerization, are troublesome phenomena to researchers working with model lipid systems. The final stage of light-induced oxidation and free radical-induced polymerization can look identical to real macroscopic Ld + Lo phase separation and can mislead phase determination by fluorescence microscopy [68, 69, 88]. Light-induced artifacts can happen even in phase-separated mixtures that are inherently nanoscopic. DSPC/POPC/Chol and BSM/POPC/Chol mixtures lack macroscopic Ld + Lo phase separation, yet both mixtures undergo light-induced, artifactual, macroscopic domain separation [68, 69]. Light-induced phase separation happens during illumination with an optical microscope, and is strongly dependent on concentration of dye [69] or photosensitizer [89] and illumination intensity and time. The kinetics of light-induced domain formation vary from system to system, but unlike real macroscopic phase separation, light-induced artifacts are observed to transition through stages of growing, ripening, and final fusing and rounding to produce artifactual light-induced phase separation. See Section S.3. for additional details.
2.3 Terminology
We use the term “trajectory” to mean a series of samples along a specified path of compositions. Trajectories are used to examine the compositional dependence of a measurement such as FRET. We note that the mixtures studied here should be considered pseudo-ternary because we neglect all components of the aqueous buffer. Most important, we neglect water on the basis that its chemical potential is constant at every lipid composition examined because of the presence of excess water. Even so, the water composition of each phase varies over the phase diagram, and we do not measure its fraction in any of the phases. BSM is composed of various species, but for our purposes we count it as a single high-Tm component. Gentle hydration requires use of small fractions of charged lipid, and we used 2% DPPG or 2% POPG (% of total lipid). These small fractions have been shown to have no effect on phase boundaries [90].
Within a tetrahedral phase diagram it is convenient to refer to compositions in terms of the fractional replacement of nanoscopic domain-inducing lipid by macroscopic domain-inducing lipid, which we term “ρ”. Here we define ρ as:
We also define a “ρ window” to be bounded by two ρ values at which 50% of observed morphologies, which can be modulated or macroscopic or uniform, are modulated at each ρ value
2.4 FRET, DHE → BoDIPY-PC
A series of trajectories, each with ~70 samples, was prepared in order to locate the boundaries of the Ld + Lo region. The precise location of boundaries was extracted from the features of the DHE → BoDIPY-PC stimulated acceptor emission data, as described [91–93]. We have prepared 9 trajectories of about 70 samples each to locate the upper Ld+Lo boundary. 5 trajectories were made to locate the boundaries for Lo+Lβ region. The number of trajectories prepared was dependent on the size of the region and we have used similar logic in selecting locations of the trajectories and data analysis as we already described in detail in ref [23, 91–93].
Samples for FRET measurement were prepared by use of rapid solvent exchange (RSE) to minimize cholesterol de-mixing by rapid removal of chloroform under vacuum and replacement by buffer [70, 91]. 250 nmol total lipid per sample along with dyes were dispensed into 13 mm glass tubes with a 25 μL Hamilton syringe attached to a repeating dispenser (Hamilton USA, Reno, NV). Dye concentrations were 1 mol% for DHE and 0.066 mol% for BoDIPY-PC. Deoxygenated RSE buffer (0.500 mL, 200 mM KCl, 5 mM PIPES, 50 μM DTPA, pH 7.0) was added to the chloroform solution of lipids and dyes. Samples were vortexed under gentle vacuum (~670 mTorr) for 1 min, sealed under argon and placed in a water bath at 48 °C. At each sample preparation step, the temperature was chosen to ensure that all lipids were melted and thus well-mixed during formation of vesicles. For BSM-containing mixtures, 48 °C is above the BSM melting range of 35 – 45°C. Samples were cooled at 2 °C/h to 23 °C, then equilibrated at room temperature for 24 h before measurements. 1.90 mL of deoxygenated RSE buffer was added to 0.100 mL of sample to yield 25 μM lipid in the cuvette. Data were collected on a Hitachi F-7000 FL spectrofluorimeter (Hitachi High Technologies America, Schaumburg, IL) at ambient temperature of 23°C, under a gentle stream of argon above the cuvette. Using 2.5 nm bandpass for excitation and emission slits and 10 s integration time, intensity was measured in 4 channels (ex/em): DHE fluorescence (327/393 nm), BoDIPY-PC sensitized emission (327/517 nm), BoDIPY-PC direct fluorescence (500/517 nm), and light scattering (440/430 nm). Control samples were prepared to correct for non-FRET contributions as described previously [28, 91] in order to account for direct fluorescence emission from donor and acceptor, and scattering of excitation light by the vesicle suspension.
2.5 GUV imaging
2.5.1 GUV preparation by gentle hydration
The gentle hydration method for making GUVs was first introduced by Reeves and Dowben [94], and significantly modified by Akashi et al. [95]. We describe below some observations and changes made to this procedure that are specifically relevant for phase behavior studies of lipid mixtures. Negatively-charged lipids provide electrostatic repulsion between bilayers, which facilitates formation of GUVs from the layers of lipid film deposited on the walls of a glass tube. Higher temperature and longer equilibration times were avoided to minimize oxidation and free radical chain reactions that degrade PUFA lipids.
2.5.2 GUV preparation by electroswelling
GUVs were also prepared by a modified electroswelling procedure as described [104–108]. Briefly, each sample contained 250 nmol of lipid mixture in 200 μL chloroform, dispensed in an inert atmosphere glove box. Small fractions of fluorescent dyes C12:0 DiI (0.02 mol%) and naphthopyrene (0.07 mol%) were added. A lipid film was created by evenly spreading the chloroform solution onto indium tin oxide (ITO)-coated microscope slides (Delta Technologies, Stillwater, MN) on a hotplate with surface temperature measured to be ~50 °C. After the residual solvent had been removed under vacuum for 2 h at ~50 mTorr, ITO slides were sealed with Buna-N O-rings to create a chamber, which was then filled with deoxygenated 100 mM sucrose containing 50 μM DTPA. The films were held for 2 h at 50 °C in an AC field of 5 Hz, ± 1 Vpp, using a Wavetek FG2C function generator (Meterman, Everett, WA) followed by 10 h of cooling to 23°C using a Digi-sense temperature controller R/S (Cole Palmer, Vernon Hills, IL). GUVs were harvested into deoxygenated 100 mM glucose solution under inert atmosphere, then allowed to settle for 1 h before microscopy observations at 23 °C.
2.6 Fluorescence microscopy
For all gentle hydration experiments, a Nikon Eclipse Ti microscope (Nikon Instruments, Melville, NY) was used for wide-field fluorescence microscopy at 23 °C, using a 60X 1.2 NA water immersion objective. GUVs prepared by electroswelling sometimes contained naphthopyrene at 0.07 mol% as a dye with preferential Lo phase partitioning. Napthopyrene was not used in samples prepared by gentle hydration in order to minimize light-induced artifacts. Images were taken with an Andor Zyla 5.5-CL3 sCMOS camera (Oxford Instruments, South Windsor, CT). Most GUVs prepared by electroswelling were imaged with a different microscope, a Nikon Diaphot-TMD microscope (Micro Video Instruments Inc., Avon, MA) for wide-field fluorescence microscopy at 23 °C, with a 60X 1.4 NA oil immersion objective. Images were recorded with a Photometrics charge-coupled device camera CoolSNAP HQ2 (Tucson, Arizona). C12:0 DiI fluorescence was imaged with ex/em 546/585 nm, naphthopyrene with 436/480 nm. Images from GUVs containing multiple dyes were color-merged using NIS software, with BoDIPY-PC green, C12:0 DiI red, and naphthopyrene blue. In order to detect coexisting domains in the GUVs shown in this study with our emphasis on reducing light-induced artifacts, very low dye levels together with short exposure times required image contrast to be increased with NIS Elements Basic Research Software (MVI, Inc.).
2.7 Critical point investigation and percolation map
The critical point of the Ld + Lo region was found by determining the continuous, “percolating” phase as a function of composition to obtain a “percolation map”. Percolation map refers to a set of marked compositions within an area of the phase diagram to discover at which compositions a changeover occurs from Lo being continuous to Ld being continuous (Fig. 2). The Ld + Lo percolation map near the critical point was examined by analyzing ~50–100 GUVs at each composition. The locus of compositions where connectivity in GUVs changes between Ld and Lo was extrapolated to its intersection with the Ld + Lo upper phase boundary, thereby marking the critical point [28]. We note that for compositions in the middle region of the tieline, where the area fractions of Lo and Ld phases are close to equal, the majority of GUVs displayed a single round Ld (or Lo) domain. This is an indication that the samples were well equilibrated, without multiple small kinetically trapped domains. We found that the percolation changeover point occurs where the area fraction of Ld is roughly equal to that of Lo.
Figure 2.

GUV compositions examined by gentle hydration, including a percolation threshold study. Boundaries for the Ld + Lo region are shown for reference. Filled black circles show GUVs having Ld + Lo phase coexistence with Lo as the percolating phase; grey circles mark Ld as the percolating (continuous) phase; open circles mark uniform GUVs within a one phase region; half black/white circles, show GUVs exhibiting both types of connectivity. The critical point is marked by a star at BSM/SDPC/Chol = 0.28/0.39/0.33. Ld + Lo + Lβ compositions are marked by triangles and Ld + Lβ marked as squares.
3 Results
3.1 FRET, DHE → BoDIPY-PC
We make use of changes in FRET as donor and acceptor dyes partition between coexisting phases. When dyes concentrate within the same phase, their average separation decreases, resulting in a compositional region of enhanced efficiency (REE) of FRET. When dyes prefer different phases, the increase in average dye separation leads to a region of reduced efficiency (RRE) of FRET. Here we used the donor/acceptor FRET dye pair DHE/BoDIPY-PC, which partition into Lo and Ld phase, respectively, to generate RREs where Ld and Lo phases coexist. Fig. 1 shows representative FRET trajectories prepared to locate boundaries. Trajectories T1 and T2 were used to locate the boundaries of the coexistence region Ld + Lo (Fig. 1A–C). T1 shows the appearance of Lo at χCHOL ~ 0.08, χBSM ~ 0.22 (LHS), and the appearance of Ld at χCHOL ~ 0.32, χBSM ~ 0.62 (RHS). T2 shows appearance of Lo at χCHOL ~ 0.12, χBSM ~ 0.17 (LHS), and appearance of Ld at χCHOL ~ 0.35, χBSM ~ 0.55 (RHS).
Figure 1.

FRET trajectories T1 and T2 determine Ld + Lo phase boundaries with accuracy. The phase boundary is the locus of points on the phase diagram that marks the compositions that define a phase region, where one-phase regions are bounded by two-phase regions and where two-phase regions are bounded by one-phase or three-phase regions. (A) T1 and T2 are shown as dotted lines. Phase boundaries are shown in grey for reference. T1 endpoint compositions 0.11 ≤ χBSM ≤ 0.65 and 0 ≤ χCHOL ≤ 0.35; T2 endpoint compositions 0 ≤ χBSM ≤ 0.6 and 0.03 ≤ χCHOL ≤ 0.4. DHE, Bodipy-PC and C12:0 DiI were 1 mol%, 0.066 mol% and 0.05 mol% respectively. (B) FRET along T1 with the 2-dye pair DHE→ BoDIPY-PC to locate boundaries; (C) FRET along T2 using 2-dye pair DHE→ BoDIPY PC to locate boundaries.
3.2 Microscopy imaging on GUVs
3.2.1 Phases observed on GUVs
BSM/SDPC/Chol shows macroscopic phase coexistence in three regions, Ld + Lo, Ld + Lo + Lβ, and Ld + Lβ. Fig. 2 shows upper Ld + Lo boundaries determined by the gentle hydration method. Fig. S4 shows representative GUV images used to determine the LHS boundary of the Ld + Lβ region.
3.2.2 Upper boundary determination
The upper BSM/SDPC/Chol boundary terminates at a maximum χCHOL ~ 0.37, as determined by GUV imaging (Fig. 2) and FRET experiments using the donor/acceptor pair DHE/BoDIPY-PC (data not shown). This maximum cholesterol fraction is slightly lower than the χCHOL ~ 0.40 found for POPC- or DOPC-containing mixtures at 25°C, and reflects the slight but unexpectedly higher miscibility of cholesterol with SDPC.
3.4.2.3 Region of modulated phase domains
Fig. 3 shows 5 compositions examined in this modulated ρ window study of BSM/SDPC/POPC/Chol. Points (a–c) in Fig. 3) are on a tieline at lower χCHOL values and points (e–d) are on a tieline at higher χCHOL values. We define the ρ window as bounded by two ρ values at which 50% of observed morphologies are modulated. For a tieline located just above the three-phase coexistence region, points a–c, modulated phases were observed over the range 0.75 < ρ < 0.90 (point a: Fig. S5, top panel a); and over the range 0.64 < ρ < 0.90 (points b and c: Fig. 3, panels b and c). At a higher cholesterol tieline, where the compositions of the coexisting phases are closer and phase properties likely to be more similar, a very similar modulated phase window of 0.68 < ρ < 0.84 was observed (Fig, S5, panels d and e). Thin Ld stripes with Lo being the percolating phase were prevalent in compositions towards higher Lo fractions, points (c) and (d), consistent with the Lever Rule and previous observations in DSPC-containing mixtures [80].
Figure 3.

Modulated phase patterns are observed. Phase diagram on the left shows compositions examined for BSM/(SDPC+POPC)/Chol: 0.39/0.39/0.22 (a); 0.44/0.30/0.26 (b); 0.50/0.20/0.30 (c); 0.41/0.26/0.33 (d); 0.35/0.35/0.30 (e). Right set of images shows progression of morphologies from uniform to modulated to round macroscopic domains for composition c. Images were contrast and brightness enhanced. GUVs appeared uniform before the onset of modulated phases at ρ ~ 0.64, and showed macroscopic round domains at ρ > 0.90. The graph shows % of modulated morphologies at each ρvalue for point c. Composite GUV images were obtained by combining slices along a z stack series. At each composition ρ slices share common Chol and BSM endpoints, with varying ρ. 12:0- DiI at 0.011 mol% partitions into Ld. Temperature 23 °C. Scale bar 10 microns.
3.2.4 Critical point investigation and percolation map
The critical point was experimentally found by determining the continuous or “percolating” phase as a function of composition to obtain a percolation map (Fig. 2). The critical point is at BSM/SDPC/Chol = 0.28/0.39/0.33 (Fig. 2), where Ld phase becomes indistinguishable from Lo phase. With GUV imaging, large domain fluctuations were observed for compositions near this critical point.
4 Discussion
4.1 Description of ternary phase diagram
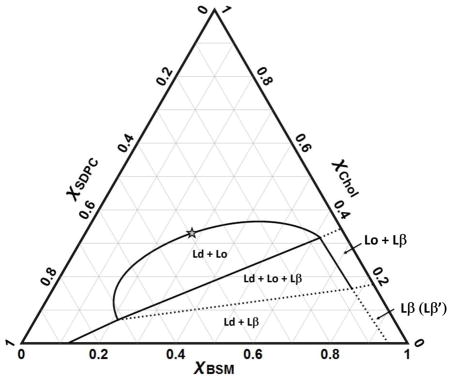
Fig. 4 shows the BSM/SDPC/Chol phase diagram, with boundaries obtained by combining FRET trajectories and imaging of GUVs made by gentle hydration. We describe below the individual phase regions.
Figure 4.

Phase diagram of BSM/SDPC/Chol obtained by FRET and by microscopy imaging on GUVs made by the gentle hydration method, all at 23 °C. Solid lines show measured phase boundaries, dashed lines boundaries that are putative or extrapolated. No measurements were made to determine any phase boundaries above χCHOL = 0.5.
BSM/SDPC/Chol is a Type II diagram, with three regions of macroscopic phase separation: Ld + Lo, Ld + Lo + Lβ, and Ld + Lβ.
4.2 Phase regions
4.2.1 Liquid + gel coexistence, Ld + Lβ(β′)
The upper boundary of the Ld + Lβ(β′) region is a line that is also the lower boundary of the 3-phase coexistence region Ld + Lo + Lβ. The LHS boundary at χCHOL = 0 of this region indicates the maximum solubility of BSM in SDPC-rich Ld to be χBSM = 0.12. The RHS boundary of Ld + Lβ(β′) is approximated by extrapolating the measured RHS of the Ld + Lo + Lβ region to χCHOL = 0, and shows that SDPC is rather insoluble in the BSM-rich Lβ′ phase, with χSDPC ~ 0.05 without cholesterol, similar to the boundary reported by Petruzielo et al for BSM/DOPC. The maximum solubility of cholesterol in the BSM-rich Lβ phase is at χCHOL ~ 0.16. This maximum cholesterol solubility in Lβ is the same as that for the similar mixtures BSM/DOPC/Chol and BSM/POPC/Chol [30], as well as for other mixtures of DSPC/DOPC/Chol, DSPC/POPC/Chol [28], and DPPC/DLPC/Chol [96]. Note that χCHOL ~ 0.16 corresponds closely to each cholesterol being surrounded by a single shell of 6 phospholipid neighbors, with the clear implication that this solid phase cannot accommodate any higher fraction of cholesterol.
4.2.2 Gel [Lβ(Lβ′)]
The pure hydrated lipid BSM at room temperature is a solid with tilted chains, Lβ′, as found for DPPC. Addition of cholesterol causes the chain tilt to disappear but without the formation of a coexisting phase [97]. This gel region Lβ(Lβ′) is bounded at χSDPC = ~0.05, χCHOL ~ 0.17.
4.5.2.3 Liquid-ordered + gel coexistence, Lo + Lβ
These boundaries were chosen to be in agreement with Schreinemakers’ Rules [98], and so are only estimates. This almost rectangular region has one edge along the BSM/Chol binary axis from χCHOL ~ 0.17 – 0.34. Along this axis, we found in an earlier study that Lβ transitions to Lo with increasing cholesterol fraction as a continuous phase change [97].
5.2.4 3-phase coexistence, Ld + Lo+ Lβ
GUV data and FRET data for trajectory T1 (Fig. 1A and 1B) were used to determine the LHS and RHS boundaries of this region. We started from the previously determined phase diagram for BSM/DOPC/Chol to guide the choice of trajectory T1, which shows the appearance of Lo at the point χCHOL ~ 0.08, χBSM ~ 0.22, and the appearance of Ld at χCHOL ~ 0.32, χBSM ~ 0.62 for the RHS (Fig. 3B). The solubility of BSM in Ld mixtures with SDPC/Chol, POPC/Chol and DOPC/Chol is essentially the same, and that is also the case for the Lo mixtures: the upper and lower boundaries of the three phase region are nearly independent of the type of low-Tm lipid. The upper and lower boundaries of the Ld + Lo+ Lβ region are useful because they are thermodynamic tielines. The BSM/DOPC/Chol tieline reported previously by Petruzielo et al is essentially identical to that for the stearoyl-SM mixture SSM/DOPC/Chol studied by Farkas and Webb, who used both polarization imaging of GUVs and mass spectrometry on phase patches excised from GUVs [99].
4.2.5 Liquid–liquid coexistence, Ld + Lo
Contrary to published reports, we find that SDPC mixes about as well with BSM and Chol as do DOPC and POPC (although we have not examined compositions having χCHOL > 0.5). Note that these observations involve comparison with both macroscopic mixtures BSM/DOPC/Chol and nanoscopic mixtures BSM/POPC/Chol. The upper BSM/SDPC/Chol boundary has a maximum χCHOL ~ 0.37, found from GUV imaging (Fig. 2) and from FRET experiments using the donor/acceptor pair DHE/BoDIPY-PC (data not shown). Similarly, the upper Ld + Lo boundary in BSM systems for both DOPC and POPC mixtures terminates at χCHOL ~ 0.40 at 25 °C [30]. Thus we observe that SDPC has similar miscibility gaps in mixtures with cholesterol and BSM, compared to mixtures with DOPC or POPC with BSM and cholesterol. As discussed in the Introduction, many previous studies indicated poor mixing of DHA-containing lipids with Chol. Thus, we expected to see a larger region of immiscibility in the BSM/SDPC/Chol system. A recent study [66] shows that the solubility of a DHA-containing lipid in mixtures with SM/Chol depended on whether the glycerophospholipid was PC or PE. Solid state 2HNMR studies on PSM/PDPE-d31/Chol = 1/1/1 showed that PE with a DHA chain separates from regions enriched in PSM and cholesterol [66]. In contrast, 2HNMR spectra for PSM/PDPC-d31/Chol = 1/1/1 showed that PC with a DHA chain is more miscible in PSM-rich/sterol-rich domains.
4.3 Region of modulated phase domains
The size and the morphology of phase domains can be controlled by the composition and type of low-Tm lipid in mixtures with cholesterol and high-Tm lipids such as DSPC, SM or DPPC. There are 3 regimes of different morphology within the Ld + Lo liquid-liquid coexistence region of GUVs: uniform (nanoscopic), modulated, and macroscopic domains. The first experiments to address morphology changes in the Ld + Lo region examined a trajectory joining two ternary systems in the Ld + Lo regions of DSPC/DOPC/Chol and DSPC/POPC/Chol [79, 80]. Spatially modulated domain features were obtained for sample compositions in the range 0.15 < ρ < 0.35, whereas for ρ > 0.35, large round, macroscopic domains were observed [79, 80]. When line tension dominates over other interactions that depend on domain size, coexisting liquid phases round up into large circular domains to minimize their perimeter. This simple morphology can be modulated when interactions of sufficient magnitude compete with line tension, so that patterns appear—a maze of stripes, tiny round domains, curved lines, and branched lines [81]
In BSM/SDPC/POPC/Chol we observed ρ windows of 0.65 < ρ < 0.90 for the five compositions examined (Fig. S5 and Section S.4), which means a much higher fraction of SDPC than the fraction of DOPC in the previously described systems [79, 80]. In other words, to create modulated phases, a much higher fraction of the mixture needs to be the macroscopic-inducing SDPC, compared with other macroscopic-inducing lipids such as DOPC or DiPhyt-PC. With DSPC/DOPC/POPC/Chol, only ~15% replacement of POPC by DOPC is needed to detect modulated morphology, and with 30% replacement DOPC macroscopic phases are predominant. In this current study we find that a much higher ~70% replacement of POPC by SDPC is needed to induce modulated phases, with macroscopic morphology becoming predominant only at ~95% SDPC. These observations have implications for cell membranes, pointing to significant differences in compositional regimes where cells could abruptly change size and connectivity of membrane domains depending on the nature of the low melting lipids.
4.4 Critical point investigation
Locating the critical point can be useful [100–102]. Both Type II and Type I phase diagrams have the same form: a central three phase region joining three two phase regions. For both types of phase diagrams, the Ld + Lo region terminates in a critical point. In this study we show the location of the critical point to be at BSM/SDPC/Chol = 0.28/0.39/0.33, quite similar to the critical point found in related mixtures [28–30, 99]. In other studies, micropipette aspiration of GUVs was used to measure composition-dependent trends in line tension within the Ld + Lo region of eSM/DOPC/Chol, showing a critical point near 0.26/0.34/0.40 [103]. It might be important to know the location of a critical point in cell plasma membranes because line tension must approach zero near a critical point and domain fluctuations are large. This has been demonstrated experimentally in ternary systems both by varying temperature at a fixed composition toward an upper miscibility critical point [100], and by varying composition at fixed temperature toward a consolute point [103].
4.5 Comparison of boundaries obtained by electroswelling and by gentle hydration
We began studies of the BSM/SDPC/Chol mixture by preparing GUVs using the method of electroswelling. However, we learned that GUVs made by electroswelling showed macroscopic phase separation for Ld + Lo, Ld + Lo + Lβ, and Ld + Lβ phase regions, consistent with GUVs made by gentle hydration, except that the boundaries are artifactually expanded. Note that the RHS of the Ld + Lo coexistence region cannot be well determined by GUV imaging due to the difficulty of preparing GUVs with a high mole fraction of BSM, as shown in Fig. 5.
Figure 5.

Electroswelling produces artifactual domains, yielding “expanded” boundaries for Ld + Lo in BSM/SDPC/Chol. Thick black lines indicate boundaries obtained by electroswelling. Lighter boundaries obtained by FRET and gentle hydration (from Figure 2) are shown for comparison. Open circles mark where uniform GUVs appear; green closed circles mark macroscopic Ld + Lo; blue triangles mark compositions within Ld + Lo + Lβ; and purple squares show Ld + Lβ compositions. Red stars indicate where critical fluctuations are observed for electroswelled GUVs.
Fig. 5 superimposes boundary compositions obtained by electroswelling (heavy dark lines) over the phase boundaries obtained by FRET and GUVs made by gentle hydration (lighter lines). Electroswelling significantly expands the miscibility gap. Note that regions of liquid-liquid coexistence (Ld + Lo and Ld + Lo + Lβ) are the ones susceptible the most to this artifactual expansion. In contrast, the Ld + Lβ boundaries are more in agreement with those from gentle hydration and FRET data, however this region still shows expanded LHS boundaries.
Supplementary Material
Highlights.
We determined the first phase diagram (BSM/SDPC/Chol) that models an animal cell plasma membrane and includes a PUFA-containing lipid, SDPC.
The phase diagram is a Type II mixture, that is, having three macroscopic phase separation regions Ld + Lo; Ld + Lo + Lβ; and Ld + Lβ.
Compared to phase diagrams of BSM/cholesterol with either DOPC or with POPC, BSM/SDPC/Chol shows very similar regions of immiscibility. This was an unexpected result, as it is often thought that PUFA-containing lipids mix especially poorly with BSM/Chol domains.
SDPC is a naturally abundant lipid that yields macroscopic domains in mixtures with BSM and Chol. However, it requires only a small fraction of POPC, ~30 mole%, to yield nanoscopic Ld + Lo domains.
Precautions of reduced oxygen levels, low light exposure, and avoidance of electrolysis artifacts during sample preparations with SDPC by use of gentle hydration and RSE were necessary to avoid PUFA breakdown.
Acknowledgments
This work was supported in part by funding from the U.S. National Science Foundation (MCB-1410926) and the U.S. National Institutes of Health (GM105684) to G.W.F. T.M.K. was also supported by NIH Training Grant 1-T32-GM08267.
Abbreviations
- BSM
sphingomyelin derived from porcine brain
- SM
sphingomyelin
- PC
phosphatidylcholine
- SDPC
1-stearoyl-2-docosahexaenoyl-sn-glycero-3-phosphocholine
- DSPC
1,2-distearoyl-sn-glycero-3-phosphocholine
- Chol
cholesterol
- Ld
liquid-disordered phase
- Lo
liquid-ordered phase
- DOPC
1,2-dioleoyl-sn-glycero-3-phosphocholine
- POPC
1-palmitoyl-2-oleoyl-sn-glycero-3-phosphocholine
- SOPC
1-stearoyl-2-oleoyl-sn-glycero-3-phosphocholine
- FRET
Förster resonance energy transfer
- DHE
ergosta-5,7,9(11),22-tetraen-3β-ol
- C12
0 DiI, 1,1′-didodecyl-3,3,3′,3′-tetramethylindocarbocyanine perchlorate
- BoDIPY-PC
2-(4,4-difluoro-5,7-dimethyl-4-bora-3a,4a-diaza-s-indacene-3-pentanoyl)-1-hexadecanoyl-sn-glycero-3-phosphocholine
- C20
0-DiI, 1,1′-dieicosanyl-3,3,3′,3′-tetramethylindocarbocyanine perchlorate
- TOE
Trp-Oleoyl Ester, N-oleoyl-dl-tryptophan ethyl ester
- TLC
thin-layer chromatography
- GUV
giant unilamellar vesicle
- RSE
rapid solvent exchange
- SAE
sensitized acceptor emission
- RRE
region of reduced efficiency
- REE
region of enhanced efficiency
- RHS
right hand side, refers to right side of phase diagram, i.e. at higher χBSM
- LHS
left hand side, refers to left side of phase diagram, i.e. at lower χBSM
- T1-T2
trajectories 1–2
Footnotes
Publisher's Disclaimer: This is a PDF file of an unedited manuscript that has been accepted for publication. As a service to our customers we are providing this early version of the manuscript. The manuscript will undergo copyediting, typesetting, and review of the resulting proof before it is published in its final citable form. Please note that during the production process errors may be discovered which could affect the content, and all legal disclaimers that apply to the journal pertain.
References
- 1.van Meer G. Cellular lipidomics. EMBO J. 2005;24:3159–3165. doi: 10.1038/sj.emboj.7600798. [DOI] [PMC free article] [PubMed] [Google Scholar]
- 2.Phillips MC, Ladbrooke BD, Chapman D. Molecular interactions in mixed lecithin systems. Biochim Biophys Acta. 1970;196:35–44. doi: 10.1016/0005-2736(70)90163-x. [DOI] [PubMed] [Google Scholar]
- 3.Shimshick EJ, McConnell HM. Lateral Phase Separation in Phospholipid Membranes. Biochem. 1973;12:2351–2360. doi: 10.1021/bi00736a026. [DOI] [PubMed] [Google Scholar]
- 4.Hancock JF. Lipid rafts: contentious only from simplistic standpoints. Nat Rev Mol Cell Biol. 2006;7:456–462. doi: 10.1038/nrm1925. [DOI] [PMC free article] [PubMed] [Google Scholar]
- 5.Almeida PFF, Pokorny A, Hinderliter A. Thermodynamics of membrane domains. Biochim Biophys Acta. 2005;1720:1–13. doi: 10.1016/j.bbamem.2005.12.004. [DOI] [PubMed] [Google Scholar]
- 6.Hancock JF. Lipid rafts: contentious only from simplistic standpoints. Nat Rev Mol Cell Biol. 2006;7:456–462. doi: 10.1038/nrm1925. [DOI] [PMC free article] [PubMed] [Google Scholar]
- 7.Almeida PFF, Pokorny A, Hinderliter A. Thermodynamics of membrane domains. Biochim Biophysa Acta. 2005;1720:1–13. doi: 10.1016/j.bbamem.2005.12.004. [DOI] [PubMed] [Google Scholar]
- 8.Elson EL, Fried E, Dolbrow JE, Genin GM. Phase Separation in Biological Membranes: Integration of Theory and Experiment. Ann Rev Biophys. 2010;39:207–226. doi: 10.1146/annurev.biophys.093008.131238. [DOI] [PMC free article] [PubMed] [Google Scholar]
- 9.Lingwood D, Simons K. Lipid Rafts as a Membrane-Organizing Principle. Science. 2010;327:46–50. doi: 10.1126/science.1174621. [DOI] [PubMed] [Google Scholar]
- 10.Sengupta P, Holowka D, Baird BB. Fluorescence resonance energy transfer between lipid probes detects nanoscopic heterogeneity in the plasma membrane of live cells. Biophys J. 2007;92:3564–3574. doi: 10.1529/biophysj.106.094730. [DOI] [PMC free article] [PubMed] [Google Scholar]
- 11.Sharma P, Varma R, Mayor S. Nanoscale organization of multiple GPI-anchored proteins in living cell membranes. Cell. 2004;116:577–589. doi: 10.1016/s0092-8674(04)00167-9. [DOI] [PubMed] [Google Scholar]
- 12.Meder D, Moreno MJ, Verkade P, Vaz WL, Simons K. Phase coexistence and connectivity in the apical membrane of polarized epithelial cells. PNAS. 2006;103:329–334. doi: 10.1073/pnas.0509885103. [DOI] [PMC free article] [PubMed] [Google Scholar]
- 13.Swamy MJ, Ciani L, Ge M, Smith AK, Holowka D, Baird B, Freed JH. Biophys J. 2006;90:4452–65. doi: 10.1529/biophysj.105.070839. [DOI] [PMC free article] [PubMed] [Google Scholar]
- 14.Eggeling C, Ringemann C, Hell SW. Direct observation of the nanoscale dynamics of membrane lipids in a living cell. Nature. 2009;457:1159–1162. doi: 10.1038/nature07596. [DOI] [PubMed] [Google Scholar]
- 15.Simons K, Ikonen E. Functional rafts in cell membranes. Nature. 1997;387:569–572. doi: 10.1038/42408. [DOI] [PubMed] [Google Scholar]
- 16.Simons K, Ehehalt R. Cholesterol, lipid rafts, and diseases. JClin Invest. 2002;110:597–603. doi: 10.1172/JCI16390. [DOI] [PMC free article] [PubMed] [Google Scholar]
- 17.Simons K, Ikonen E. Protein and lipid sorting from the trans-Golgi network to the plasma membrane in polarized cells. Cell and Develop Biol. 1998;9:503–509. doi: 10.1006/scdb.1998.0258. [DOI] [PubMed] [Google Scholar]
- 18.Simons K, Vaz WLC. Model systems, Lipid Rafts, and Cell Membranes. Biophys Biomol Struct. 2004;33:269–295. doi: 10.1146/annurev.biophys.32.110601.141803. [DOI] [PubMed] [Google Scholar]
- 19.http://lipidlibrary.aocs.org/Lipids/complex.html
- 20.Simmons K, Lingwood D. Lipid Rafts as a Membrane-Organizing Principle. Science. 2010;327:46–50. doi: 10.1126/science.1174621. [DOI] [PubMed] [Google Scholar]
- 21.Zhao J, Wu J, Heberle FA, Mills TT, Klawitter P, Huang G, Costanza G, Feigenson GW. Phase studies of model biomembranes: complex behavior of DSPC/DOPC/Cholesterol. Biochim Biophys Acta - Biomembranes. 2007;1768:2764–2776. doi: 10.1016/j.bbamem.2007.07.008. [DOI] [PMC free article] [PubMed] [Google Scholar]
- 22.Veatch SL, Keller SL. Miscibility phase diagrams of giant vesicles containing sphingomyelin. Phys Rev Lett. 2005;94:148101. doi: 10.1103/PhysRevLett.94.148101. [DOI] [PubMed] [Google Scholar]
- 23.Veatch SL, Keller SL. Seeing spots: complex phase behavior in simple mixtures. Biochim Biophys Acta. 2005;1746:172–185. doi: 10.1016/j.bbamcr.2005.06.010. [DOI] [PubMed] [Google Scholar]
- 24.Veatch SL, Gawrisch K, Keller SL. Closed-loop miscibility gap and quantitative tie-lines in ternary membranes containing diphytanoyl PC. Biophys J. 2006;90:4428–4436. doi: 10.1529/biophysj.105.080283. [DOI] [PMC free article] [PubMed] [Google Scholar]
- 25.Feigenson GW, Buboltz JT. Ternary Phase Diagram of Dipalmitoyl-PC/Dilauroyl-PC/Cholesterol: Nanoscopic Domain Formation Driven by Cholesterol. Biophys J. 2001;80:2775–2788. doi: 10.1016/S0006-3495(01)76245-5. [DOI] [PMC free article] [PubMed] [Google Scholar]
- 26.Goni FM, Alonso A. Biochim Biophys Acta. 2009;1788:169–177. doi: 10.1016/j.bbamem.2008.09.002. [DOI] [PubMed] [Google Scholar]
- 27.Heberle FA, Wu J, Goh SL, Petruzielo R, Feigenson GW. Comparison of Three Ternary Lipid Bilayer Mixtures: FRET and ESR Reveal Nanodomains. Biophys J. 2010;99:3309–3318. doi: 10.1016/j.bpj.2010.09.064. [DOI] [PMC free article] [PubMed] [Google Scholar]
- 28.Konyakhina TM, Wu J, Mastroianni JD, Heberle FA, Feigenson GW. Phase diagram of a 4-component lipid mixture: DSPC/DOPC/POPC/chol. Biochim Biophys Acta. 2013;1828(9):2204–14. doi: 10.1016/j.bbamem.2013.05.020. [DOI] [PMC free article] [PubMed] [Google Scholar]
- 29.Petruzielo RS, Heberle FA, Drazba P, Katsaras J, Feigenson GW. Phase Behavior and Domain Size in Sphingomyelin-Containing Lipid Bilayers. Biochim Biophys Acta. 2013;1828:1302–1313. doi: 10.1016/j.bbamem.2013.01.007. [DOI] [PMC free article] [PubMed] [Google Scholar]
- 30.Yeagle P. The Membranes of Cells. 2. 1993. [Google Scholar]
- 31.Saiz L, Klein ML. Influence of Highly Polyunsaturated Lipid Acyl Chains of Biomembranes on the NMR Order Parameters. J Am Chem Soc. 2001;123:7381–7387. doi: 10.1021/ja003987d. [DOI] [PubMed] [Google Scholar]
- 32.Jump DB. The biochemistry of n-3 polyunsaturated fatty acids. J Biol Chem. 2002;277:8755–8758. doi: 10.1074/jbc.R100062200. [DOI] [PubMed] [Google Scholar]
- 33.Wiegand RD, Anderson RE. Phospholipid molecular species of frog rod outer segment membranes. Exp Eye Res. 1983;37:159–173. doi: 10.1016/0014-4835(83)90075-1. [DOI] [PubMed] [Google Scholar]
- 34.Mitchell DC, Litman BJ. Effect of cholesterol on molecular order and dynamics in highly polyunsaturated phospholipid bilayers. Biophys J. 1998;75:896–908. doi: 10.1016/S0006-3495(98)77578-2. [DOI] [PMC free article] [PubMed] [Google Scholar]
- 35.Breckenridge WC, Gombos G, Morgan LG. The lipid composition of adult rat brain synaptosomal membranes. Biochim Biophys Acta. 1972;266:695–707. doi: 10.1016/0006-3002(72)90012-1. [DOI] [PubMed] [Google Scholar]
- 36.Neill AR, Masters CJ. Metabolism of fatty acids by bovine spermatozoa. J ReprodFertil. 1973;34:279–287. doi: 10.1530/jrf.0.0340279. [DOI] [PubMed] [Google Scholar]
- 37.Stillwell W, Wassall SR. Docosahexaenoic acid: membrane properties of a unique fatty acid. Chem Phys Lipids. 2003;126:1–27. doi: 10.1016/s0009-3084(03)00101-4. [DOI] [PubMed] [Google Scholar]
- 38.Wassall SR, Stillwell W. Docosahexaenoic acid domains: the ultimate non-raft membrane domain. Chem Phys Lipids. 2008;153:57–63. doi: 10.1016/j.chemphyslip.2008.02.010. [DOI] [PubMed] [Google Scholar]
- 39.Wassall SR, Stillwell W. Polyunsaturated fatty acid-cholesterol interactions: domain formation in membranes. Biochim Biophys Acta. 2009;1788:24–32. doi: 10.1016/j.bbamem.2008.10.011. [DOI] [PubMed] [Google Scholar]
- 40.Litman BJ, Lewis EN, Levin IW. Packing characteristics of highly unsaturated bilayer lipids: Raman spectroscopic studies of multilamellar phosphatidylcholine dispersions. Biochem. 1991;30:313–319. doi: 10.1021/bi00216a001. [DOI] [PubMed] [Google Scholar]
- 41.Paddy MR, Dahlquist FW, Dratz EA, Deese AJ. Simultaneous observation of order and dynamics at several defined positions in single acyl chain using 2H NMR of single acyl chain perdeuterated phosphatidylcholines. Biochem. 1985;24:5988–5995. doi: 10.1021/bi00342a045. [DOI] [PubMed] [Google Scholar]
- 42.Salmon A, Dodd SW, Williams GD, Beach JM, Brown MF. Configurational statistics of acyl chains in polyunsaturated lipid bilayers from 2H NMR. J Am Chem Soc. 1987;109:2600–2609. [Google Scholar]
- 43.Everts S, Davis JH. 1H and 13C nuclear magnetic resonance of multilamellar dispersions of polyunsaturated (12:6) phospholipids. Biophys J. 2000;79:885–897. doi: 10.1016/S0006-3495(00)76344-2. [DOI] [PMC free article] [PubMed] [Google Scholar]
- 44.Binder H, Gawrisch K. Dehydration induces lateral expansion of polyunsaturated 18:0–22:6 phosphatidylcholine in a new lamellar phase. Biophys J. 2001;81(2):969–82. doi: 10.1016/S0006-3495(01)75755-4. [DOI] [PMC free article] [PubMed] [Google Scholar]
- 45.Separovic F, Gawrisch K. Effect of unsaturation on the chain order of phosphatidylcholines in a dioleylphosphatidylethanolamine matrix. Biophys J. 1996;71:274–282. doi: 10.1016/S0006-3495(96)79223-8. [DOI] [PMC free article] [PubMed] [Google Scholar]
- 46.Huster D, Paasche G, Dietrich U, Zschörnig O, Gutberlet T, Gawrisch K, Arnold K. Investigation of phospholipid area compression induced by calcium-mediated dextran sulfate interaction. Biophys J. 1999;77:879–887. doi: 10.1016/S0006-3495(99)76939-0. [DOI] [PMC free article] [PubMed] [Google Scholar]
- 47.Koenig BW, Strey HH, Gawrisch K. Membrane lateral compressibility measured by NMR and x-ray diffraction. Biophys J. 1997;73:1954–1966. doi: 10.1016/S0006-3495(97)78226-2. [DOI] [PMC free article] [PubMed] [Google Scholar]
- 48.Rawicz W, Olbrich KC, McIntosh T, Needham D, Evans E. Effect of chain length and unsaturation on elasticity of lipid bilayers. Biophys J. 2000;79:328–339. doi: 10.1016/S0006-3495(00)76295-3. [DOI] [PMC free article] [PubMed] [Google Scholar]
- 49.Huster D, Arnold K, Gawrisch K. Influence of docosahexaenoic acid and cholesterol on lateral lipid organization in phospholipid mixtures. Biochem. 1998;37:17299–17308. doi: 10.1021/bi980078g. [DOI] [PubMed] [Google Scholar]
- 50.Olbrich K, Rawicz W, Needham D, Evans E. Water permeability and mechanical strength of polyunsaturated lipid bilayers. Biophys J. 2000;79:321–327. doi: 10.1016/S0006-3495(00)76294-1. [DOI] [PMC free article] [PubMed] [Google Scholar]
- 51.Shaikh SR, Cherezov V, Caffrey M, Soni SP, LoCascio D, Stillwell W, Wassall SR. Molecular organization of cholesterol in unsaturated phosphatidylethanolamines: X-ray diffraction and solid state 2H NMR reveal differences with phosphatidylcholines. J Am Chem Soc. 2006;128:5375–83. doi: 10.1021/ja057949b. [DOI] [PubMed] [Google Scholar]
- 52.Shaikh SR, Dumaual AC, Castillo A, LoCascio D, Siddiqui RA, Stillwell W, Wassall SR. Oleic and docosahexaenoic acid differentially phase separate from lipid raft molecules: a comparative NMR, DSC, AFM, and detergent extraction study. Biophys J. 2004;87:1752–66. doi: 10.1529/biophysj.104.044552. [DOI] [PMC free article] [PubMed] [Google Scholar]
- 53.Soni SP, LoCascio DS, Liu Y, Williams JA, Bittman R, Stillwell W, Wassall SR. Docosahexaenoic acid enhances segregation of lipids between: 2H-NMR study. Biophys J. 2008;95(1):203–14. doi: 10.1529/biophysj.107.123612. [DOI] [PMC free article] [PubMed] [Google Scholar]
- 54.Koubi L, Saiz L, Tarek M, Scharf D, Klein ML. Influence of Anesthetic and Nonimmobilizer Molecules on the Physical Properties of a Polyunsaturated Lipid Bilayer. J Phys Chem B. 2003;107:14500–14508. [Google Scholar]
- 55.Kucerka N, Marquardt D, Harroun TA, Nieh MP, Wassall SR, de Jong DH, Schäfer LV, Marrink SJ, Katsaras J. Cholesterol in bilayers with PUFA chains: doping with DMPC or POPC results in sterol reorientation and membrane-domain formation. Biochem. 2010;35:7485–93. doi: 10.1021/bi100891z. [DOI] [PubMed] [Google Scholar]
- 56.Brzustowicz MR, Cherezov V, Caffrey M, Stillwell W, Wassall SR. Molecular organization of cholesterol in polyunsaturated membranes: microdomain formation. Biophys J. 2002b;82:285–298. doi: 10.1016/S0006-3495(02)75394-0. [DOI] [PMC free article] [PubMed] [Google Scholar]
- 57.Brzustowicz MR, Cherezov V, Zerouga M, Caffrey M, Stillwell W, Wassall SR. Controlling membrane cholesterol content. A role for polyunsaturated (docosahexaenoate) phospholipids. Biochem. 2002a;41:12509–12519. doi: 10.1021/bi0262808. [DOI] [PubMed] [Google Scholar]
- 58.Brzustowicz MR, Stillwell W, Wassall SR. Molecular organization of cholesterol in polyunsaturated phospholipid membranes: a solid state 2H NMR investigation. FEBS Lett. 1999;451:197–202. doi: 10.1016/s0014-5793(99)00567-0. [DOI] [PubMed] [Google Scholar]
- 59.Shaikh SR, Brzustowicz MR, Gustafson N, Stillwell W, Wassall SR. Monounsaturated PE does not phase-separate from the lipid raft molecules sphingomyelin and cholesterol: role for polyunsaturation? Biochem. 2002;41:10593–10602. doi: 10.1021/bi025712b. [DOI] [PubMed] [Google Scholar]
- 60.Shaikh SR, Cherezov V, Caffrey M, Stillwell W, Wassall SR. Interaction of cholesterol with a docosahexaenoic acid-containing phosphatidylethanolamine: trigger for microdomain/raft formation? Biochem. 2003a;42:12028–12037. doi: 10.1021/bi034931+. [DOI] [PubMed] [Google Scholar]
- 61.Shaikh SR, Dumaual AC, LoCassio D, Siddiqui RA, Stillwell W. Acyl chain unsaturation in PEs modulates phase separation from lipid raft molecules. Biochem Biophys Res Commun. 2003b;311:793–796. doi: 10.1016/j.bbrc.2003.10.057. [DOI] [PubMed] [Google Scholar]
- 62.Shaikh SR, Locascio DS, Soni SP, Wassall SR, Stillwell W. Oleic- and docosahexaenoic acid-containing phosphatidylethanolamines differentially phase separate from sphingomyelin. Biochim Biophys Acta. 2009;178:2421–2426. doi: 10.1016/j.bbamem.2009.08.019. [DOI] [PMC free article] [PubMed] [Google Scholar]
- 63.Saiz L, Klein ML. Structural properties of a highly polyunsaturated lipid bilayer from molecular dynamics simulations. Biophys J. 2001;81:204–216. doi: 10.1016/S0006-3495(01)75692-5. [DOI] [PMC free article] [PubMed] [Google Scholar]
- 64.Shaikh SR, Brzustowicz MR, Stillwell W, Wassall SR. Formation of inverted hexagonal phase in SDPE as observed by solid-state 31P NMR. Biochem Biophys Res Commun. 2001;286:758–763. doi: 10.1006/bbrc.2001.5454. [DOI] [PubMed] [Google Scholar]
- 65.Shaikh SR, Kinnunb JJ, Lengb X, Williamsb JA, Wassal SR. How polyunsaturated fatty acids modify molecular organization in membranes: Insight from NMR studies of model systems, Biochim. Biophys Acta. 2015;1848:1, 211–219. doi: 10.1016/j.bbamem.2014.04.020. [DOI] [PubMed] [Google Scholar]
- 66.Korlach J, Schwille P, Webb WW, Feigenson GW. Characterization of lipid bilayer phases by confocal microscopy and fluorescence correlation spectroscopy. Proc Natl Acad Sci. 1999;96:8461–8466. doi: 10.1073/pnas.96.15.8461. [DOI] [PMC free article] [PubMed] [Google Scholar]
- 67.Ayuyan AG, Cohen FS. Lipid Peroxides Promote Large Rafts:Effects of Excitation of Probes in Fluorescence Microscopy and Electroformation Research During Vesicle Formation. iophys J. 2006;91:2172–2183. doi: 10.1529/biophysj.106.087387. [DOI] [PMC free article] [PubMed] [Google Scholar]
- 68.Zhao J, Wu J, Shao H, Kong F, Jain N, Hunt G, Feigenson GW. Phase studies of model biomembranes: macroscopic coexistence of Lα + Lb, with light-induced coexistence of Lα + Lo phases. Biochim Biophys Acta. 2007;1768:2777–2786. doi: 10.1016/j.bbamem.2007.07.009. [DOI] [PMC free article] [PubMed] [Google Scholar]
- 69.Baykal-Caglar E1, Hassan-Zadeh E, Saremi B, Huang J. Preparation of giant unilamellar vesicles from damp lipid film for better lipid compositional uniformity. Biochim Biophys Acta. 2012;1818(11):2598–604. doi: 10.1016/j.bbamem.2012.05.023. [DOI] [PubMed] [Google Scholar]
- 70.Buboltz JT. Steady-state probe-partitioning fluorescence resonance energy transfer: A simple and robust tool for the study of membrane phase behavior. Phys Rev E. 2007;76:021903. doi: 10.1103/PhysRevE.76.021903. [DOI] [PubMed] [Google Scholar]
- 71.Feigenson GW. Phase Diagrams and Lipid Domains in Multicomponent Lipid Bilayer Mixtures. Biochim Biophys Acta. 2009;1788:47–52. doi: 10.1016/j.bbamem.2008.08.014. [DOI] [PMC free article] [PubMed] [Google Scholar]
- 72.Mayor S, Rao M. Rafts: scale-dependent, active lipid organization at the cell surface. Traffic. 2004;5:231–240. doi: 10.1111/j.1600-0854.2004.00172.x. [DOI] [PubMed] [Google Scholar]
- 73.Jacobson K, Mouritsen OG, Anderson RG. Lipid rafts: at a crossroad between cell biology and physics. Nat Cell Biol. 2007;9:7–14. doi: 10.1038/ncb0107-7. [DOI] [PubMed] [Google Scholar]
- 74.Silvius JR. Fluorescence energy transfer reveals microdomain formation at physiological temperatures in lipid mixtures modeling the outer leaflet of the plasma membrane. iophys J. 2003;85:1034–1045. doi: 10.1016/S0006-3495(03)74542-1. [DOI] [PMC free article] [PubMed] [Google Scholar]
- 75.de Almeida RFM, Fedorov A, Prieto M. Sphingomyelin/Phosphatidylcholine/cholesterol phase diagram: boundaries and composition of lipid rafts. Biophys J. 2003;85:2406–2416. doi: 10.1016/s0006-3495(03)74664-5. [DOI] [PMC free article] [PubMed] [Google Scholar]
- 76.de Almeida RFM, Loura LMS, Fedorov A, Prieto M. Lipid Rafts have Different Sizes Depending on Membrane Composition: A Time-resolved Fluorescence Resonance Energy Transfer Study. J Mol Biol. 2005;346:1109–1120. doi: 10.1016/j.jmb.2004.12.026. [DOI] [PubMed] [Google Scholar]
- 77.Silvius JR. Fluorescence Energy Transfer Reveals Microdomain Formation at Physiological Temperatures in Lipid Mixtures Modeling the Outer Leaflet of the Plasma Membrane. Biophys J. 2003a;85:1034–1045. doi: 10.1016/S0006-3495(03)74542-1. [DOI] [PMC free article] [PubMed] [Google Scholar]
- 78.Konyakhina TM, Goh SL, Amazon J, Heberle FA, Wu J, Feigenson GW. Control of a nanoscopic-to-macroscopic transition: modulated phases in 4-Component DSPC/DOPC/POPC/chol Giant Unilamellar Vesicles. Biophys J Letters. 2011;101(2):L8–L10. doi: 10.1016/j.bpj.2011.06.019. [DOI] [PMC free article] [PubMed] [Google Scholar]
- 79.Goh SL, Amazon J, Feigenson GW. Towards a better raft model: Modulated phases in the 4-component bilayer, DSPC/DOPC/POPC/CHOL. Biophys J. 2013;104:853–862. doi: 10.1016/j.bpj.2013.01.003. [DOI] [PMC free article] [PubMed] [Google Scholar]
- 80.Kingsley PB, Feigenson GW. The synthesis of a perdeuterated phospholipid:1,2-dimyristoyl-sn-glycero-3-phosphocholine-d72. Chem Phys Lipids. 1979;24:135–147. [Google Scholar]
- 81.Seul M, Andelman D. Domain shapes and patterns: the phenomenology of modulated phases. Science. 1995;267:476–483. doi: 10.1126/science.267.5197.476. [DOI] [PubMed] [Google Scholar]
- 82.Esterbauer H, Jurgens G, Quehenberger O, Koller E. Autoxidation of human low density lipoproteins: loss of polyunsaturated fatty acids and vitamin E and generation of aldehydes. J Lipid Res. 1987;28:495–507. [PubMed] [Google Scholar]
- 83.Spiteller G. Is Lipid Peroxidation of Polyunsaturated Acids the Only Source of Free Radical That Induce Aging and Age-Related Diseases. Rejuvenation Research. 2010;13:91–99. doi: 10.1089/rej.2009.0934. [DOI] [PubMed] [Google Scholar]
- 84.Kim RS, LaBella FS. Comparison of Analytical Methods for Monitoring Autoxidation profiles of authentic lipids. J of lipid Res. 1987:1110–1117. [PubMed] [Google Scholar]
- 85.Frenkel EN. Antioxidants in Lipid Foods and Their Impact on Food Quality. Food Chem. 1996;57:51–55. [Google Scholar]
- 86.Buettner GR, Jurkiewics BA. Catalytic Metals, Ascorbate and Free Radicals: Combinations to Avoid. Radiation Res. 1996;145:532–541. [PubMed] [Google Scholar]
- 87.Bligh EG, Dyer WJ. A rapid method for total lipid extraction and purification. CanJBiochemPhysiol. 1959;37:911–917. doi: 10.1139/o59-099. [DOI] [PubMed] [Google Scholar]
- 88.Morales-Penningston NF, Wu J, Farkas ER, Goh SL, Konyakhina TM, Zheng JY, Webb WW, Feigenson GW. GUV Preparation and Imaging: Minimizing Artifacts. Biochim Biophys Acta. 2010;1798:1324–1332. doi: 10.1016/j.bbamem.2010.03.011. [DOI] [PMC free article] [PubMed] [Google Scholar]
- 89.Heuvingh J, Bonneau S. Asymmetric Oxidation of Giant Vesicles triggers Curvature-associated Shape Transition and Permeabilization. Biophys J. 2009;97:2904–2912. doi: 10.1016/j.bpj.2009.08.056. [DOI] [PMC free article] [PubMed] [Google Scholar]
- 90.Feigenson GW, Buboltz JT. Ternary phase diagram of dipalmitoyl-PC/dilauroyl-PC/cholesterol: nanoscopic domain formation driven by cholesterol. Biophys J. 2001;80:2775–2788. doi: 10.1016/S0006-3495(01)76245-5. [DOI] [PMC free article] [PubMed] [Google Scholar]
- 91.Buboltz JT, Feigenson GW. A novel strategy for the preparation of liposomes: rapid solvent exchange. Biochim Biophys Acta. 1999;1417:232–245. doi: 10.1016/s0005-2736(99)00006-1. [DOI] [PubMed] [Google Scholar]
- 92.Heberle FA, Buboltz JT, Stringer D, Feigenson GW. Fluorescence Methods to Detect Phase Boundaries in Lipid Bilayer Mixtures. Biochim Biohpys Acta. 2005;1746:186–192. doi: 10.1016/j.bbamcr.2005.05.008. [DOI] [PMC free article] [PubMed] [Google Scholar]
- 93.Buboltz JT, Bwalya C, Williams K, Schutzer M. High-Resolution Mapping of Phase Behavior in a Ternary Lipid Mixture: Do Lipid—Raft Phase Boundaries Depend on the Sample Preparation Procedure? angmuir. 2007b;23:11968–11971. doi: 10.1021/la702490r. [DOI] [PubMed] [Google Scholar]
- 94.Reeves JP, Dowben RM. Formation and properties of thin-walled phospholipid vesicles. Journal of Cellular Physiology. 1969;73:49–60. doi: 10.1002/jcp.1040730108. [DOI] [PubMed] [Google Scholar]
- 95.Akashi K, Miyata H, Itoh H, Kinosita K. Preparation of giant liposomes in physiological conditions and their characterization under an optical microscope. Biophys J. 1996;71:3242–3250. doi: 10.1016/S0006-3495(96)79517-6. [DOI] [PMC free article] [PubMed] [Google Scholar]
- 96.Feigenson GW, Buboltz JT. Ternary phase diagram of dipalmitoyl-PC/dilauroyl-PC/cholesterol: nanoscopic domain formation driven by cholesterol. Biophys J. 2001;80:2775–2788. doi: 10.1016/S0006-3495(01)76245-5. [DOI] [PMC free article] [PubMed] [Google Scholar]
- 97.Mills TT, Huang J, Feigenson GW, Nagle JF. Effects of cholesterol and unsaturated DOPC lipid on chain packing of saturated gel-phase DPPC bilayers. Gen Physiol Biophys. 2009;28:126–39. doi: 10.4149/gpb_2009_02_126. [DOI] [PMC free article] [PubMed] [Google Scholar]
- 98.Marsh JS. Principles of Phase Diagrams. McGraw-Hill; New York: 1935. pp. 122–170. [Google Scholar]
- 99.Farkas ER, Webb WW. Precise and millidegree stable temperature control for fluorescence imaging: application to phase transitions in lipid membranes. The Review of Scientific Instruments. 2010;81:093704. doi: 10.1063/1.3483263. [DOI] [PMC free article] [PubMed] [Google Scholar]
- 100.Honerkamp-Smith AR, Cicuta P, Collins M, Veatch SL, Schick M, den Nijs M, Keller SL. Line tensions, correlation lengths, and critical exponents in lipid membranes near critical points. Biophys J. 2008;5(1):236–46. doi: 10.1529/biophysj.107.128421. [DOI] [PMC free article] [PubMed] [Google Scholar]
- 101.Veatch SL, Cicuta P, Sengupta P, Honerkamp-Smith A, Holowka D, Baird B. Critical fluctuations in plasma membrane vesicles. ACS Chem Biol. 2008;3:287–293. doi: 10.1021/cb800012x. [DOI] [PubMed] [Google Scholar]
- 102.Honerkamp-Smith AR, Veatch SL, Keller SL. An introduction to critical points for biophysicists; observations in lipid membranes. Biochim Biophys Acta. 2009;1788(1):53–63. doi: 10.1016/j.bbamem.2008.09.010. [DOI] [PMC free article] [PubMed] [Google Scholar]
- 103.Tian A, Johnson C, Wang W, Baumgart T. Line Tension at Fluid Membrane Domain Boundaries Measured by Micropipette Aspiration. Physical Review Letters. 2007;98:18–21. doi: 10.1103/PhysRevLett.98.208102. [DOI] [PubMed] [Google Scholar]
- 104.Angelova MI, Dimitrov DS. Liposome Electroformation. Faraday Discuss, Chem Soc. 1986;81:303–312. [Google Scholar]
- 105.Dimitrov DS, Angelova MI. Lipid swelling and liposome formation on solid surfaces in external electric fields. New Trends in Colloid Science. 1987:48–56. [Google Scholar]
- 106.Dimitrov DS, Angelova MI. Lipid swelling and liposome formation mediated by electric fields. Chem Interfacial Electrochem. 1988;19:323–336. [Google Scholar]
- 107.Angelova MI, Dimitrov DS. A mechanism of liposome Electroformation. Prog Colloid Poym Sci. 1988;76:59–67. [Google Scholar]
- 108.Angelova MI, Soléau S, Méléard P, Faucon JF, Bothorel P. Preparation of giant vesicles by external AC fields. Kinetics and application. Prog Colloid Polym Sci. 1992;89:127–131. [Google Scholar]
Associated Data
This section collects any data citations, data availability statements, or supplementary materials included in this article.