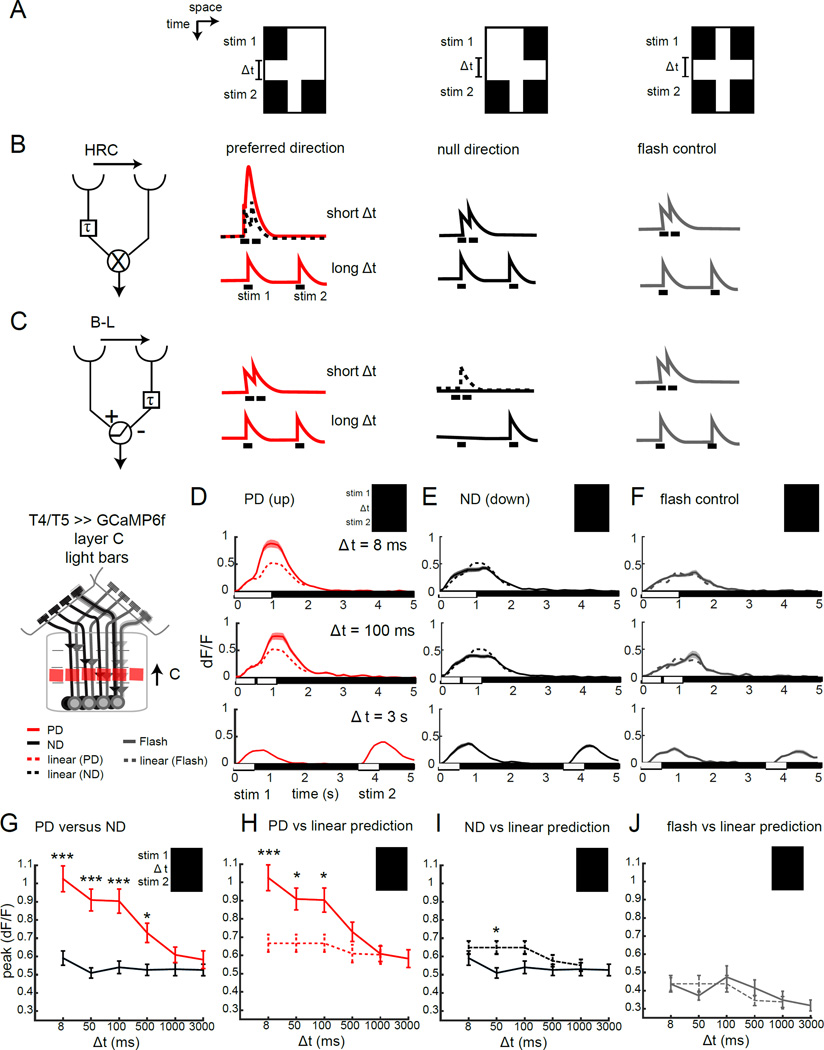
Figure 2. T4 responses selectively enhance preferred direction signals.
(A) X-T plots of apparent motion stimuli. A single bar appears for 0.5 s (stim 1); followed by a temporal delay of variable length (Δt), then a pair of bars appears for 0.5 s (stim 2). Shown are bar pair stimuli that create apparent motion to the right (PD), apparent motion to the left (middle panel, ND) and a control in which two pairs of bars are separated by Δt (flash control). (B,C) HRC and B-L models that are tuned to rightward motion, and their predicted responses to the stimuli shown in (A). The dotted lines display the linear prediction based on the sum of individual stim 1 and stim 2 responses. (D–F) Calcium signals imaged in the axon terminals of T4 and T5 in lobula plate layer C in response to a light bar version of the stimuli described above, at three different temporal delays. The dotted line represents the linear prediction based on the separate responses (recorded at Δt = 3 s). N = 14 (67) for axon terminals in (D, E) and N = 4(16) in (F). (G–J) Quantification of the peak calcium response at various time delays, comparing PD and ND responses (G), PD responses and the linear prediction (H), ND responses and the linear prediction (I) and double flash control responses with the linear prediction (J), for axon terminals of T4 and T5 in layer C of the lobula plate. * p <0.05, *** p<0.001, unpaired two tailed Student’s t-test with Bonferroni correction for multiple comparisons. See also Figure S2.

