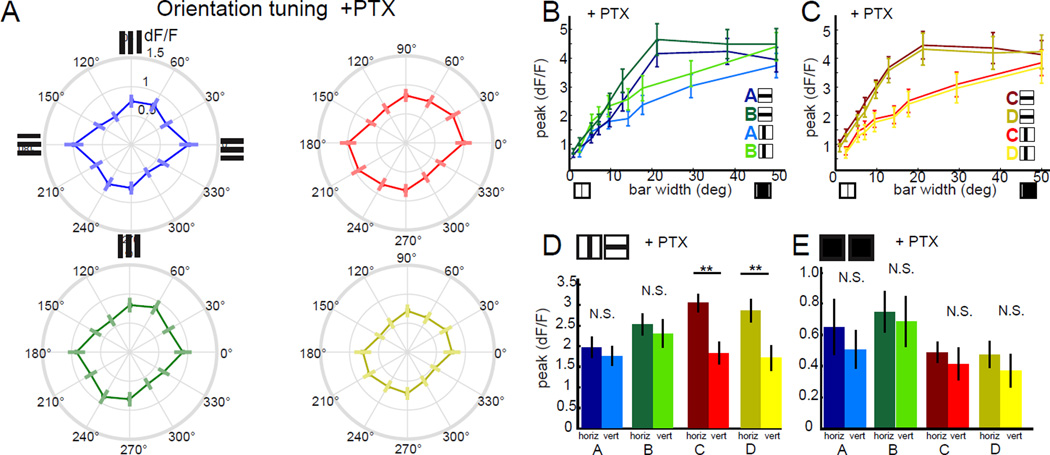
Figure 5. Orientation selectivity and antagonist surround require GABAergic signaling.
(A) Polar plots displaying peak calcium responses in T4 and T5 axon terminals to static gratings of different orientations after application of the GABAAR antagonist picrotoxin (PTX). Error bars are ±SEM. Layer A: N= 4(33). Layer B: N = 4(35). Layer C: N = 4(39). Layer D: N = 4(34). (B,C) Peak calcium responses in T4 and T5 axon terminals to static dark bars of various widths, after application of PTX, comparing horizontally and vertically oriented bars. N = 4 (20) for lobula plate layer A. N = 4 (24) for layer B. N = 4 (24) for layer C. N = 4 (22) for layer D. (D,E) Quantification of the difference in response to horizontally and vertically oriented dark bars that were 7 to 15° wide (D) or light bars that were 5 to 10° wide (E) after application of PTX, using averaged peak responses of the same ROIs used in panels (B,C) or in Figure S5 B,C. ** p<0.01, N.S. = not significant p>0.05, two tailed Student’s t-test. See also Figure S5.

