

Abstract
Yeasts of Rhodotorula genus have been reported to show endophytic colonization in different plants. Some of the Rhodotorula species are found to exhibit plant growth promoting activities and also have been reported to protect plants against invading pathogens. A yeast strain closely related to Rhodotorula mucilaginosa was isolated from the endosphere of Typha angustifolia collected from a Uranium mine. A microarray analysis was performed to investigate the early changes in rice shoot transcripts in response to this yeast (R. mucilaginosa JGTA-S1). Transcriptional changes were monitored in 6 h and 24 h treated rice plant shoots as compared to 0 h control. The microarray data has been submitted to the NCBI GEO repository under the accession number of GSE64321.
Keywords: Endophyte, Plant growth promotion, Rhodotorula mucilaginosa
| Specifications | |
|---|---|
| Organism/cell line/tissue | Oryza sativa cv. Swarna MTU 7029 |
| Sex | Not applicable |
| Sequencer or array type | Affymetrix GeneChip® Rice St. 1.0 |
| Data format | Raw |
| Experimental factors | Oryza sativa Swarna MTU 7029 treated with Rhodotorula sp. 6 h and 24 h compared to 0 h control |
| Experimental features | Shoot tissue from three weeks old Oryza sativa cv. Swarna MTU 7029 plants 0 h, 6 h or 24 h post treatment with Rhodotorula mucilaginosa JGTA-S1 cell suspension (107 cfu) was harvested, frozen in liquid nitrogen and stored at − 80 °C for RNA isolation |
| Consent | Not applicable, data available in public repository |
| Sample source location | Rhodotorula mucilaginosa JGTA-S1 was isolated from Typha angustifolia plants collected from a Uranium mine in Jaduguda, India (22.6500°N, 86.3600°E) |
1. Direct link to deposited data
2. Experimental design, materials and methods
2.1. Experimental design
Rhodotorula sp. is a family of basidiomycetous yeasts that are reported as endophytes in many plants e.g., apple [1], tomato [2], wild cottonwood and hybrid poplar [3] and rice [4]. Yeasts of Rhodotorula sp. especially those with endophytic lifestyle have not yet been reported to show any detrimental effect on their host. In contrary, many beneficial effects have been reported. Rhodotorula rubra strain TG1 was found to exhibit plant protection activities when stem inoculated in rice [4]. Rhodotorula mucilaginosa JGTA-S1 is an endophytic yeast isolated from Typha angustifolia — a wetland macrophyte collected from a Uranium mine tailings in Jaduguda, India. To investigate the early changes in the shoot transcriptome in rice, in response to R. mucilaginosa JGTA-S1 treatment, rice plants were supplied with the yeast cells. Transcriptional changes were monitored 6 h and 24 h post infection.
3. Materials and methods
3.1. Rice growth and infection
Rice seeds (Oryza sativa cv. Swarna MTU 7029) were surface sterilized and germinated on filter paper. Four to five days old seedlings of equal lengths were transferred to artificial soil (Soilrite™, Keltech Energies Ltd., India) containing 2 × MS salt mixture (15 mL media/30 g soil). R. mucilaginosa JGTA-S1 culture grown in TSB (pancreatic digest of casein 17 g/lt, papaic digest of soybean meal 3 g/lt, sodium chloride 5 g/lt, dipotassium hydrogen phosphate 2.50 g/lt and dextrose 2.50 g/lt) (107 cfu/pot containing 30 g of soil) was added to 3 week old plants. Shoots from 0 h, 6 h or 24 h post treated plants were harvested and stored at − 80 °C until used for RNA isolation.
3.2. RNA isolation
Total RNA was isolated from the frozen rice shoot tissues using the HiPurA™ Plant and Fungal RNA Miniprep Purification Spin Kit (Himedia, India). RNA was treated with DNase I (1 units/2 μg of RNA) to remove genomic DNA contamination.
3.3. Microarray hybridization and analysis
The quality of the RNA isolated from rice shoots (O. sativa cv. Swarna MTU 7029) was analyzed in an Agilent 2011 Bioanalyzer with an RNA LabChip kit. Total RNA was used for microarray using AffymetrixGeneChip® Rice St. 1.0 following the manufacturer recommended protocol. The array format was 100 midi. Microarray hybridizations were performed for 16 h at 60 rpm at 48 °C at iLife Discoveries, India. The microarrays were scanned with a GeneChip® 3000 7G scanner. Raw data were analyzed using an expression console tool, Affymetrix TAC software and genesis tool. RiceGene St. 1.0 array contained 146,918 distinct probes representing different rice genes. Two independent biological replicates for each time points were used. The background adjustment, quantile normalization and summarization were done with the default setting of the RMA16 algorithm followed by data adjustment and background correction in GeneSpring tool. The raw values were obtained after thresholding and summarization. Summarization was obtained by computing geometric mean. Normalized value was obtained after log transformation, normalization and baseline transformation. One way ANOVA was applied to assess the statistical significance of differentially expressed genes. The false positive rates were controlled by a multiple testing correction. Adjusted p-values were derived from multiple statistical tests. Benjamini and Hochberg's [5] multiple testing adjustment was applied to the p-values. Fold changes were calculated for genes differentially expressed in a statistically significant manner (p < 0.05) with a cut off of ≥ 2 or − 2. The differentially expressed genes were classified according to their GO ontology using agriGO [6]. The Parametric Analysis of Gene Set Enrichment (PAGE) was performed.
3.4. Real time PCR validation of randomly chosen genes
Two micrograms of total RNA was used to synthesize cDNA with Random Hexamer Primer (Fermentas) using RevertAid™ Reverse Transcriptase (Fermentas 200 units/2μg of RNA) as per manufacturer's protocol. A different biological pool of tissue was used for validation of the microarray genes. The real time PCR was performed in Applied Biosystems 7500 fast. The primer sequences are Actin (Fwd 5′ AAGATCTGGCATCACACCTTCT 3′, Rev 5′ ATCTGGGTCATCTTCTCACGAT 3′), GDLS like lipase (Fwd 5′ TCCACATCGAGAAGCAGATCA 3′, Rev 5′ GTTGTTCACGAAGTCGTTGC 3′), Brassinosteroid insensitive 1-associated receptor kinase 1 (Fwd 5′ GCTTTCTTGCCTTGGCTACACT 3′, Rev 5′ CAGGGATTTACAAGGGTTGGAT 3′), GS-GOGAT (Fwd 5' GAATGGCGGAACAAAAGATTTC 3′, Rev 5′ AGCTTTCATCGCCTAAGTCTGC 3′) and OsIAA14 (Fwd 5’ GTCGCCTATGAGGACAAGGAC 3′, Rev 5′ GCCTCAGATCCTCGCATTATC 3′). The thermal step-up was 10 min at 95 °C, followed by 40 cycles of 15 s at 95 °C, 1 min at 60 °C. Fold change of expression was calculated by a 2− ΔΔCt method and plotted relative to control using Graph pad Prism 5.02. Experiments were done three times in triplicate.
4. Results and discussion
4.1. Gene expression analysis
Upon R. mucilaginosa JGTA-S1 treatment, 404 genes were differentially regulated within 6 h and 209 genes within 24 h in rice shoots. The volcano plots for the data are shown in Fig. 1A, B, C. Statistically significant differentially expressed up- and down-regulated genes (p < 0.05 & FC ≥ 2.0) are shown in red and blue colored cross signs. Among the 404 genes, within 6 h of infection, 198 genes were up-regulated and 206 genes were down-regulated (Table 1). The differentially regulated genes were classified according to their GO ontology. Genes differentially expressed within 6 h were classified into 127 categories (Table S1) among which 21 most significant categories are shown in Fig. 2A. When compared to control, within 24 h, 113 genes were up-regulated and 96 genes were down-regulated (Table 1). Genes differentially regulated within this time frame were classified into 80 GO categories (Table S1) among which 16 significant categories are shown in Fig. 2B. Genes differentially regulated at 24 h and those regulated within 6 h post infection were compared, 86 genes were found to be up-regulated and 38 genes were down-regulated (Table 1). These were found to be categorized into 63 GO categories among which 7 are shown in Fig. 2C.
Fig. 1.

Volcano plot showing the relation between the logarithm of the p-values and the log fold change between treated 6 h & 0 h (A), treated 24 h & 0 h (B) and treated 24 h & treated 6 h (C). The statistically significant differentially expressed up and downregulated genes (p < 0.05 & FC ≥ 2.0) are indicated by red and blue color cross signs respectively.
Table 1.
Summary of differential gene expression analysis.
| Groups compared conditions | Total no. of differentially expressed genes (up/down) | No. of up-regulated genes (FC ≥ 2.0) | No. of down-regulated genes (FC ≥ 2.0) |
|---|---|---|---|
| 6 h vs control | 404 | 198 | 206 |
| 24 h vs control | 209 | 113 | 96 |
| 24 h vs 6 h | 124 | 86 | 38 |
Fig. 2.

Differentially expressed genes were classified according to their GO ontology using agriGO via Parametric Analysis of Gene Set Enrichment (PAGE) analysis. GO abundance charts were plotted on the basis of Z-score statistical value for all three comparisons: 6 h vs 0 h (control) (A), 24 h vs 0 h (control) (B) & 24 h vs 6 h (C). Up and down-regulation terms are indicated in blue and green color respectively.
4.2. Validation of microarray data
The validation was performed using RNA isolated from tissue from a different biological pool using genes randomly chosen. Genes used were Brassinosteroid insensitive 1 associated receptor kinase 1 (LOC_Os11g31540), GDSL like lipase (LOC_Os02g57110), glutamate synthase (GS-GOGAT, LOC_Os05g48200), OsIAA14 (LOC_Os03g58350) (Fig. 3). All these genes showed similar expression patterns as observed in the microarray analysis validating the data (Fig. 3).
Fig. 3.
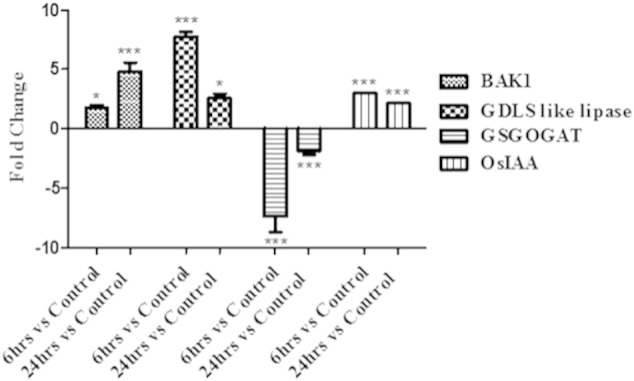
Validation of the microarray data with chosen genes: cDNA was prepared from total RNA isolated from shoots of control (0 h), 6 h, 24 h R. mucilaginosa treated rice plants. BAK1 = Brassinosteroid insensitive 1-associated receptor kinase 1 precursor (LOC_Os11g31540), GDSL like lipase (LOC_Os02g57110), GSGOGAT = glutamate synthase (LOC_Os05g48200.1), OsIAA = OsIAA14 (LOC_Os03g58350.1). [*** (p value < 0.001), ** (p value 0.001 to 0.01) & * (p value 0.01 to 0.05)].
5. Implication of the work
Endophytic microbes isolated from plants growing in nutrition deficient environment have been shown to have beneficial effect on many agriculturally important plants [7], [8]. Since interaction of Rhodotorula sp. with plants has the potential to have biotechnological importance, transcriptional studies using microarrays may provide a powerful tool for discovering genes that may be important in understanding the interaction.
The following are the supplementary data related to this article.
Acknowledgments
We acknowledge Department of Biotechnology project number BT/PR15410/BCE/08/861/2011 for funding the work.
References
- 1.Kolozsvári Nagy J., Sule S., Sampaio J.P. Apple tissue culture contamination by Rhodotorula spp.: identification and prevention. Vitr. Cell. Dev. Biol. - Plant. 2005;41:520–524. [Google Scholar]
- 2.Larran S., Mónaco C., Alippi H.E. Endophytic fungi in leaves of Lycopersicon esculentum mill. World J. Microbiol. Biotechnol. 2001;17:181–184. [Google Scholar]
- 3.Xin G., Glawe D., Doty S.L. Characterization of three endophytic, indole-3-acetic acid-producing yeasts occurring in populus trees. Mycol. Res. 2009;113:973–980. doi: 10.1016/j.mycres.2009.06.001. [DOI] [PubMed] [Google Scholar]
- 4.Akhtyamova N., Sattarova R.K. Endophytic yeast Rhodotorula rubra strain TG-1: antagonistic and plant protection activities. Biochem. Physiol. 2013;2:104. [Google Scholar]
- 5.Benjamini Y., Hochberg Y. Controlling the false discovery rate: a practical and powerful approach to multiple testing. J. R. Stat. Soc. Ser. B. 1995;57:289–300. [Google Scholar]
- 6.Du Z., Zhou X., Ling Y., Zhang Z., Su Z. agriGO: a GO analysis toolkit for the agricultural community. Nucleic Acids Res. 2010;38:W64–W70. doi: 10.1093/nar/gkq310. [DOI] [PMC free article] [PubMed] [Google Scholar]
- 7.Khan Z., Guelich G., Phan H., Redman R., Doty S. Bacterial and yeast endophytes from poplar and willow promote growth in crop plants and grasses. ISRN Agron. 2012;2012:11. [Google Scholar]
- 8.Knoth J.L., Kim S.-H., Ettl G.J., Doty S.L. Effects of cross host species inoculation of nitrogen-fixing endophytes on growth and leaf physiology of maize. GCB Bioenergy. 2013;5:408–418. [Google Scholar]
Associated Data
This section collects any data citations, data availability statements, or supplementary materials included in this article.