Volume 141, No. 5, May 6, 2013. Pages 601–618.
In our 2013 paper in the Journal, we investigated the effects of mutations in the S1, S2, and S3 segments for each of the four domains of the voltage-gated sodium channel of skeletal muscle. As part of that work, we reported the effects of mutations on activation using I-V relations from experiments using the nonpermeant cation N-methyl-d-glucamine for internal and external recording solutions.
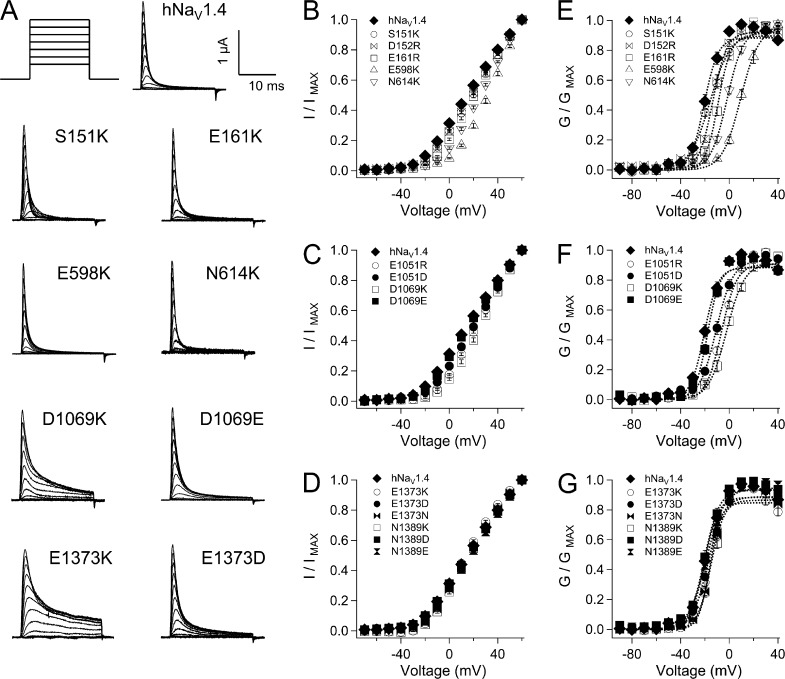
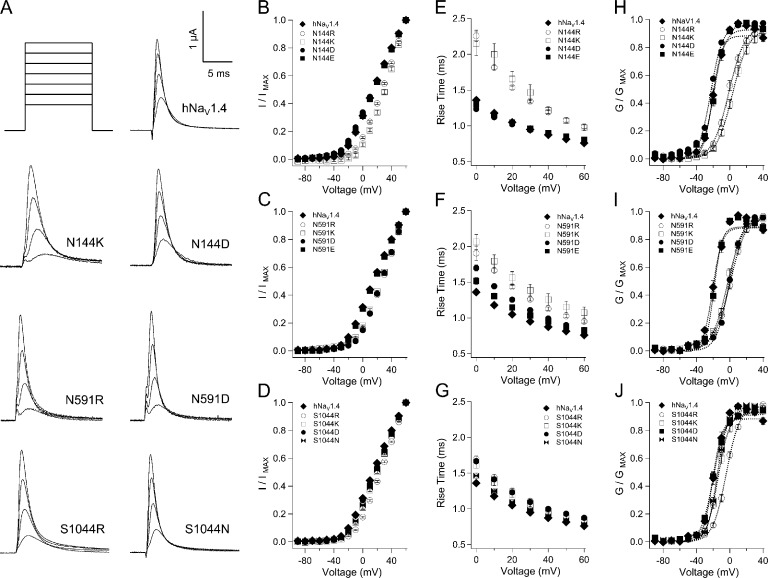
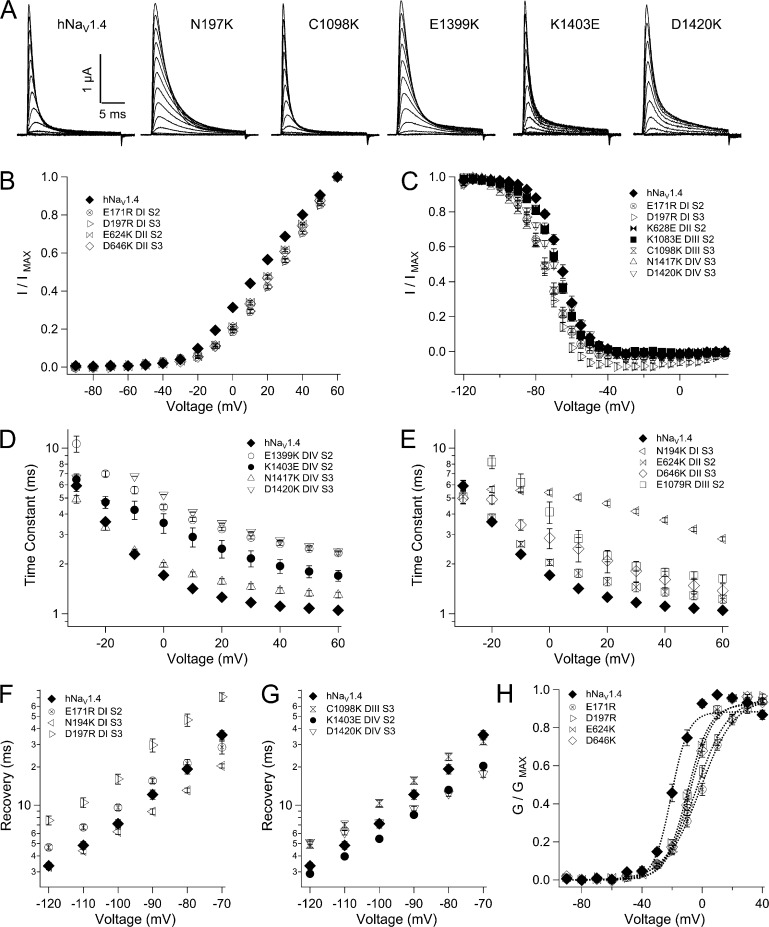
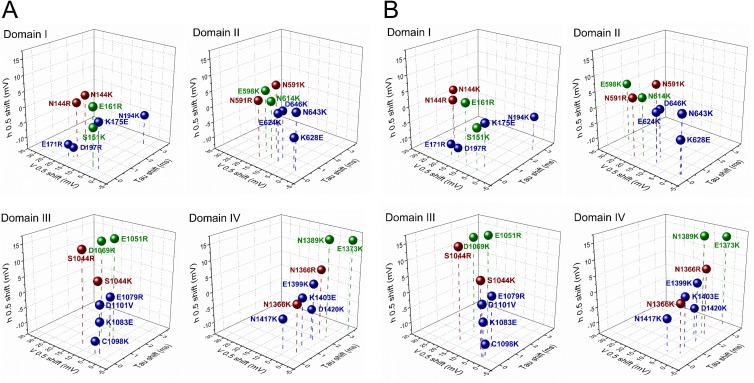
These conditions do not provide a measure of driving force as needed for a Boltzmann fit to obtain conductance parameters of midpoint and slope factor. Therefore, we have analyzed the original dataset using the asymptote for the relative change in current amplitude to estimate driving force and plot G-V relations. G/GMAX was plotted as a function of voltage, and these curves were fit with a Boltzmann function to yield corrected values for midpoint and slope factor. These values and calculations for the change in free energy (ΔΔGo, nzFV0.5) for mutations are provided in Table 3. Correction to plots for I-V relations given in the original paper are provided as extra panels for Figs. 2, 6, and 10. Fig. 11 has been replotted in its entirety. Table 3 and Figs. 2, 6, 10, and 11 are below.
Table 3.
Equilibrium parameters for activation in wild-type and mutant sodium channels
| Mutation | Location | V0.5 | Slope factor | ΔΔGo |
| mV | kcal/mol | |||
| hNaV1.4 | −19.7 ± 1.4 | 5.28 ± 0.36 | ||
| ENC | ||||
| S151K | DI S1 | −14.7 ± 1.5a | 3.02 ± 0.13b | 1.4 |
| D152R | DI S1 | −13.2 ± 1.0c | 4.79 ± 0.14 | 0.9 |
| E161R | DI S2 | −8.93 ± 0.9b | 4.92 ± 0.23 | 1.4 |
| E598K | DII S1 | 9.76 ± 1.2b | 3.46 ± 0.16b | 3.2 |
| N614K | DII S2 | −1.56 ± 0.9b | 3.83 ± 0.21c | 2.3 |
| E1051R | DIII S1 | −7.01 ± 1.1b | 4.11 ± 0.12c | 1.7 |
| E1051D | DIII S1 | −9.85 ± 1.4b | 4.11 ± 0.32a | 1.5 |
| D1069K | DIII S2 | −2.11 ± 1.2b | 3.67 ± 0.17d | 2.2 |
| D1069E | DIII S2 | −17.4 ± 1.0 | 5.33 ± 0.35 | 0.3 |
| E1373K | DIV S1 | −17.7 ± 0.9 | 6.08 ± 0.32 | −0.1 |
| E1373N | DIV S1 | −15.5 ± 1.2a | 6.31 ± 0.53 | 0.1 |
| E1373D | DIV S1 | −17.4 ± 0.8 | 4.04 ± 0.14c | 0.8 |
| N1389K | DIV S2 | −15.0 ± 1.2a | 4.64 ± 0.22 | 0.8 |
| N1389E | DIV S2 | −18.5 ± 1.3 | 3.64 ± 0.20d | 0.8 |
| N1389D | DIV S2 | −20.2 ± 1.2 | 4.57 ± 0.20 | 0.3 |
| HCR | ||||
| N144K | DI S1 | 5.46 ± 1.8b | 2.72 ± 0.19b | 2.7 |
| N144R | DI S1 | −0.07 ± 1.4b | 2.70 ± 0.19b | 2.4 |
| N144D | DI S1 | −22.7 ± 0.7 | 3.72 ± 0.14d | 0.5 |
| N144E | DI S1 | −19.1 ± 0.9 | 4.22 ± 0.20a | 0.5 |
| N591K | DII S1 | −1.93 ± 1.3b | 2.71 ± 0.17b | 2.3 |
| N591R | DII S1 | 0.96 ± 1.1b | 2.56 ± 0.12b | 2.5 |
| N591D | DII S1 | −0.11 ± 0.9b | 3.45 ± 0.19b | 2.4 |
| N591E | DII S1 | −18.4 ± 1.1 | 5.34 ± 0.29 | 0.1 |
| S1044K | DIII S1 | −13.7 ± 1.1c | 4.06 ± 0.20c | 1.1 |
| S1044R | DIII S1 | −4.12 ± 0.9b | 3.19 ± 0.11b | 2.1 |
| S1044N | DIII S1 | −15.1 ± 0.7c | 4.44 ± 0.19a | 0.9 |
| S1044D | DIII S1 | −19.0 ± 1.1 | 3.67 ± 0.28c | 0.8 |
| N1366K | DIV S1 | −18.2 ± 1.8 | 4.88 ± 0.45 | 0.4 |
| N1366R | DIV S1 | −16.5 ± 1.3 | 5.42 ± 0.30 | 0.3 |
| N1366D | DIV S1 | −13.6 ± 1.2c | 3.04 ± 0.19b | 1.4 |
| N1366E | DIV S1 | −15.7 ± 1.2a | 3.92 ± 0.20c | 1.0 |
| INC | ||||
| E171R | DI S2 | −0.70 ± 1.6b | 2.25 ± 0.09b | 2.4 |
| K175E | DI S2 | −17.0 ± 0.9 | 4.45 ± 0.25 | 0.7 |
| N194K | DI S3 | −21.4 ± 1.2 | 4.03 ± 0.20c | 0.4 |
| D197R | DI S3 | −3.22 ± 1.5b | 2.54 ± 0.15b | 2.2 |
| E624K | DII S2 | −8.88 ± 1.3b | 3.67 ± 0.14d | 1.6 |
| K628E | DII S2 | −20.8 ± 0.7 | 4.66 ± 0.20 | 0.2 |
| N643K | DII S3 | −21.0 ± 0.6 | 4.97 ± 0.12 | 0.0 |
| D646K | DII S3 | −7.17 ± 1.3b | 3.49 ± 0.21d | 1.8 |
| E1079R | DIII S2 | −15.0 ± 1.0c | 4.36 ± 0.37 | 0.9 |
| K1083E | DIII S2 | −16.9 ± 1.1 | 4.21 ± 0.22a | 0.8 |
| C1098K | DIII S3 | −17.6 ± 1.3 | 3.59 ± 0.14d | 0.9 |
| D1101V | DIII S3 | −16.9 ± 1.2 | 5.02 ± 0.46 | 0.4 |
| E1399K | DIV S2 | −17.2 ± 1.2 | 4.80 ± 0.23 | 0.5 |
| K1403E | DIV S2 | −16.4 ± 1.4 | 3.56 ± 0.24d | 1.1 |
| N1417K | DIV S3 | −13.6 ± 0.9d | 3.47 ± 0.17b | 1.3 |
| D1420K | DIV S3 | −14.7 ± 1.3a | 3.62 ± 0.18d | 1.2 |
Midpoint voltage and slope factor for wild-type hNaV1.4 and mutations of the extracellular charge region ENC, hydrophobic charge region HCR, and intracellular region INC, for segments S1–S3 in domains I–IV. Values represent mean ± SEM and were obtained from the Boltzmann fits to plots of G/GMAX shown in Figs. 2 (ENC), 6 (HCR), and 10 (INC). ΔΔGo values were calculated as nzFV0.5 from mean midpoint voltage.
P ≤ 0.05.
P ≤ 0.0001.
P ≤ 0.01.
P ≤ 0.001.
Figure 2.
Conductance in hNaV1.4 and ENC mutations. (A) Traces for wild-type and mutant channels in response to depolarizing commands to voltages ranging from −90 to 60 mV. I-V relations are shown for ENC mutations in domains I and II (B), domain III (C), and domain IV (D). Values represent mean ± SEM (error bars) from 10–22 experiments. Additional panels are shown for g-V relations in domains I and II (E), domain III (F), and domain IV (G). Boltzmann fits to each plot are shown by dotted lines.
Figure 6.
Activation parameters for mutations at S1 HCR locus in hNaV1.4. (A) Traces shown are responses to depolarization to 0, 20, 40, and 60 mV for mutations in domains I–III. Plots in B, D, and F show I-V relations for mutations in these domains; plots in C, E, and G show activation kinetics. Values represent mean ± SEM (error bars) from 11–24 experiments. Additional panels are shown for g-V relations for hNaV1.4 and mutations of the HCR in domain I (H), domain II (I), and domain III (J). Boltzmann fits to each plot are shown by dotted lines.
Figure 10.
Biophysical characterization of INC mutations. (A) Sodium currents in response to command depolarization to voltages from −90 to 60 mV. Effects of INC mutations are shown for activation (B), steady-state fast inactivation (C), entry into fast inactivation (D and E), and recovery (F and G). Legends identify residues and locus by domain and segment. Values represent mean ± SEM (error bars) from 10–23 experiments. The additional panel (H) is shown for g-V relations for hNaV1.4 and mutations of the INC in domains I and II. Boltzmann fits to each plot are shown by dotted lines.
Figure 11.
Three-dimensional plot showing the effect of charge-reversing mutations of residues in ENC (green), HCR (red), and INC (blue) regions. Shown for each domain are shifts in inactivation kinetics at 20 mV (x axis), activation probability (y axis), and inactivation probability (z axis). Corrected values for V0.5 shifts shown in B are calculated from g-V relations of Table 3.
The corrected parameters for activation of wild-type hNaV1.4 in Table 3 are comparable to conductance measurements for the skeletal muscle sodium channel in other reports. Calculations of the change in free energy associated with activation of hNaV1.4 yielded values of 2–3 kcal/mol for several mutations in the ENC and HCR of domains I–III, and the INC of domains I and II. These values are similar to those calculated for S1 and S2 countercharge mutations in NachBac (DeCaen et al., 2008, 2011). Our calculations of free energy differences are based on the effects of point mutations in a single domain of the skeletal muscle sodium channel, and interpretation of the role of S1–S3 countercharges based on those calculations should be limited.
In our original paper we concluded that negative countercharges in domains I–III are an important determinant of channel activation, most likely interacting with S4 positively charged residues to facilitate the outward movement of the voltage sensors in those domains in response to membrane depolarization. Further experimentation is needed to test our hypotheses about the general role of countercharge as a determinant of activation in NaV1.4. In addition, we speculated that ENC and HCR countercharge residues in domains I and II may interact with outer positive charges in the S4 segments of these domains. A more recent study does show that ENC residues in domains I and II of rNaV1.4 are important for channel activation (Pless et al., 2014). Future work describing the role of HCR or INC residues in activation is also needed to investigate the mechanisms by which S1–S3 countercharges affect sodium channel gating.
References
- DeCaen P.G., Yarov-Yarovoy V., Zhao Y., Scheuer T., and Catterall W.A.. 2008. Disulfide locking a sodium channel voltage sensor reveals ion pair formation during activation. Proc. Natl. Acad. Sci. USA. 105:15142–15147. 10.1073/pnas.0806486105 [DOI] [PMC free article] [PubMed] [Google Scholar]
- DeCaen P.G., Yarov-Yarovoy V., Scheuer T., and Catterall W.A.. 2011. Gating charge interactions with the S1 segment during activation of a Na+ channel voltage sensor. Proc. Natl. Acad. Sci. USA. 108:18825–18830. 10.1073/pnas.1116449108 [DOI] [PMC free article] [PubMed] [Google Scholar]
- Pless S.A., Elstone F.D., Niciforovic A.P., Galpin J.D., Yang R., Kurata H.T., and Ahern C.A.. 2014. Asymmetric functional contributions of acidic and aromatic side chains in sodium channel voltage-sensor domains. J. Gen. Physiol. 143:645–656. 10.1085/jgp.201311036 [DOI] [PMC free article] [PubMed] [Google Scholar]


