Abstract
Objective
An equation was developed for estimating hand activity level (HAL) directly from tracked RMS hand speed (S) and duty cycle (D).
Background
Table lookup, equation, or marker-less video tracking can estimate HAL from motion/exertion frequency (F) and D. Since automatically estimating F is sometimes complex, HAL may be more readily assessed using S.
Methods
Hands from 33 videos originally used for the HAL rating were tracked to estimate S, scaled relative to hand breadth (HB), and single-frame analysis was used to measure D. Since HBs were unknown, a Monte Carlo method was employed for iteratively estimating the regression coefficients from US Army anthropometry survey data.
Results
The equation: , R2 = 0.97, had a residual range ±0.5 HAL.
Conclusions
The S equation superiorly fit the Latko (1997) data and predicted independently observed HAL values (Harris, 2011) better (MSE=0.16) than the F equation (MSE=1.28).
Practitioner Summary
An equation was developed for estimating the HAL rating for the ACGIH Threshold Limit Value® based on hand RMS speed and duty cycle. Speed is more readily evaluated from videos using semi-automatic markerless tracking, than frequency. The speed equation predicted observed HAL values much better than the F equation.
Keywords: repetitive motion, work related musculoskeletal disorders, exposure assessment
1. Introduction
The American Conference of Government Industrial Hygienists (2001) Threshold Limit Value® (TLV®) for Hand Activity Level (HAL) rating originates from Latko et al. (1997) where 33 jobs were estimated by a team of expert raters on a 10-point visual analog scale based on hand speed and rest pauses. It may also be determined from a lookup table, which is part of the TLV® by measuring exertion frequency (F) and percent duty cycle (D) where:
Conventional methods for ascertaining the HAL rating for a job depend on a trained observer viewing workers performing the job on site or observing a video of the job off site. The process is often labor intensive and there may be differences in ratings between observers. An automated analysis of the job would be more objective and less obtrusive and may be suitable for a real-time, direct reading exposure assessment instrument for HAL rating. Such an approach depends on direct measurements of hand movements during actual work.
Repetitive motion derives from the cyclical nature of manual work (Radwin and Lin, 1993). Repetition can be described using traditional industrial engineering work methods to identify the fundamental movements and exertions required to perform a job (Armstrong, Radwin and Hansen, 1986). The time required to perform a task can be determined directly through time study or predetermined time systems, and thus the frequency can be estimated from the period of fundamental elemental times. Repetitive motion can also be quantified by measuring movements and exertions.
A variety of electronic instruments for measuring human kinematics of the upper limb, such as electrogoniometers, have previously been used to quantify motions of the hand and wrist for different attributes of work using direct measurements (Buchholz & Wellman, 1997; Jonsson & Johnson, 2001; Schoenmarklin and Marras, 1993; Marshall, Mozrall, & Shealy, 1999). These measurements were used for evaluating hand kinematics, such as speed and acceleration, as well as evaluating repetition. Several studies have attempted to automate the analysis of repetitive motion measurement of in the workplace (Bhattacharya, et al., 1999; Person, Hodgson, & Nagy, 2001). Spectral analysis of electrogoniometer data was proposed as an efficient method for quantifying repetitive motion frequency that agreed closely with observational analysis and was more precise (Juul-Kristensen, Hansson, Fallentin, Andersen, & Ekdahl, 2001; Radwin & Lin, 1993; Yen & Radwin, 2000a). Radwin and Lin (1993) found that single frequency motions were directly related to motion frequency but more complex activities often had multiple frequency components. Radwin et al. (1994) devised an approach analogous to a sound level meter using frequency-weighted filters based on psychophysical data for equivalent discomfort levels resulting from repetitive movements of different amplitudes and frequencies (Lin & Radwin, 1998a, 1998b; Lin, Radwin, & Snook, 1997).
Both observations and direct measurements are mostly limited to research studies and are often impractical for industry practitioners. Compared to instruments, indirect observation lacks precision and accuracy, is not suitable for long observation periods, and requires considerable analyst time (Lowe, 2004). Alternatively, attaching sensors on working hands is time consuming (Yen & Radwin, 2000b), and sensors may interfere with normal working operations. Not only is instrumentation use resource intensive, but the required technical knowledge often makes this approach inaccessible to practitioners. Considering these limits, recent protocols for musculoskeletal research often involved observation (Bonfiglioli, 2013; Burt, et al., 2011; Garg & Kapellusch, 2009; Garg, et al., 2012; Harris, et al., 2011; Kapellusch et al., 2013; Wurzelbacher et al., 2010).
Radwin, et al. (2014) developed an equation for estimating HAL based on measurements of F and D using data from Latko, et al. (1997) in order to continuously predict HAL values consistent with the TLV® look-up table. The equation:
| (Equation 1) |
More accurately predicted the Latko et al. (1997) data, particularly for F ≥ 1.25 Hz and D ≥ 60% jobs. Such an equation can be utilized in an instrument for quantifying F and D to directly measure HAL.
It was recently demonstrated for stereotypical laboratory hand transfer tasks that HAL can be calculated using automated video analysis that employs semi-automatic marker-less tracking to directly measure F and D (Chen et al., 2013). A cross correlation-based template-matching algorithm was programmed to track the motion trajectory of a selected region of interest over successive video frames for a single camera. Automatic measures of F however are challenging particularly when repetitive motion becomes more complex than simple cyclical motion patterns involving fundamental frequencies of motion and harmonics. Cyclical motion patterns are more easily identified for stereotypic motion but becomes more challenging for more complex motions that may not originate and terminate at the same location.
Since the HAL scale is anchored against speed of motion/exertions and rest pauses, we hypothesize that measures of hand speed would more directly measure and be better related to the HAL scale than F. In the current study we develop a new equation for computing HAL directly from tracked hand S (S equation) and D rather than relying on estimates of F (F equation) for an automated instrument to directly measure HAL.
2. Methods
The S equation was ascertained using regression analysis on data obtained from the Latko (1997) videos of 33 jobs and their associated HAL ratings, so that the new equation is consistent with the current HAL scale. Since the videos were not calibrated, a method for estimating distances to calculate hand speed was developed based on measuring the worker hand breadth measured in pixels directly from a video frame and statistically estimating speed of motion. The resulting regression equation was then validated using independent videos of jobs and observational HAL ratings from Harris et al. (2011).
The videos for the 33 Latko (1997) jobs were digitized and a contiguous segment of the video was selected in which the most active hand was visible and representative of the overall task. It was not always possible to track the hand over an entire cycle for some jobs that had long cycle times due to camera movement and visual obstructions. In these cases video segments were analyzed when the active hand was visible and was representative of the motions performed in an entire cycle. A description of the 33 jobs, observed HAL, F, D and the video segment lengths analyzed, are summarized in Table 1.
Table 1.
Data from Latko (1997) and associated RMS Speed and Hand Breadth
| Title | Industry | Avg. HAL | Frequency (F, exertions/s) | Duty Cycle (D, %) | Analyzed Video (s) | RMS Speed (S, mm/s) | Hand Breadth (HB, pixels) | |
|---|---|---|---|---|---|---|---|---|
| 1 | Inspection | Appliance Mfg | 0.6 | 0.125 | 26 | 20 | 255.3 | 50.7 |
| 2 | Milacron | Fiber Drum Mfg | 1.5 | 0.167 | 11 | 24 | 424.2 | 25.3 |
| 3 | Marriage Load | Auto Components | 1.0 | 0.281 | 54 | 60 | 291.9 | 38.9 |
| 4 | Auto Edge Wrap | Auto Components | 2.65 | 0.338 | 45 | 60 | 437.6 | 43.5 |
| 5 | Water Jet | Auto Components | 2.125 | 0.376 | 55 | 85 | 388.3 | 50.0 |
| 6 | Transfer Task | Laboratory | 2.35 | 0.167 | 32 | 10 | 508.8 | 47.4 |
| 7 | Line Stack | Fiber Drum Mfg | 3.5 | 0.740 | 31 | 19 | 665.9 | 26.5 |
| 8 | Ground Wire | Appliance Mfg | 4.825 | 0.820 | 71 | 20 | 580.4 | 23.0 |
| 9 | DC Inspection | Glass/Mirror Mfg | 4.225 | 0.385 | 26 | 28 | 697.9 | 32.5 |
| 10 | Silkscreen | Auto Components | 4.725 | 0.769 | 86 | 17 | 477.7 | 34.5 |
| 11 | Rotary | Fiber Drum Mfg | 5.2 | 0.500 | 74 | 20 | 566.1 | 35.0 |
| 12 | Hanging Parts | Appliance Mfg | 4.45 | 0.555 | 59 | 17 | 591.8 | 41.0 |
| 13 | Bulkhead | Appliance Mfg | 4.3 | 0.320 | 47 | 45 | 636.0 | 50.0 |
| 14 | Panel Upholstery | Office Furniture Mfg | 4.825 | 0.550 | 83 | 38 | 526.5 | 30.8 |
| 15 | Fabric Wrap | Auto Components | 5.98 | 1.330 | 74 | 25 | 574.0 | 35.4 |
| 16 | Transfer Task | Laboratory | 5.23 | 0.333 | 43 | 10 | 811.0 | 29.4 |
| 17 | Securing Fan | Appliance Mfg | 6.23 | 1.080 | 95 | 13 | 538.3 | 21.6 |
| 18 | Wiring Heat Box | Appliance Mfg | 6.28 | 0.730 | 84 | 17 | 578.5 | 22.6 |
| 19 | Upper Back Panel | Appliance Mfg | 6.25 | 0.870 | 100 | 33 | 502.0 | 31.4 |
| 20 | Console Back | Appliance Mfg | 5.95 | 0.667 | 87 | 13 | 629.3 | 27.6 |
| 21 | Securing Top | Appliance Mfg | 6.63 | 0.833 | 100 | 13 | 535.5 | 33.4 |
| Panel | ||||||||
| 22 | Shape Cutter | Glass/Mirror Mfg | 6.68 | 1.050 | 88 | 40 | 563.0 | 33.8 |
| 23 | Paint - Visors | Auto Components | 7.35 | 1.260 | 90 | 48 | 747.4 | 54.8 |
| 24 | Paint - Armrest | Auto Components | 7.48 | 1.110 | 91 | 45 | 710.1 | 59.5 |
| 25 | Lid Assembly | Auto Components | 7.1 | 0.917 | 95 | 40 | 739.2 | 31.8 |
| 26 | CAN Sewing | Auto Components | 7.98 | 1.580 | 93 | 85 | 806.6 | 31.6 |
| 27 | Deck Sewing | Auto Components | 7.45 | 0.568 | 96 | 89 | 668.7 | 23.0 |
| 28 | Cup Assemly | Auto Components | 7.68 | 0.800 | 92 | 93 | 779.1 | 18.7 |
| 29 | Ergon Upholstery | Office Furniture Mfg | 7.95 | 0.814 | 90 | 133 | 908.2 | 26.4 |
| 30 | Curler | Fiber Drum Mfg | 8.13 | 1.429 | 71 | 20 | 1055.0 | 47.3 |
| 31 | Hand Op 2 | Fiber Drum Mfg | 8.5 | 1.430 | 81 | 20 | 1000.0 | 21.9 |
| 32 | Hand Op 1 | Fiber Drum Mfg | 8.5 | 1.670 | 82 | 20 | 1142.2 | 38.0 |
| 33 | Transfer Task | Laboratory | 8.35 | 0.667 | 61 | 10 | 1288.0 | 28.9 |
Because the videos originated from 8mm format analog recordings, quality was often noisy and at times limited in contrast. A procedure was developed for reliably tracking the most active hand using a semiautomatic tracking algorithm backed up by multiple analysts. Video segments were first selected and a region of interest (ROI) centering on the hand was identified. The default dimensions for the ROI were 20 × 20 pixels, but depending on the size of the hand in the video, the analyst adjusted the ROI size. The hand ROI in the selected video segment was tracked using the video-tracking algorithm described in Chen, et al. (2013). After tracking the ROI, two independent analysts reviewed the tracked video frame-by-frame in order to identify any deviations from the actual hand location, and manually corrected the tracked ROI when necessary. An additional analyst reviewed the segments tracked by the other analysts and settled any discrepancies greater than the half of the length of the ROI diagonal by correcting the discrepancy, or averaging both if the differences were less than half of the length of the ROI diagonal.
Hand speed magnitude in the x-y axes was measured from the corrected pixel ROI motion record using the equation: where px is the pixel location on the x axis, py is the pixel location on the y axis and Vxy,video is the difference between the pixel location for the previous and following video frame divided by two times the sample rate (since the numerator was two frames apart), which was 1/30 s.
Speed was first calculated in units of pixels per second and then converted into physical units of millimeters. Since the videos originate circa 1997 and were produced for a different purpose, no provisions were made for scaling the images against a standard unit of distance. A scaling procedure was therefore used based on the US Army (1991) hand breadth anthropometry survey data base. The analyst identified the active hand in each video segment and measured the hand breadth in units of pixels using MVTA software (Yen and Radwin, 1995). Hand breadth was used because of its small coefficient of variation of 0.046 for males and 0.048 for females. Hand speed RMS was calculated using the equation:
Where exertion time . This calculation is illustrated in Figure 1. The calibrated RMS speed (mm/s) is plotted against HAL in Figure 2.
Figure 1.
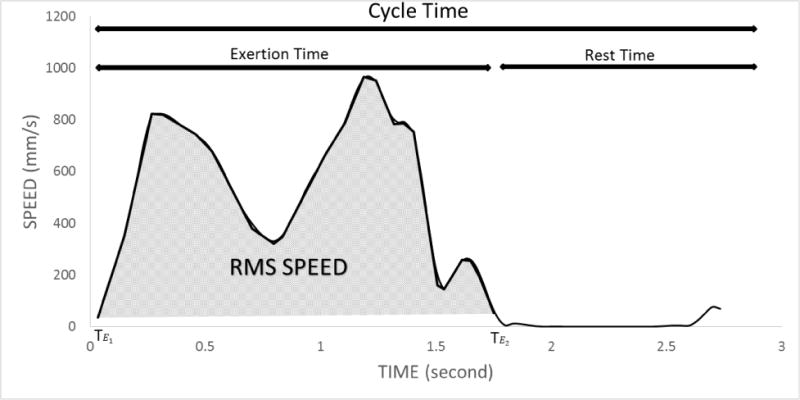
Representative plot of speed v. time. RMS speed is calculated only during time periods when motion/exertions are performed.
Figure 2.
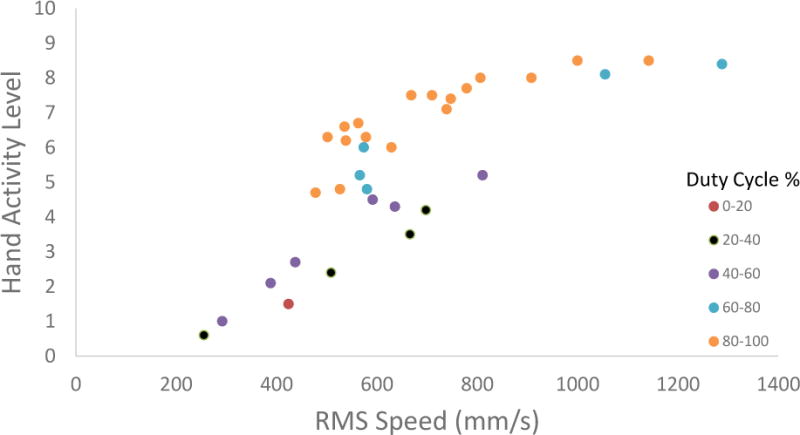
A plot of Hand Activity Level v. measured Root Mean Square (RMS) speed (S) estimated for the 33 jobs from Latko (1997)
In order to examine the effect of the variation of hand breadth on the scaled RMS speed and the predicted HAL values, a Monte Carlo method was employed such that a hand breadth in mm for each of the 33 jobs was randomly selected from a normal distribution with mean and standard deviation relative to gender based on the US Army (Greiner, 1991) hand anthropometry survey. The ratio of the randomly generated hand breadth to the measured pixel hand breadth was calculated and RMS speed was scaled to mm/s. A regression equation for HAL was first estimated, and another random set of hand breadth sizes were selected for each of 33 jobs and the equation estimate was repeated. This process was reiterated until all of the average regression coefficients converged to a difference less than 10−6 from the previous average.
2.1 Linear Regression Equation
A linear regression equation for HAL was tested based on hand S and D for each set or randomly selected hand widths using the Monte Carlo method described above. The form of the regression equation was:
The predicted HAL value was calculated for each regression iteration for varying S and D, and the variation in HAL was calculated.
2.2 Logit Linear Regression Equation
Since the HAL scale is bounded by 0 and 10 and a linear regression can predict beyond that range, we considered an alternative approach. A sigmoidal logit-linear regression equation was fit to the data using a similar Monte Carlo method for estimating hand speed. First the HAL values were rescaled between 0 and 1 by dividing each value by 10. A log transformation of the independent variable RMS Speed was also performed. The logit linear regression equation was in the form:
where HAL is the hand activity level from Latko (1997), S is the measured RMS hand speed after scaling, and D is the percent duty cycle for each task.
2.3 Equation Validation
Videos of 30 industrial tasks were randomly selected from Harris, et al. (2011) for validation of the S equations. Tasks were excluded if the video recordings had breaks, corruptions or jumps, ambiguous task descriptions and if the task did not have corresponding expert HAL ratings. Based on above criteria, 5 tasks were excluded from the initial 30 random set and 5 new randomly selected tasks were substituted. The HAL range of included tasks were between 2 and 8. These were the same data used by Radwin et al. (2014) for validation of the F equation for HAL.
The videos were randomly assigned to three independent analysts and each task was analyzed by two analysts. The process for video hand tracking to find the hand speed is described above. After hand tracking was completed, an independent analyst confirmed the tracking results. MVTA single frame video analysis (Yen and Radwin, 1995) was performed to measure D for each task. Exertion time and rests period definitions were consistent with Latko (1997). Exertions were considered a unique application of force by a loaded hand, while rest was marked only when the hand was unloaded. At least 10 cycles of exertions and rest periods for each video segment were marked using MVTA software and the subsequent duty cycles were calculated directly.
3. Results
3.1 Linear Regression Equation
A summary of the linear regression equation for HAL is provided in Table 2. The regression coefficients for S and D were statistically significant for p<0.05. Convergence was achieved within 580 iterations using the Monte Carlo process. The average R2 was 0.82. The model was:
| (Equation 2) |
Table 2.
Summary of the Linear Regression Coefficients from Monte Carlo Simulation for Varying Hand Breadth (N=580)
| Variable | Min | Average | Max | Standard Deviation |
|---|---|---|---|---|
| Intercept | −1.4534 | −1.16103 | −0.9178 | 0.08095 |
| RMS Speed (S) | 0.0042 | 0.00465 | 0.0051 | 0.00016 |
| Duty Cycle (D) | 0.0498 | 0.05312 | 0.0562 | 0.00098 |
|
| ||||
| Mean Square Error | 0.8569 | 0.9977 | 1.1723 | |
The upper boundary, lower boundary and means for these predictions are shown in Figure 3. The maximum difference between the upper bound and lower boundary was 0.25, 0.23, 0.21, 0.20 and 0.19 for duty cycle of 10%, 30%, 50%, 70%, and 90% respectively. The assumption diagnosis plot, residuals versus predicted HAL, indicated no significant variance violation or independence violation and are shown in Figure 4.
Figure 3.
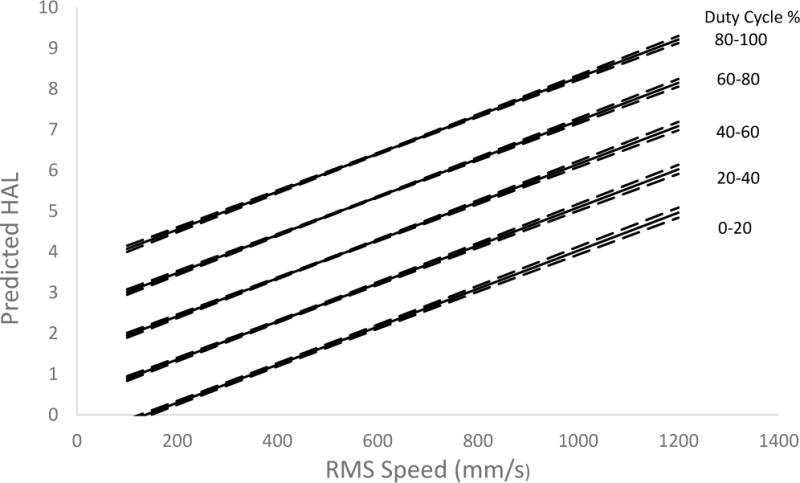
Plot of the linear equation for predicted HAL as a function of speed (S) and duty cycle (D). The solid line is the average regression line and the dotted lines represent the 0.1 percentile and 99.9 percentile of predicted HALs resulting from the Monte Carol process.
Figure 4.
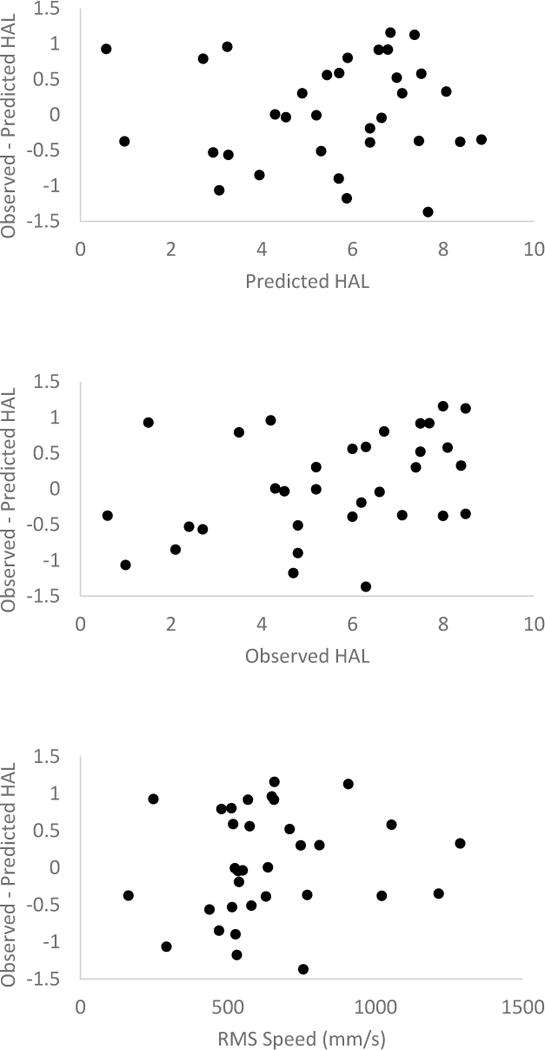
Linear equation resuuals for Observed-Predicted HAL v. Predicted HAL, Observered HAL and RMS Speed.
3.2 Logit Linear Regression Equation
The logit-linear regression equation is summarized in Table 3 and is plotted in Figure 5. Regression coefficients for S and D were statistically significant for p<0.05. Convergence was achieved within 238 iterations using the Monte Carlo process. The average R2 for the logit-linear models model was 0.97 (Naglekeke, 1991, Faraway, 2004). The upper boundary, lower boundary and means for these predictions are shown in Figure 5. The maximum difference between the upper bound and lower bound was 0.26, 0.21, 0.14, 0.13 and 0.19 for duty cycle of 10%, 30%, 50%, 70%, and 90% respectively. A plot of the residuals versus predicted HAL, indicated no significant variance violation and independence violation, and is shown in Figure 6. The equation was:
| (Equation 3) |
The residual range (Figure 6) was less than ± 0.5 HAL, which was considerably better than the linear regression equation.
Table 3.
Summary of the Logit-Linear Regression Coefficients from Monte Carlo Simulation for Varying Hand Breadth (N=580)
| Variable | Min | Average | Max | Standard Deviation |
|---|---|---|---|---|
| Intercept | −14.609 | −13.492 | −12.475 | 0.304 |
| RMS Speed (S) | 1.688 | 1.861 | 2.033 | 0.048 |
| Duty Cycle (D) | 0.023 | 0.026 | 0.028 | 0.000 |
|
| ||||
| Mean Square Error | 0.2907 | 0.4221 | 0.5576 | |
Figure 5.
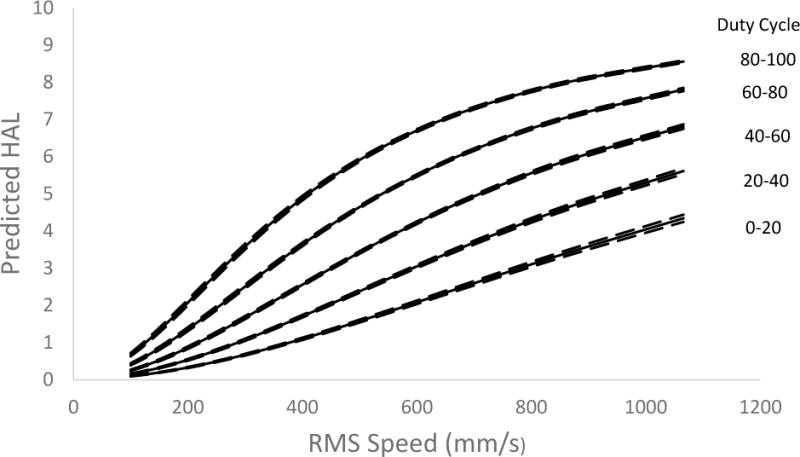
Plot of the logit-linear equation for predicted HAL as a function of speed (S) and duty cycle (D). The solid line is the average regression line and the dotted lines represent the 0.1 percentile and 99.9 percentile of predicted HALs resulting from the Monte Carol process.
Figure 6.
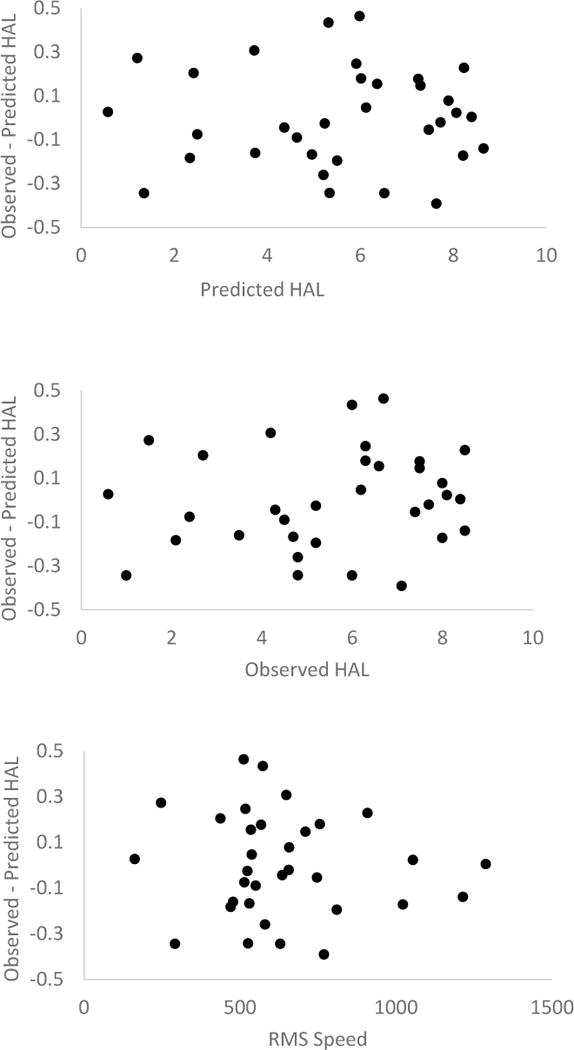
Logit-linear equation resuuals for Observed-Predicted HAL v. Predicted HAL, Observered HAL and RMS Speed.
3.3 Equation Validation
The linear regression (with intercept set to zero) between the linear equation predicted HAL and the observed HAL values had a slope of 0.88 (p<.001), R2=0.97, and is plotted in Figure 7(a). The logit-linear equation predicted HAL and the observed HAL values had a slope of 0.99 (p < .001), R2 = 0.99, and is plotted in Figure 7(b). The analysis of variance for the F equation and the S logit-linear equation are provided in Table 4. The mean square error for the non-linear regression equation for HAL based on F (Radwin at al. 2014) using the same 30 randomly selected tasks found that the mean square error was 1.28. The mean square error for the same data set using the logit equation for S and D was 0.16.
Figure 7.
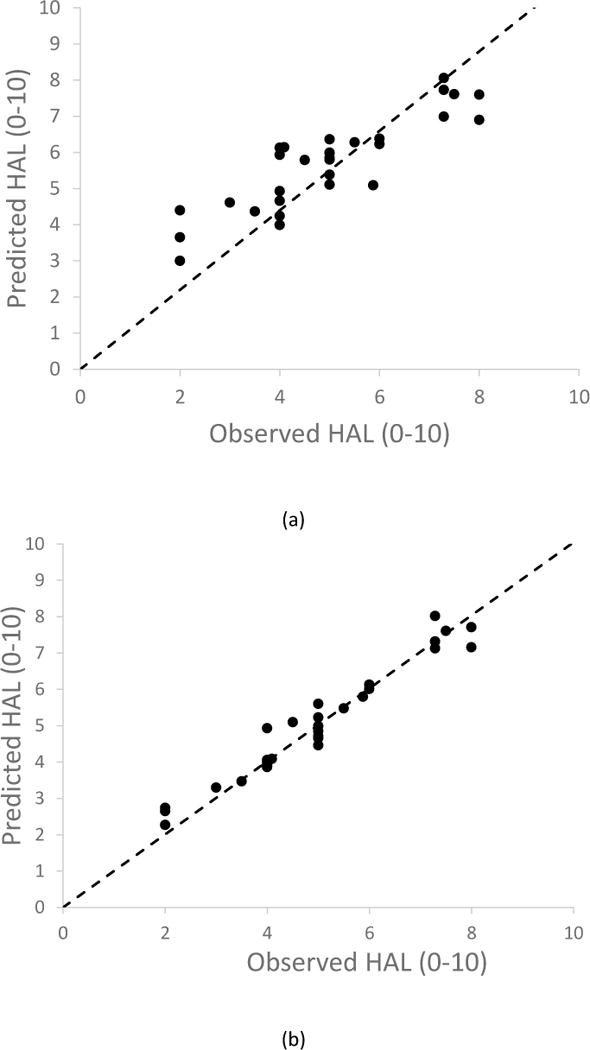
Predicted HAL plotted against observer rated HAL (From Harris, et al., 2011) for (A) the linear S equation (Equation 2) and (B) the logit-linear S equaiton (Equation 3).
Table 4.
ANOVA for Validation Regression
| Predicted HAL using F Equation (Equation 1) v. Observed HAL
| |||||
|---|---|---|---|---|---|
| df | SS | MS | F | Significance | |
| Regression | 1 | 784.47 | 784.48 | 611.49 | <.001 |
| Residual | 29 | 37.20 | 1.28 | ||
| Total | 30 | 821.68 | |||
|
| |||||
| Predicted HAL using S Linear Model (Equation 2) v. Observed HAL
| |||||
| df | SS | MS | F | Significance | |
|
| |||||
| Regression | 1 | 798.25 | 798.25 | 988.23 | <.001 |
| Residual | 29 | 23.43 | 0.81 | ||
| Total | 30 | 821.68 | |||
|
| |||||
| Predicted HAL using S Logit-Linear Equation (Equation 3) v. Observed HAL
| |||||
| df | SS | MS | F | Significance | |
|
| |||||
| Regression | 1 | 817.04 | 817.039 | 5108.75 | <.001 |
| Residual | 29 | 4.64 | 0.16 | ||
| Total | 30 | 821.68 | |||
4. Discussion
In this study we analyzed videos for the 33 jobs from Latko (1997) in order to find an association between the HAL scale, measured S and D. We considered estimating HAL using S rather than F because the HAL scale is inherently based on speed. Indeed this is consistent with the HAL scale anchors where HALs of 2–4 are labeled slow motions and HALs of 8–10 are labeled rapid motions. In addition, speed measurement lends itself more readily adaptable to automated processing.
In the linear equation, the significant coefficient for speed of 0.00465 indicates that every 100 mm/s increase in RMS speed increases HAL approximately 0.5 units. Note that the range of speed was 162–1,288 mm/s (Table1). This increase is approximately the same as a 10% increase in D; a 10% D increase yields a 0.53 increase in HAL. However in the logit-linear equation the speed enters the equation with its log taken and the coefficient is 2.25. Since the relationship is not linear, a direct comparison is not possible. However we can provide some examples of how the speed and duty cycle changes affect HAL. When speed is 500 mm/s and there is a 57% duty cycle, the associated HAL value is 3.2 and a 100 mm/s increase in speed will increase the HAL by 0.95. The same amount of increase is gained by 20% increase in duty cycle.
We conclude from the Monte Carlo simulation that hand breadth did not adversely affect the HAL prediction as a benchmark for scaling the hand speed. The use of hand breath was a convenient reference measure that showed little intra subject variation. The variation in HAL based on an average of 238 regressions from a random sampled set of hands showed little difference when normalized to hand breadth. For example, a worker has 355.6 pixels/s measured hand speed and using average male hand breadth (90.4 mm), the speed scaled to 726.57 mm/s yielding HAL of 5.2.
If the worker had the maximum hand breadth in the population, which is 106 mm (US Army, 1991) then the speed will be scaled to 819.3 with HAL of 5.9. On the other hand, if the worker has the minimum hand breadth in the population, which is 77 mm, then speed would be 595.17 with HAL of 4.1. The above case is for extreme cases which is not typical. The 90th and 10th percentile hand breath yields HAL ranges in between 4.7 to 5.4 which gives a maximum difference of 0.5 HAL. Thus an average hand breadth might be used to convert the speed from pixel/s to mm/s for videos when a calibration measure is not available. When videos are made using a reference calibration, the hand speed can be measured directly without the need to use hand breadth.
We validated our findings by using 30 randomly selected tasks from Harris, et al. (2011). The linear models under-predicted observer HAL, especially for the lower levels of HAL. The logit-linear S model had the best predictions of observed HAL. The predicted HAL values for the logit-linear S equation were consistent with observer rated HALs with mean square error of 0.16. For either model, the S equation better predicted observed HAL ratings when compared to the equation based on F (Radwin at al. 2014) which had a much greater mean square error of 1.28.
The use of hand speed was actually more consistent with the HAL values obtained from observation than using the frequency of exertion. The logit-linear S equation was substantially better (MSE=0.16) than the equation based on F (MSE=1.28) using the same 30 randomly selected tasks as shown in Table 4 (Radwin at al. 2014). The current validation only studied 30 randomly selected jobs. Future work should consider a wide range of jobs that vary in frequency, duty cycle and speed.
The development of an accurate equation for estimating HAL ratings should better enable use of automated and objective measurements in practice. While expert observer HAL ratings offer speed and efficiency, use of objective measurements based on worker hand kinematics should provide greater reliability, as well as offering specific engineering aspects of the job that may be addressed for reducing exposures and the risk of musculoskeletal injuries. For instance, a practitioner can use such an equation for quantitatively predicting the benefit of increasing pauses or reducing speed of movements and exertions. Furthermore, automated video analysis may help improve the speed and efficiency of making objective measurements in practice.
Conclusions
Based on these findings, the following conclusions are made:
The logit-linear S equation provides a better fit to the original HAL data (MSE=0.422) than the linear S equation (MSE=0.998).
A Monte Carlo process demonstrated that hand speed can be acceptably estimated, when a distance reference measure is unavailable, by using the hand breadth measured from the video scaled to a population mean hand breadth (90.4 mm for males and 79.5 mm for females).
The equations were validated against a set of 30 task videos of actual workers independently rated on the HAL scale using the observation method. The logit-linear S equation best predicted the observer HAL data (slope = 0.99, R2=0.99). The logit-linear S equation provided a better fit to the observed HAL validation data (MSE=0.16) than the linear S equation (MSE=0.81), and was substantially better than the linear regression F equation (MSE=1.28).
Semi-automatic video analysis of HAL would benefit from use of the S equation, as well as single frame analyses of industrial jobs.
Acknowledgments
This study was funded, in part, by a grant from the National Institute for Occupational Safety and Health (NIOSH/CDC), R21OH010221 (Radwin). Additional support came from the National Institute for Occupational Safety and Health (NIOSH/CDC), R01OH007914 (Rempel).
References
- ACGIH Worldwide. Hand Activity Level TLV®. Cincinnati, OH: 2001. [Google Scholar]
- Armstrong TJ, Radwin RG, Hansen DJ, Kennedy KW. Repetitive trauma disorders: job evaluation and design. Human Factors: The Journal of the Human Factors and Ergonomics Society. 1986;28(3):325–336. doi: 10.1177/001872088602800308. [DOI] [PubMed] [Google Scholar]
- Bao S, Howard N, Spielholz P, Silverstein B. Quantifying repetitive hand activity for epidemiological research on musculoskeletal disorders – Part II: comparison of different methods of measuring force level and repetitiveness. Ergonomics. 2006;49(4):381–392. doi: 10.1080/00140130600555938. [DOI] [PubMed] [Google Scholar]
- Bhattacharya A, Warren J, Teuschler J, Dimov M, Medvedovic M, Lemasters G. Development and evaluation of a microprocessor-based ergonomic dosimeter for evaluating carpentry tasks. Applied Ergonomics. 1999;30(6):543–553. doi: 10.1016/s0003-6870(99)00006-x. [DOI] [PubMed] [Google Scholar]
- Bonfiglioli R, Mattioli S, Armstrong TJ, Graziosi F, Marinelli F, Farioli A, Violante FS. Validation of the ACGIH TLV for hand activity level in the OCTOPUS cohort: a two-year longitudinal study of carpal tunnel syndrome. Scandinavian journal of work, environment & health. 2013;39(2) doi: 10.5271/sjweh.3312. [DOI] [PubMed] [Google Scholar]
- Buchholz B, Wellman H. Practical operation of a biaxial goniometer at the wrist joint. Human Factors. 1997;39(1):119–129. doi: 10.1518/001872097778940696. [DOI] [PubMed] [Google Scholar]
- Burt S, Crombie K, Jin Y, Wurzelbacher S, Ramsey J, Deddens J. Workplace and individual risk factors for carpal tunnel syndrome. Occupational and Environmental Medicine. 2011;68:928–933. doi: 10.1136/oem.2010.063677. [DOI] [PubMed] [Google Scholar]
- Chen CHE, Hu YH, Yen TY, Radwin RG. Automated video exposure assessment of repetitive hand activity level for a load transfer task. Human Factors: The Journal of the Human Factors and Ergonomics Society. 2013;55(2):298–308. doi: 10.1177/0018720812458121. [DOI] [PMC free article] [PubMed] [Google Scholar]
- Faraway JJ. Extending the linear equation with R: generalized linear, mixed effects and nonparametric regression equations. CRC press; 2004. [Google Scholar]
- Franzblau A, Armstrong TJ, Werner RA, Ulin SS. A cross-sectional assessment of the ACGIH TLV for hand activity level. Journal of Occupational Rehabilitation. 2005;15(1):57–67. doi: 10.1007/s10926-005-0874-z. [DOI] [PubMed] [Google Scholar]
- Garg A, Kapellusch J. Consortium Pooled Data Job Physical Exposure Assessment; Paper presented at the 17th World Congress in Ergonomics.2009. [Google Scholar]
- Garg A, Kapellusch J, Hegmann K, Wertsch J, Merryweather A, Deckow-Schaefer G, Malloy EJ, the WISTAH Hand Study Research Team The Strain Index (SI) and Threshold Limit Value (TLV) for Hand Activity Level (HAL): risk of carpal tunnel syndrome (CTS) in a prospective cohort. Ergonomics. 2012;55(4):396–414. doi: 10.1080/00140139.2011.644328. [DOI] [PubMed] [Google Scholar]
- Gell N, Robert A, Werner RA, Franzblau A, Ulin SS, Armstrong TJ. A Longitudinal Study of Industrial and Clerical Workers: Incidence of Carpal Tunnel Syndrome and Assessment of Risk Factors. Journal of Occupational Rehabilitation. 2005;15(1):47–55. doi: 10.1007/s10926-005-0873-0. [DOI] [PubMed] [Google Scholar]
- Greiner TM. Hand anthropometry of US army personnel. Army Natick Research Development And Engineering Center MA; 1991. ((No. TR-92/011)). [Google Scholar]
- Harris C, Eisen EA, Goldberg R, Krause N, Rempel D. 1st place, PREMUS best paper competition: workplace and individual factors in wrist tendinosis among blue-collar workers – the San Francisco study. Scandinavian Journal of Work Environment Health. 2011;37(2):85–98. doi: 10.5271/sjweh.3147. [DOI] [PMC free article] [PubMed] [Google Scholar]
- Jonsson P, Johnson PW. Comparison of measurement accuracy between two types of wrist goniometer systems. Applied Ergonomics. 2001;32(6):599–607. doi: 10.1016/s0003-6870(01)00036-9. [DOI] [PubMed] [Google Scholar]
- Juul-Kristensen B, Hansson GA, Fallentin N, Andersen JH, Ekdahl C. Assessment of work postures and movements using a video-based observation method and direct technical measurements. Applied Ergonomics. 2001;32(5):517–524. doi: 10.1016/s0003-6870(01)00017-5. [DOI] [PubMed] [Google Scholar]
- Kapellusch JM, Garg A, Milwaukee Hegmann KT, Thiese MS, Malloy EJ. The Strain Index and ACGIH TLV for HAL: Risk of Trigger Digit in the WISTAH Prospective Cohort. Human Factors. 2013 doi: 10.1177/0018720813493115. [DOI] [PubMed] [Google Scholar]
- Latko WA, Armstrong TJ, Foulke JA, Herrin GD, Rabourn RA, Ulin SS. Development and evaluation of an observational method for assessing repetition in hand tasks. American Industrial Hygiene Association Journal. 1997;58(4):278–85. doi: 10.1080/15428119791012793. [DOI] [PubMed] [Google Scholar]
- Latko WA, Armstrong TJ, Franzblau A, Ulin SS, Werner RA, Albers JW. Cross-sectional study of the relationship between repetitive work and the prevalence of upper limb musculoskeletal disorders. American Journal of Industrial Medicine. 1999;36:248–259. doi: 10.1002/(sici)1097-0274(199908)36:2<248::aid-ajim4>3.0.co;2-q. [DOI] [PubMed] [Google Scholar]
- Lin ML, Radwin RG. Agreement between a frequency-weighted filter for continuous biomechanical measurements of repetitive wrist flexion against a load and published psychophysical data. Ergonomics. 1998a;41(4):459–475. doi: 10.1080/001401398186946. [DOI] [PubMed] [Google Scholar]
- Lin ML, Radwin RG. Validation of a frequency-weighted filter for continuous biomechanical stress in repetitive wrist flexion tasks against a load. Ergonomics. 1998b;41(4):476–484. doi: 10.1080/001401398186955. [Article] [DOI] [PubMed] [Google Scholar]
- Lin ML, Radwin RG, Snook SH. A single metric for quantifying biomechanical stress in repetitive motions and exertions. Ergonomics. 1997;40(5):543–558. doi: 10.1080/001401397188026. [DOI] [PubMed] [Google Scholar]
- Lowe BD. Accuracy and validity of observational estimates of shoulder and elbow posture. Applied Ergonomics. 2004;35(2):159–171. doi: 10.1016/j.apergo.2004.01.003. [DOI] [PubMed] [Google Scholar]
- Marshall MM, Mozrall JR, Shealy JE. The effects of complex wrist and forearm posture on wrist range of motion. Human Factors. 1999;41(2):205–213. doi: 10.1518/001872099779591178. [DOI] [PubMed] [Google Scholar]
- Nagelkerke NJ. A note on a general definition of the coefficient of determination. Biometrica. 1991;78(3):691–692. [Google Scholar]
- Person JG, Hodgson AJ, Nagy AG. Automated high-frequency posture sampling for ergonomic assessment of laparoscopic surgery. Surgical Endoscopy and Other Interventional Techniques. 2001;15(9):997–1003. doi: 10.1007/s004640080155. [DOI] [PubMed] [Google Scholar]
- Schoenmarklin RW, Marras WS. Dynamic capabilities of the wrist joint in industrial workers. International Journal of Industrial Ergonomics. 1993;11(3):207–224. doi: 10.1016/0169-8141(93)90109-Q. [DOI] [Google Scholar]
- Radwin RG, Lin ML. An analytical method for characterizing repetitive motion and postural stress using spectral analysis. Ergonomics. 1993;36(4):379–389. doi: 10.1080/00140139308967895. [DOI] [PubMed] [Google Scholar]
- Radwin RG, Lin ML, Yen TY. Exposure Assessment of Biomechanical Stress in Repetitive Manual Work Using Frequency-Weighted Filters. Ergonomics. 1994;37(12):1984. doi: 10.1080/00140139408964962. [DOI] [PubMed] [Google Scholar]
- Radwin RG, Azari DP, Lindstrom JM, Ulin SS, Armstrong TJ, Rempel D. A frequency-duty cycle equation for the ACGIH hand activity level. Ergonomics. 2014 doi: 10.1080/00140139.2014.966154. In Press. [DOI] [PMC free article] [PubMed] [Google Scholar]
- Violante FS, Armstrong TJ, Fiorentini C, Graziosi F, Venturi S, Curti S, Zanardi F, Cooke R, Bonfiglioli R, Mattoli S. Carpal tunnel syndrome and manual work: A longitudinal study. Journal of Occupational and Environmental Medicine. 2007;49:1189–1196. doi: 10.1097/JOM.0b013e3181594873. [DOI] [PubMed] [Google Scholar]
- Wurzelbacher S, Burt S, et al. A comparison of assessment methods of hand activity and force for use in calculating the ACGIH(R) hand activity level (HAL) TLV(R) Journal of Occupational Environment Hygiene. 2010;7(7):407–416. doi: 10.1080/15459624.2010.481171. [DOI] [PubMed] [Google Scholar]
- Yen TY, Radwin RG. A video-based system for acquiring biomechanical data synchronized with arbitrary events and activities. IEEE Transactions on Biomedical Engineering. 1995;42(9):944–948. doi: 10.1109/10.412663. 1995. [DOI] [PubMed] [Google Scholar]
- Yen TY, Radwin RG. Automated job analysis using upper extremity biomechanical data and template matching. International Journal of Industrial Ergonomics. 2000a;25(1):19–28. [Google Scholar]
- Yen TY, Radwin RG. Comparison between using spectral analysis of electrogoniometer data and observational analysis to quantify repetitive motion and ergonomic changes in cyclical industrial work. Ergonomics. 2000b;43(1):106–132. doi: 10.1080/001401300184684. [DOI] [PubMed] [Google Scholar]


