

Abstract
Cortical lesions are crucial part of MS pathology and it is critical to determine that new MS therapies have the ability to alter cortical inflammatory lesions given the differences between white and grey matter lesions. We tested lipoic acid (LA) in a mouse focal cortical EAE model. Brain sections were stained with antibodies against CD4, CD11b and galectin-3. Compared with vehicle, treatment with LA significantly decreased CD4+ and galectin-3+ immune cells in the brain. LA treated mice had fewer galectin-3+ cells with no projections indicating decrease in the number of infiltrating monocytes. LA significantly reduces inflammation in a focal cortical model of MS.
Keywords: cortical lesions, focal EAE, multiple sclerosis, inflammation, immunofluorescence
Graphical abstract
1. Introduction
Multiple sclerosis (MS) is a debilitating disease that causes inflammation, demyelination, neuronal injury and axonal loss in the central nervous system. MS has traditionally thought to be a disease associated with white matter, but recent studies have shown substantial cerebral cortex lesions and grey matter pathology (Vercellino et al., 2005).
The histopathological characteristics of grey matter lesions differ from the lesions located in the white matter. Experimental autoimmune encephalomyelitis (EAE) is an important animal model that has been successfully used to study and develop various therapies for MS. There have been many different ways of inducing MS like disease in mice but none of the existing mice models are suitable to understand the heterogeneity of cortical lesions in the brain. Focal lesion models can be used to monitor specific lesions and treatment effects. Various focal EAE models have been developed in rats by injecting cytokines (Kerschensteiner et al. 2004; Merkler et al. 2006) and vascular endothelial growth factor (Sasaki et al. 2010) in spinal cord or brain. Airas et al. 2015 used stereotactic injection of heat-killed bacillus Calmette- Guerin (BCG) and activation using intradermal injection of BCG in complete Freund adjuvant. In this paper we assessed a focal cortical lesion model in mouse by injecting proinflammatory cytokines in mice immunized with myelin oligodendrocyte glycoprotein (MOG). We used this focal model to study the effects of lipoic acid on brain cortical lesion.
Lipoic acid is a natural antioxidant. It suppresses and treats EAE and EAON (Chaudhary et al., 2011, Chaudhary et al., 2006, Marracci et al., 2002, Morini et al., 2004, Schreibelt et al., 2006). LA mediates its effect by inhibiting T cell migration into the CNS, decreasing endothelial cell adhesion molecule expression and reduction in MMP-9 production. The objective of this study was to determine the effects of LA on inflammatory cells in a focal cortical EAE model of MS.
2. Material and methods
2.1. EAE induction and disease scores
EAE was induced in C57BL/6 (The Jackson Laboratory, Bar Harbor, ME) female mice (8-10 weeks old). C57BL/6 were immunized with 200 μg of MOG 35–de (PolyPeptide Laboratories, San Diego, CA) in complete Freund'vant containing 400 μg of Mycobacterium tuberculosis per mouse by subcutaneous (s.c.) injection (a total volume of 0.2 ml). Pertussis toxin (List Biological Labs Inc., Campbell, CA) was administered by intraperitoneal (ip) injection at day 0 (75 ng per mouse) and day 2 (200 ng per mouse) after immunization. Mice were scored daily for EAE by using a 9-point scale as described in Forte et al., 2007
2.2 Intracerebral stereotactic injections
Unimmunized and MOG immunized mice were anaesthetized by isoflurane and mounted on a stereotactic device. A hole was drilled through the skull using co-ordinates Bregma +1mm, lateral 1mm and depth 1.05mm (©2014 Allen Institute for Brain Science. Allen Mouse Brain Atlas). Mice received intracerebral (i.c.) stereotactic injections containing cytokines or PBS. The injection of 2 μl of cytokine solution containing tumor necrosis factor -α (TNF-α; 250 ng; Sigma, St. Louis, MO) and 10,000 U of interferon- γ (IFN- γ, Sigma, St. Louis, MO) dissolved in phosphate-buffered saline (PBS) was injected slowly throughout a 5-minute period using a ultra micro- injector pump (WPI, Sarasota, FL). For control experiments mice were injected with 2μl of PBS without cytokines. Initial experiments were performed using unimmunized mice and the mice were sacrificed 3, 5 and 7 days post injection (Fig. 1 a). Maximum galectin-3 positive cells ere found 3 days post injection therefore all further experiments in unimmunized and MOG immunized mice were done at three days after cytokine injection. Unimmunized mice were sacrificed 3 days after i.c. injection (Fig. 1b). In mice immunized with MOG intra-cerebral injections were given 12 days post-immunization (Fig. 1c). Mice (unimmunized and MOG immunized) were divided in 4 groups, namely, vehicle-PBS (received vehicle s.c. and PBS i.c. injection), LA-PBS (received LA s.c. and PBS i.c. injection), vehicle-cytokine (received vehicle s.c. and cytokine i.c. injection) and LA-cytokine (received LA s.c. and cytokine i.c. injection). Intra-cerebral injections were made on one side of the brain because in some animals the inflammatory cells spread to the non-injected contralateral side of the brain. In all cases the post-surgical recovery was without incident.
Fig.1.
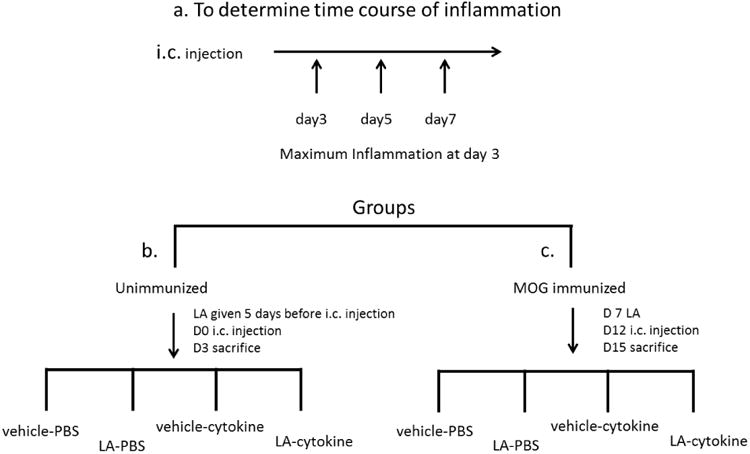
Schematic illustration of the experimental design. a. cytokines were stereotactically injected and mice were sacrificed at different times following injection. Once peak of inflammation was determined to be 3 days post cytokine injection mice were divided into two groups b. unimmunized and c. MOG immunized. Both groups were further subdivided into 4 groups vehicle-PBS (received vehicle s.c. and PBS i.c. injection), LA-PBS (received LA s.c. and PBS i.c. injection), vehicle-cytokine (received vehicle s.c. and cytokine i.c. injection) and LA-cytokine (received LA s.c. and cytokine i.c. injection).
2.3. Lipoic acid administration in mice
LA was prepared as described in Chaudhary et al. 2011. Briefly, LA (50 mg, Sigma, MO) was weighed and re-suspended in 0.35 ml 2 N NaOH. Sterile water (4.5 ml) was added and titrated with approximately 0.05 ml 10 N HCl or until LA barely precipitated. pH was adjusted to 7.2– 7.4. The solution was filter sterilized through a 0.2 μm low protein binding syringe filter and frozen in aliquots until used. 0.4 ml LA (5 mg/ml) was administered by s.c. injection (100 mg/kg). Equal volume of a normal saline solution was used as a vehicle-control. In unimmunized mice LA or vehicle was administered 5 days before i.c. injection (Fig 1b). MOG immunized mice received either daily s.c. injections of LA (100 mg/kg) or vehicle beginning on day 7 after immunization. Mice were sacrificed 15 days after immunization (Fig 1c).
2.4. Quantitative immunohistochemical studies
For quantitative immunofluorescent analyses, brain sections (30 μm) around the site of injection were collected serially and used for antibody staining. The sections were permeabilized, washed, blocked (0.5% fish skin gelatin/3% BSA) in PBS, and then incubated with primary antibody at 4 °C overnight. After incubation in secondary antibody, sections were mounted in Prolong Gold antifade and imaged using laser scanning confocal microscope system (Carl Zeiss, LSM 780, Thornwood, NY).
Primary antibodies that recognized CD4 (BD PharMingen, San Diego, CA; 1:25 dilution) and Mac-1 (CD11b; Leinco Technologies, St. Louis, MO; 1:75 dilution) were used to identify T cells and microglia/macrophage populations, respectively. Activated microglia/macrophages (R&D Systems, Minneapolis, MN; 1:50 dilution) were detected using galectin-3. Anti CD45 (BD Biosciences, San Jose, CA; 1:200 dilution) was used to distinguish between macrophages and microglia. Axonal damage was assessed by SMI312 (Covance, San Diego, CA; 1:500 dilution) and MBP (Novus Biologicals, Littleton, CO; 1:100 dilution) staining was used to evaluate demyelination. All secondary antibodies were from Invitrogen, Carlsbad, CA (1:200 dilution). Alexa Fluor 488 donkey anti-rat IgG (A21208), Alexa Fluor 488 goat anti-mouse IgG (A11029), Alexa Fluor 555 goat anti-rabbit IgG (A21428) and Alexa 546 donkey anti goat IgG (A11056) were used as the secondary antibodies. To quantify immunofluorescence, sections were imaged (10×, 20× or 40× objectives) on a Zeiss confocal microscope. Negative controls were generated by omitting the primary antibody. An additional control comprised omission of both primary and secondary antibodies.
Immunofluorescence data were analyzed 200 microns away from the injection site using quantitative methods. Data analysis was done using MetaMorph software, v7.6.3; Molecular Devices, CA. Total area corresponding to 0.25 mm2 was analyzed left and right side of injection site. Thresholding and intensity measurement methods of image analysis were used. Image analyses were done blinded to treatment. The average background fluorescence was determined. Similar methods have been used for quantification of CD4+ and CD11b+ cells in spinal cords of mice with EAE (Chaudhary et al., 2006; Forte et al., 2007; Chaudhary et al., 2011).
2.5. Statistical analyses
Statistical analyses were performed using the Mann-Whitney U-test Statistical significance was defined as p < 0.05 for all analyses.
3. Results
3.1 Injection of Proinflammatory cytokines in the brain- non-immunized mice
The formation of EAE lesions in a predetermined location was achieved by stereotactic injections of the proinflammatory cytokines, TNF-α and IFN-γ, in the cerebral cortex of B6 mice. Brain sections that contained the site of injection were analyzed after staining with antibodies against T cells, macrophages and monocytes. The site of injection was marked by heavy infiltration of inflammatory cells as evident in Figure 2, 3. Inflammation was detected by staining with anti CD4, CD11b and galectin-3. We measured the inflammation spread about 200 μm from the site of injection
Fig 2.

CD4 positive cells around site of injection. a,b unimmunized mice, c-f MOG immunized mice. a,c vehicle-PBS; b,d vehicle-cytokine; e. LA-PBS; f. LA-cytokine. Scale bar 100 microns. Notice that unimmunized mice have very few CD4 cells (a,b) as compared with MOG immunized mice (c,d). LA-PBS and LA-cytokine groups from unimmunized mice are not shown in the figure as they did not have many CD4 cells.
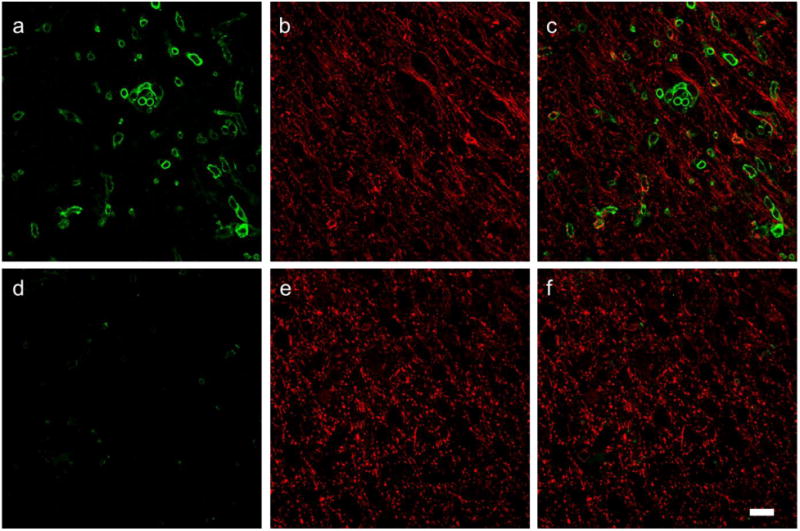
Fig. 3.
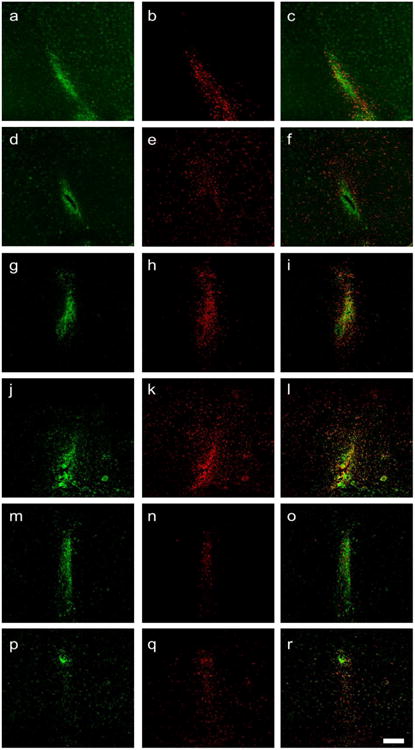
Inflammation at the site of injection in unimmunized mice (a-f) and MOG immunized mice (g-r). These sections demonstrate the high density of inflammatory cells at the site of injection. There is increased number of galectin-3 positive cells when cytokines are injected. The inflammatory cells spread beyond 200 μm from the site of injection (e). Density of galectin-3 positive cells when cytokines are injected is higher in MOG immunized animals (k) as compared to unimmunized animals (e). LA decreases the galectin-3 positive cells (q). a-c, g-i vehicle-PBS; d-f, j-l vehicle-cytokine; m-o LA-PBS; p-r LA-cytokine. CD11b is green; galectin-3 is red. Scale bar 200 μm.
In initial experiments mice were injected with either PBS and TNF- α/ IFN- γ (cytokine) and sacrificed at day 3, 5 and 7 after stereotactic injection. CD4 positive T cells were detected in the group that received cytokines (0.19% staining at day 3, 0.08% at day 5, 0.03% at day 7, n=2). Cytokine injection led to influx of galectin-3 positive cells into the brain but not in mice that received PBS. The galectin-3 positive cells peaked at day 3 (2.70% staining at day 3, 1.7% at day 5, 1.11% at day 7, n=2). We next repeated the PBS and cytokine stereotactic injection in mice but further divided them into those that received vehicle or LA subcutaneously. The results are presented in Table 1, Fig 2 a,b, Fig 3 a-f, also see supplementary Fig 1.
Table 1.
Shows the percent area stained with antibody in coronal brain sections from mice not immunized with MOG, n= 3 mice each group. These mice were injected with cytokines or PBS in the brain and did not develop the disease symptoms. Measurements were made 200 microns away from site of injection.
| Vehicle-PBS | LA-PBS | Vehicle-cytokine | LA-cytokine | |
|---|---|---|---|---|
| CD4 | 0.04 ± 0.006 | 0.06 ± 0.01 | 0.05 ± 0.01 | 0.05 ± 0.01 |
| CD11b | 1.78 ± 0.18 | 1.94 ± 0.24 | 1.05 ± 0.14 | 0.99 ± 0.12 |
| Galectin-3 | 0.02 ± 0.01 | 0.01 ± 0.01 | 1.21 ± 0.13 | 1.53 ± 0.22 |
There were hardly any CD4 cells and no galectin-3 positive cells 200 μm away from the site of injection in the group that got i.c. injections of PBS (received vehicle or LA s.c.) indicating galectin-3 to be a specific marker for spread of inflammatory cells (Table 1) after injection of cytokines. There was no significant difference in inflammatory cells in the groups that received vehicle-cytokine and LA-cytokine (Table 1).
3.2 Injection of Proinflammatory cytokines in the brain- mice immunized with MOG
Based on the findings from the cytokine injections in non-immunized mice we studied mice immunized with MOG. Immunized mice were stereotactically injected with cytokine or PBS at onset of disease at d12 and sacrificed 3 days later (Table 2). Mice immunized with MOG when injected with cytokine mixture led to a formation of a large lesion with inflammatory cells (CD4, CD11b and galectin-3 positive cells) in the cortex. The number of inflammatory cells in MOG immunized mice was much greater than unimmunized mice that received cytokine stereotactic injection (compare Fig. 2 b vs d, Fig 3 d-f vs j-l, supplementary Fig.1). In our model there is a lack of axonal and myelin injury aside from injury at injection site which occurs in mice injected with PBS and cytokines (supplementary Fig. 2).
Table 2.
Compares EAE scores from the 4 different groups. Average scores from 10 mice are represented in the table. Mice that received LA did not get sick.
| Day | Vehicle-PBS | LA-PBS | Vehicle-cytokine | LA-cytokine |
|---|---|---|---|---|
| 1 | 0 | 0 | 0 | 0 |
| 2 | 0 | 0 | 0 | 0 |
| 3 | 0 | 0 | 0 | 0 |
| 4 | 0 | 0 | 0 | 0 |
| 5 | 0 | 0 | 0 | 0 |
| 6 | 0 | 0 | 0 | 0 |
| 7 | 0 | 0 | 0 | 0 |
| 8 | 0 | 0 | 0 | 0 |
| 9 | 0 | 0 | 0 | 0 |
| 10 | 0 | 0 | 0 | 0 |
| 11 | 0 | 0 | 0 | 0 |
| 12 | 0.6 | 0 | 0.2 | 0 |
| 13 | 1.0 | 0 | 0.1 | 0 |
| 14 | 1.5 | 0 | 0.6 | 0 |
| 15 | 2.7 | 0 | 1.5 | 0 |
3.3 LA inhibits infiltration of inflammatory cells into brain lesion in mice immunized with MOG
Our previous studies have shown that LA suppresses inflammation in EAE and EAON therefore we focused on early time point (day 3 after i.c. injection) to see whether LA can inhibit inflammation in the brain with compromised blood brain barrier. As reported before, LA suppressed paralysis resulting from spinal cord lesions in EAE (Table 2). Mice that received LA did not develop disease. The clinical scores do not reflex the inflammation in the brain as the inflammatory response is mostly a result of cytokine injection. Brain sections from mice that received vehicle or LA (100mg/kg) s.c. injections and PBS or cytokine i.c. injection were analyzed. Table 3 demonstrates that LA significantly reduced CD4 positive T cells and galectin-3 positive activated microglia/macrophages after i.c. cytokine injection. The % area occupied by CD4+ T cells was 1.02 ± 0.23 in mice receiving vehicle-cytokine and 0.13 ± 0.01 in mice receiving LA-cytokine (p<0.0001). The % area with galectin-3+ microglia/ macrophages was 5.99 ± 0.49 in mice that received vehicle-cytokine and 3.31 ± 0.29 in mice that received LA-cytokine (p<0.0001) (Table 3, compare Fig. 2 d vs f; Fig 3 j-l vs p-r). Staining with CD11b did not significantly reduce in mice that received LA and i.c. cytokine injection. No significant differences in inflammatory cells were detected in vehicle-PBS and LA-PBS (Table 3, compare Fig 3 g-i and m-o)
Table 3.
Shows the percent area stained with antibody in coronal brain sections from mice immunized with MOG, n=10 mice each group. Measurements were made 200 microns away from site of injection.
| Vehicle-PBS | LA-PBS | Vehicle-cytokine | LA-cytokine | |
|---|---|---|---|---|
| CD4 | 0.11 ± 0.02 | 0.08 ± 0.02 | 1.02 ± 0.23 | 0.13 ± 0.01* |
| CD11b | 2.03 ± 0.17 | 2.31 ± 0.21 | 3.12 ± 0.38 | 2.33 ± 0.18 |
| Galectin-3 | 0.20 ± 0.04 | 0.07 ± 0.02 | 5.99 ± 0.49 | 3.31 ± 0.29* |
Mann Whitney test vehicle-cytokine vs LA-cytokine P < 0.0001
3.4 LA reduces infiltrating monocytes
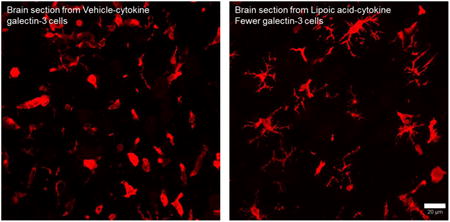
Galectin-3 positive cells could be classified into two different morphologies (Figure 4), one that did not have projections and the other had multiple projections. We measured galectin-3 positive cells with and without projections in the 4 groups (Table 4). Mice that received i.c. PBS injections did not have many galectin-3+ cells. Mice that received i.c. cytokine injection had many galectin-3 positive cells. The mice that received LA had reduced number of cells without projections. We identified these cells as infiltrating monocytes. We further stained the brain slices with anti CD45 (infiltrating monocyte/macrophage marker). LA receiving mice showed faintly labeled and reduced number of CD45 cells as compared to those that received vehicle (Figure 5).
Fig 4.
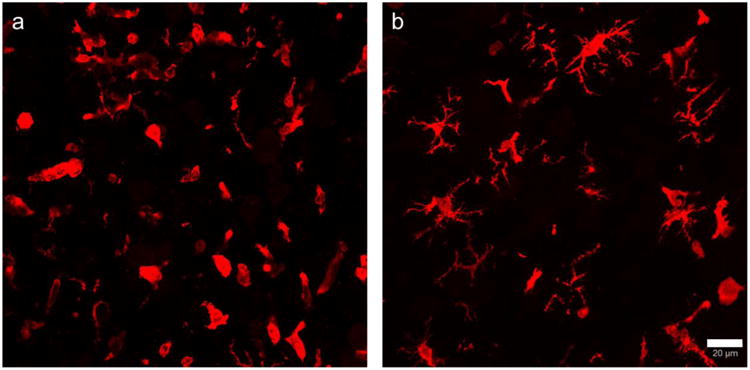
LA reduces galectin-3 positive cells without projections. A. vehicle-cytokine B. LA-cytokine. Scale bar = 20 μm.
Table 4.
Shows the number of galectin-3 positive cells.
| Cells with projections | Cells without projections | Total cells | Mice number | |
|---|---|---|---|---|
| Vehicle-PBS | 2 | 24 | 26 | 4 |
| LA-PBS | 9 | 5 | 14 | 4 |
| Vehicle-cytokine | 137 | 807 | 944 | 10 |
| LA-cytokine | 178 | 393* | 571 | 10 |
Mann Whitney test vehicle-cytokine vs LA-cytokine P < 0.0001
Fig. 5.
LA reduces infiltrating macrophages stained with anti CD45. Top panel vehicle-cytokine, bottom LA-cytokine. a,d CD45; b,e MBP; c, f overlays. Scale bar = 20 μm.
4. Discussion
We assessed changes in inflammatory cells and provide critical information on the cortical lesion dynamics. This article provides new insights about LA being effective in reducing inflammation in cortical focal EAE model. LA reduced CD4+ T cells and galectin-3+ activated microglia/macrophages in brain lesion in mice immunized with MOG and stereotactically injected with cytokines. We further demonstrate that LA reduces CD45 positive cells thus showing that infiltrating monocytes are reduced.
The model presented in this paper is similar to focal EAE model in Lewis rats that has been developed previously in spinal cord (Kerschensteiner et al., 2004) and brain (Merkler et al., 2006) by stereotactic injections of cytokines. Cytokines like TNF-α and IFN- γ are involved in the progression of neurologic disorders (Benveniste and Benos, 1995) and have been used widely to study inflammation (Gardner et al., 2013, Simmons and Willenborg, 1990, Sun et al., 2004). Not many CD4 positive cells were detected in cytokine injected unimmunized mice (Table 1; Fig.2 b). Interestingly, cytokine injection in unimminized mice caused increase in galectin-3 positive cells that was not detected when only PBS was injected in the cortex (Table 1; Fig 3 compare b,e). Significant increase in cortical inflammation was dependent on peripheral immune priming against MOG peptide as many inflammatory cells were not detected in mice where MOG priming was not done. Cytokine injection caused increase in T cell infiltration and microglial activation (Fig 2 d; Fig. 3 j-l, Table 3) in the cerebral hemispheres of MOG immunized mice. All these results indicate differences in the local inflammatory response in normal vs MOG sensitized brains. Studying the lesion 3 days after cytokine injection is similar to he biopsy samples from newly diagnosed MS cases that contain numerous infiltrating immune cells. Cortical lesions can be differentiated into active or chronic lesions on the basis of number of immune cells (Calabrese et al., 2010). The majority of phagocytic cells in cortical lesions are described to have the morphology of activated microglia and only some of these cells have morphology associated with macrophages (Peterson et al., 2001). We used galectin-3/Mac-2, a member of the galectin family of beta-galactoside binding lectins as a marker for activated microglia and macrophages (Reichert and Rotshenker, 1999). Galectin-3 is not expressed in undamaged CNS. Additionally, we demonstrate that LA reduced T cell, activated microglia and macrophages (Fig. 2 e,f, Fig 3 m-r). We classified the galectin-3 positive cells into two types based on whether or not they had projections. (Fig. 4). Based on the morphology described by Yamasaki et al., 2014 -the type with projections are probably microglia- derived macrophages and the one that do not have projections are infiltrating monocytes or monocyte- derived macrophages.
Anti CD45 was used to further distinguish between invading macrophages and microglia. CD45 is a membrane bound protein tyrosine phosphatase and is present in cells of monocyte/macrophage lineage. We confirmed the presence of CD45 positive cells in brains which were injected with cytokines and that did not receive LA (Fig. 5). LA treated mice that received cytokine injection had very few lightly stained CD45 positive cells. Thus, we provide evidence that the infiltrating monocytes/ macrophages are suppressed by lipoic acid treatment (Table 4 and Figs. 4, 5). This study provides a rationale for investigating the ability of LA to reduce development of inflammatory cortical lesions in MS. Our next steps are to understand the mechanisms of action of LA on microglia and monocytes in long term focal EAE model.
Supplementary Material
Highlights.
LA significantly reduces inflammation in a focal cortical model of MS.
Monocytes are significantly reduced around the lesion area
This study provides a rationale for investigating the ability of LA to reduce development of cortical lesions in MS.
Acknowledgments
Department of Veterans Affairs Biomedical Laboratory Research and Development, NIH R01 NS057433, NMSS Grant CA1055A, and the Laura Fund for Innovation in MS Research. We would like to express our thanks to the Advanced Light Microscopy Core (P30 NS061800) Facility at The Oregon Health & Science University.
Abbreviations
- MOG
Myelin Oligodendrocyte Glycoprotein
- CFA
complete Freund's adjuvant
- EAE
experimental autoimmune encephalomyelitis
- Ptx
pertussis
Footnotes
Publisher's Disclaimer: This is a PDF file of an unedited manuscript that has been accepted for publication. As a service to our customers we are providing this early version of the manuscript. The manuscript will undergo copyediting, typesetting, and review of the resulting proof before it is published in its final citable form. Please note that during the production process errors may be discovered which could affect the content, and all legal disclaimers that apply to the journal pertain.
References
- Airas L, Dickens AM, Elo P, Marjamäki P, Johansson J, Eskola O, Jones PA, Trigg W, Solin O, Haaparanta-Solin M, Anthony DC, Rinne J. In vivo PET imaging demonstrates diminished microglial activation after fingolimod treatment in an animal model of multiple sclerosis. J Nucl Med. 2015;56(2):305–310. doi: 10.2967/jnumed.114.149955. [DOI] [PubMed] [Google Scholar]
- Benveniste EN, Benos DJ. TNF-alpha- and IFN-gamma-mediated signal transduction pathways: effects on glial cell gene expression and function. FASEB J. 1995;9(15):1577–1584. doi: 10.1096/fasebj.9.15.8529837. Review. [DOI] [PubMed] [Google Scholar]
- Calabrese M, Filippi M, Gallo P. Cortical lesions in multiple sclerosis. Nat Rev Neurol. 2010;6(8):438–444. doi: 10.1038/nrneurol.2010.93. [DOI] [PubMed] [Google Scholar]
- Chaudhary P, Marracci GH, Bourdette DN. Lipoic acid inhibits expression of ICAM-1 and VCAM-1 by CNS endothelial cells and T cell migration into the spinal cord in experimental autoimmune encephalomyelitis. J Neuroimmunol. 2006;175:87–96. doi: 10.1016/j.jneuroim.2006.03.007. [DOI] [PubMed] [Google Scholar]
- Chaudhary P, Marracci G, Yu X, Galipeau D, Morris B, Bourdette DN. Lipoic acid decreases inflammation and confers neuroprotection in experimental autoimmune optic neuritis. J Neuroimmunol. 2011;233(1-2):90–96. doi: 10.1016/j.jneuroim.2010.12.002. [DOI] [PMC free article] [PubMed] [Google Scholar]
- Forte M, Gold BG, Marracci G, Chaudhary P, Basso E, Johnsen D, Yu X, Fowlkes J, Rahder M, Stem K, Bernardi P, Bourdette D. Cyclophilin D inactivation protects axons in experimental autoimmune encephalomyelitis, an animal model of multiple sclerosis. Proc Natl Acad Sci USA. 2007;104:7558–7563. doi: 10.1073/pnas.0702228104. [DOI] [PMC free article] [PubMed] [Google Scholar]
- Gardner C, Magliozzi R, Durrenberger PF, Howell OW, Rundle J, Reynolds R. Cortical grey matter demyelination can be induced by elevated pro-inflammatory cytokines in the subarachnoid space of MOG-immunized rats. Brain. 2013;136(Pt 12):3596–3608. doi: 10.1093/brain/awt279. [DOI] [PubMed] [Google Scholar]
- Kerschensteiner M, Stadelmann C, Buddeberg BS, Merkler D, Bareyre FM, Anthony DC, Linington C, Brück W, Schwab ME. Targeting experimental autoimmune encephalomyelitis lesions to a predetermined axonal tract system allows for refined behavioral testing in an animal model of multiple sclerosis. Am J Pathol. 2004;164(4):1455–1469. doi: 10.1016/S0002-9440(10)63232-4. [DOI] [PMC free article] [PubMed] [Google Scholar]
- Marracci GH, Jones RE, McKeon GP, Bourdette DN. Alpha lipoic acid inhibits T cell migration into the spinal cord and suppresses and treats experimental autoimmune encephalomyelitis. J Neuroimmunol. 2002;131:104–114. doi: 10.1016/s0165-5728(02)00269-2. [DOI] [PubMed] [Google Scholar]
- Merkler D, Ernsting T, Kerschensteiner M, Brück W, Stadelmann C. A new focal EAE model of cortical demyelination: multiple sclerosis-like lesions with rapid resolution of inflammation and extensive remyelination. Brain. 2006;129(Pt 8):1972–1983. doi: 10.1093/brain/awl135. [DOI] [PubMed] [Google Scholar]
- Morini M, Roccatagliata L, Dell'Eva R, Pedemonte E, Furlan R, Minghelli S, Giunti D, Pfeffer U, Marchese M, Noonan D, Mancardi G, Albini A, Uccelli A. Alpha-lipoic acid is effective in prevention and treatment of experimental autoimmune encephalomyelitis. J Neuroimmunol. 2004;148:146–153. doi: 10.1016/j.jneuroim.2003.11.021. [DOI] [PubMed] [Google Scholar]
- Peterson JW, Bo L, Mork S, Chang A, Trapp BD. Transected neurites, apoptotic neurons, and reduced inflammation in cortical multiple sclerosis lesions. Ann Neurol. 2001;50:389–400. doi: 10.1002/ana.1123. [DOI] [PubMed] [Google Scholar]
- Reichert F, Rotshenker S. Galectin-3/MAC-2 in experimental allergic encephalomyelitis. Exp Neurol. 1999;160(2):508–514. doi: 10.1006/exnr.1999.7229. [DOI] [PubMed] [Google Scholar]
- Sasaki M, Lankford KL, Brown RJ, Ruddle NH, Kocsis JD. Focal experimental autoimmune encephalomyelitis in the Lewis rat induced by immunization with myelin oligodendrocyte glycoprotein and intraspinal injection of vascular endothelial growth factor. Glia. 2010;58(13):1523–1531. doi: 10.1002/glia.21026. [DOI] [PubMed] [Google Scholar]
- Schreibelt G, Musters RJ, Reijerkerk A, de Groot LR, van der Pol SM, Hendrikx EM, Dopp ED, Dijkstra CD, Drukarch B, de Vries HE. Lipoic acid affects cellular migration into the central nervous system and stabilizes blood–brain barrier integrity. J Immunol. 2006;177:2630–2637. doi: 10.4049/jimmunol.177.4.2630. [DOI] [PubMed] [Google Scholar]
- Simmons RD, Willenborg DO. Direct injection of cytokines into the spinal cord causes autoimmune encephalomyelitis-like inflammation. J Neurol Sci. 1990;100(1-2):37–42. doi: 10.1016/0022-510x(90)90010-k. [DOI] [PubMed] [Google Scholar]
- Sun D, Newman TA, Perry VH, Weller RO. Cytokine-induced enhancement of autoimmune inflammation in the brain and spinal cord: implications for multiple sclerosis. Neuropathol Appl Neurobiol. 2004;30(4):374–384. doi: 10.1111/j.1365-2990.2003.00546.x. [DOI] [PubMed] [Google Scholar]
- Vercellino M, Plano F, Votta B, Mutani R, Giordana MT, Cavalla P. Grey matter pathology in multiple sclerosis. J Neuropathol Exp Neurol. 2005;64(12):1101–1107. doi: 10.1097/01.jnen.0000190067.20935.42. [DOI] [PubMed] [Google Scholar]
- Yamasaki R, Lu H, Butovsky O, Ohno N, Rietsch AM, Cialic R, Wu PM, Doykan CE, Lin J, Cotleur AC, Kidd G, Zorlu MM, Sun N, Hu W, Liu L, Lee JC, Taylor SE, Uehlein L, Dixon D, Gu J, Floruta CM, Zhu M, Charo IF, Weiner HL, Ransohoff RM. Differential roles of microglia and monocytes in the inflamed central nervous system. J Exp Med. 2014;211(8):1533–1549. doi: 10.1084/jem.20132477. [DOI] [PMC free article] [PubMed] [Google Scholar]
Associated Data
This section collects any data citations, data availability statements, or supplementary materials included in this article.