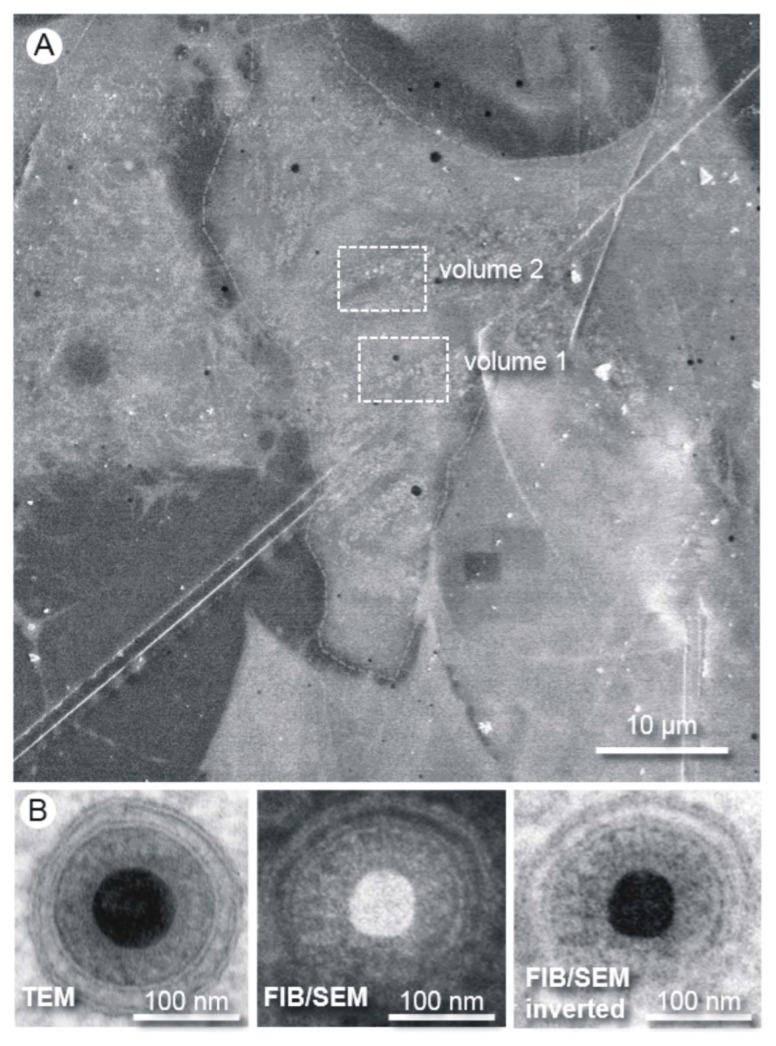
Figure 2.
Methodology and resolution of FIB/SEM tomography. (A) The Epon embedded cells are first visualized by SEM at an acceleration voltage of 10 kV. A region of interest can be easily chosen for the subsequent “slice and view” process. The boxes show the positions of the volumes chosen for FIB/SEM tomography; (B) Images of human cytomegalovirus (HCMV) particles acquired from an ultrathin section by transmission electron microscopy (TEM) and from the block face by FIB/SEM. The high resolution of the FIB/SEM image allows clear visibility of the two leaflets of the lipid bilayer. The secondary electron SEM image was acquired with an acceleration voltage of 5 kV.

