Abstract
Aim:
To determine the effects of a polyphenol-rich extract of the leaves of Vernonia amygdalina (PEVA) on the feeding pattern of rats that are exposed to cadmium (Cd) toxicity.
Materials and Methods:
Thirty male Wistar rats, weighing 160-180 g, were divided into 6 groups of 5 rats each as follows; Group 1 received distilled water orally (0.2 ml a 100 g rats), daily, throughout the period of study. Group 2 received Cd alone (in the form of CdSO4) at 5 mg/kg/day via intraperitoneal route for 5 consecutive days. Group 3 were pre-treated with Cd as Group 2 and thereafter left untreated for a period of 4-week. After the oral lethal dose of PEVA was determined, Groups 4, 5, and 6 received graded doses of PEVA at 100, 200 and 400 mg/kg/day (0.2 ml per 100 g rats), respectively via oral route for 4 weeks after they were pre-treated with Cd as Group 2. Blood samples were collected for some plasma biochemical assays while urine samples were collected using metabolic cages.
Results:
PEVA administration significantly increased (P < 0.05) the body weight and feeding patterns that were significantly reduced (P < 0.05) by Cd toxicity. PEVA also significantly reinstated the plasma antioxidant status, as well as glucose and urine volume of the rats toward control values (P < 0.05).
Conclusion:
PEVA can be an herbal alternative in the treatment or management of subjects manifesting alterations in feeding pattern and urine volume that is Cd-induced.
Keywords: Cadmium, feeding pattern, oral lethal dose, rats, polyphenol-rich extract of Vernonia amygdalina
INTRODUCTION
Cadmium (Cd) is a heavy metal that has found its relevance in various industries. It remains a source of both occupational and environmental hazard, especially in underdeveloped and developing countries where the containment of its emission is inadequate. It is readily absorbed by the body via oral route or inhalation [1]. However, it bioaccumulate once it is cleared from the blood after its absorption. This is regardless of the route of exposure. Hence, it is reputed to be a cumulative toxin [1,2]. Its ability to readily bioaccumulate in the food chain makes food consumption the main source of its exposure. This is true in the most non-smoking population [3,4].
This metal is poorly excreted from the body because it cannot be metabolically degraded to less toxic species [5]. This results in the generation of reactive oxygen species (ROS), which is known to be produced in direct proportion to the body’s inability to produce metallothionein (a Cd carrier-protein) [2,6-8]. Consequently, Cd induces a deleterious alteration in the functionality of biological systems. Therefore, scientific interest is stimulated toward studying its biohazardous effects and possible ways of ameliorating and or preventing its toxic effects.
Polyphenols are potent naturally occurring antioxidants of dietary sources, e.g., vegetables, cereals and dry legumes [9,10]. Although antioxidant vitamins, minerals and carotenoids were the most studied antioxidants by nutritionists, the health benefits of dietary polyphenols have become an interesting area of scientific exploration in recent times due to their health-promoting and chronic degenerative disease-preventing potentials [11]. It is not unlikely that the biological effects of polyphenols may extend well beyond the modulation of oxidative stress [12]. Vernonia amygdalina is reputed for its many medicinal benefits some of which are anti-inflammatory, antimicrobial and immune system-strengthening potentials [13] as well as its use in the treatment of several gastrointestinal tract disorders in patients with emesis, dysentery and loss of appetite-induced Ambrosia [14]. Most literature attributes these health benefits to the presence of polyphenols in its extract. Due to dearth of literature on the effects of the polyphenol-rich extract on Cd-induced toxicity; it was of interest to study the effects of the extract on Cd-induced alterations in feeding pattern using rat model.
MATERIALS AND METHODS
Materials
Fresh leaves of V. amygdalina were harvested from a garden in Ile-Ife, Osun State, Nigeria and certified by a Taxonomist in the Department of Botany, Obafemi Awolowo University (OAU), Ile-Ife, Osun State, Nigeria.
CdSO4 was purchased from Guangzhou Fischer Chemical Co., Ltd, Guangdong, China. Acetone used for this study was purchased from Crescent Chemical Co., Inc, New York, United States. Metabolic cages used was Ohaus R Model; Ohaus, Pine Brook, New Jersey, USA. Standard Laboratory kit for glucose assay was purchased from Randox Laboratories Limited, United Kingdom.
Extraction of Polyphenols
The procedure for obtaining polyphenol-rich extract of leaves of V. amygdalina (PEVA) was carried out using standard protocol and as described by Mutiu et al. [15] and Comfort et al. [16]; V. amygdalina leaves were air-dried and pulverized with an electric pulverizer (DIK-2910, Daiki Rika Kogyo Co. Ltd, Tokyo-Japan). The pulverized leaves were weighed, and the value was recorded. This was further crushed in 80% acetone (1:2 w/v) using a Waring blender (Waring Commercial, Torrington, CT). The sample was homogenized in a Polytron Homogenizer (Glen Mills Inc., Clifton, NJ) for 3 min, and the homogenates were filtered under vacuum using Buchner funnel and Whatman number 2 filter paper (Whatman PLC, Middlesex, UK). The filtrate was concentrated under vacuum using a rotary evaporator (HahnShin Scientific, HS-2005-N) and freeze-dried in a Lyophilizer (Ilshin Lab. Co. Ltd, Seoul, Republic of Korea). The powdered yield that was obtained (PEVA) was weighed and kept in a desiccator until when needed. The percentage (%) yield of PEVA was calculated as shown below;
% yield of PEVA = yield of PEVA ÷ weight of pulverized leaves × 100% [17]
The extraction process was repeated for three different samples and the final % yield of PEVA was expressed as mean ± standard error of the mean (SEM) (n = 3).
Determination of Total Phenol and Total Flavonoids Content
The total phenol and total flavonoids in the leaf extract were determined using the procedures described below:
The total phenols content of the leaf extract was determined by the method of Singleton and Rossi [18] and as described by Gulcin et al. [19] using Folin–Ciocalteu’s phenol reagent which is an oxidizing reagent. 0.2 ml of Folin–Ciocalteu’s phenol reagent was added to a mixture of 0.1 ml of the sample and 0.9 ml of distilled water (DW). The resulting mixture was voltexed. After 5 min of standing, 1.00 ml of 7 % (w/w) Na2CO3 solution was added and thereafter made up to 2.5 ml with DW before incubation for 90 min at room temperature. Using an ultraviolet (UV)-Vis spectrophotometer (Labtronics, India; Model LT-290), the absorbance was read at a wavelength of 750 nm against a negative control containing 1 ml of DW. The gallic acid equivalent (GAE) of the extract was determined using gallic acid at 0.1 mg/ml as a standard, after preparing a calibration curve.
Total flavonoids content of the leaf extract was determined using aluminum chloride colorimetric assay method according to Zhilen et al. [20] and as described by Miliauskas et al. [21]. Standard quercetin with varying concentrations 0.1, 0.2, 0.3, 0.4 and 0.5 mg/ml was used as standard in comparison to the sample extract. 0.4 ml of DW was added to 0.1 ml of the extract/standard, followed by 0.1 ml of 5% sodium nitrate solution. After 5 min, 0.1 ml of 10% aluminum chloride, and 0.2 ml of sodium hydroxide solutions were added to the resulting mixture after which the volume was made up to 2.5 ml with DW. Against blank, the absorbance, at a wavelength of 510 nm, was read using a UV-Vis spectrophotometer (Labtronics, India; Model LT-290).
The tests to determine the aforementioned phytochemicals were performed in triplicate, and the final results were expressed as mg quercetin/GAE a gram of the leaf extract using the formula below;
X = q (V/w)
X = total content of flavonoids or phenolic compound in quercetin or GAE, respectively; q = concentration of quercetin or gallic acid established from the standard curve; V = volume of the extract (ml); and w = weight of the sample extract [19,21].
Determination of Oral Lethal Dose (LD50) of PEVA
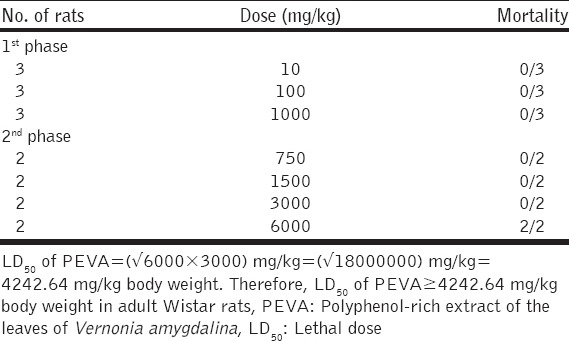
The oral LD50 of PEVA was determined by a modification of the procedure outlined by Lorke, 1983 [22]. Lorke’s method proposes a total of 13 animals; 9 animals for the first phase and 4 animals for the second phase. However, a total of 17 adult Wistar rats were used for this study. In the initial phase of the experiment, 9 rats were divided into 3 groups of 3 rats each and were treated with PEVA at graded doses of 10, 100 and 1000 mg/kg, orally. The rats were observed for 24 h. In the second phase, 8 rats were divided into 4 groups of 2 rats each and were treated with PEVA at 750, 1500, 3000, and 6000 mg/kg, orally. They were also examined for 24 h, and the LD50 was determined using the formula;

Where, a= least dose that killed a rat; and b = highest dose that did not kill any rat.
Solutions of PEVA and Cd Salt
The choice of therapeutic doses of PEVA was guided by the predetermined oral LD50 of PEVA; these were taken to be s10% of oral LD50. Thus, doses of 100, 200 and 400 mg/kg of PEVA were prepared as follows; 1 g of PEVA was dissolved in 20 ml of DW to prepare a stock solution of 100 mg/kg of PEVA. Stock solutions of 200 and 400 mg of PEVA were prepared by each dissolving 2 g and 4 g of PEVA in 20 ml of DW, respectively. The rats received 0.2 ml/100 g of PEVA, orally. Samples were stored in a deep-freezer after use while fresh samples were prepared every 48 h.
A 50 mg of Cd sulfate salt was dissolved in 20 ml of DW and was administered to the rats at 0.2 ml/100 g. Therefore, each rat received 5 mg/kg/day of Cd solution for 5 consecutive days, via intraperitoneal route (i.p.).
Animal Management and Experimental Design
A total of 30 male Wistar rats, weighing 160-180 g, were used in this study. They were purchased from the Animal Holdings of the College of Health Sciences, OAU, Ile-Ife, Osun State, Nigeria where the study was carried out. Each rat was housed in a separate metabolic cage (to assess their food consumption, water intake, and urine volume) under natural light/dark cycle and allowed to have access to standard laboratory rat chow (Caps Feed PLC Osogbo, Nigeria) and water ad libitum. The rats were allowed to acclimatize in the metabolic cage for 2 weeks before the commencement of this study, to allow for adaptation to life in a metabolic cage. All experimental protocols were in strict compliance with the guidelines for animal research, as detailed in the NIH Guidelines for the Care and Use of Laboratory Animals (National Academy of Sciences and National Institutes of Health Publications, 2011) and approved by local Institutional Research Committee.
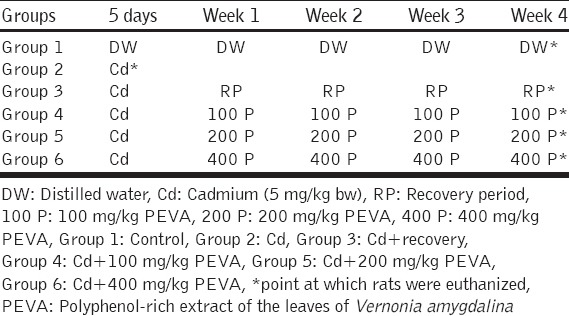
The rats were divided into six groups of 5 rats each as follows; Group 1 (Control group) received DW orally (0.2 ml per 100 g rats), daily, throughout the course of the study (4 weeks). Group 2 (toxic control) received Cd alone at 5 mg/kg/day via intraperitoneal route for 5 consecutive days. Group 3 (toxic recovery group) were pre-treated with Cd as Group 2 and thereafter left untreated for a period of 4-week. Groups 4, 5, and 6 were also pre-treated with Cd as Group 2 and, thereafter, received graded doses of PEVA at 100, 200 and 400 mg/kg/day, respectively, via oral route for a period of 4-consecutive weeks. 24 h after last administration of Cd (in Group 2), PEVA (in Groups 4, 5, and 6) and after the recovery period (in Group 3), rats were euthanized, and blood samples were collected by cardiac puncture into separate ethylenediaminetetraacetic acid bottles. These were centrifuged at 4000 rpm for 15 min at –4°C, using cold centrifuge (Centurium Scientific, Model 8881). Plasma obtained was collected into separate plain bottles for the assessment of biochemical assays such as activities of thiobarbituric acid reactive substances (TBARS), levels of reduced glutathione (GSH), as well as glucose determination in both plasma and urine of the rats. The experimental design is as depicted in Table 1.
Table 1.
Experimental design
Measurement of Body Weight
Weekly body weight of the rats was determined with the aid of a digital weighing balance (Hanson, China) to assess weekly weight gain or loss.
Measurement of Food Consumption, Water Intake, and Urine Volume
With the aid of metabolic cages, the food consumption, water intake and urine volume for each rat in the groups were determined. Water intake and urine volumes were measured with the aid of a measuring cylinder (Volac, Great Britain) while the food consumption was measured with the aid of a digital weighing balance (Hanson, China). Urine volumes were read off directly with the aid of the measuring cylinder while both water intake and food consumptions were measured by subtracting the final amount (of food or water) obtained from the initial amount that was measured a day before. The value obtained was taken to be the amount consumed by each rat.
Biochemical Assay
Both plasma and urine glucose levels were estimated using standard laboratory protocols, as provided by Randox Laboratories Limited, United Kingdom.
Non-enzymatic Antioxidant Assay
GSH levels were measured by the method of Beutler and Kelly [23]. 1 ml of plasma was added to 0.5 ml of Ellman’s reagent (10 mM). 2 ml of phosphate buffer (0.2 M, pH 8.0) was, thereafter, added. The yellow color developed was read at 412 nm against blank containing 3.5 ml of phosphate buffer. A series of standards were also treated similarly, and the amount of GSH was expressed in µg/mg tissue.
Lipid Peroxidation Assay
TBARS levels were determined by the method of Ohkawa et al., 1979 [24]. To each 0.5 ml of plasma was added 0.5 ml of phosphate buffer (0.1 M, pH 8.0) and 0.5 ml of 24% tricyclic antidepressant. The resulting mixture was incubated at room temperature for 10 min, followed by centrifugation at 2000 rpm for 20 min. To 1 ml of resulting supernatant was added 0.25 ml of 0.33% TBA in 20% acetic acid and the resulting mixture was boiled at 95°C for 1 h. The resulting pink color product was cooled, and absorbance was read at 532 nm (extinction coefficient of TBARS; e532 = 1.53 × 10⁵ M–1cm–1).
Statistical Analysis
The results obtained were collated and expressed as mean ± SEM and subjected to one-way Analysis of Variance. The data were further subjected to a post-hoc test using Student Neumann Keuls’ method, and differences with probability values of P < 0.05 were considered statistically significant. The statistical analysis was carried out with the aid of GraphPad Prism 5.03 (GraphPad Software Inc., CA, USA) and Microsoft Office Excel, 2007 package.
RESULTS
Percentage (%) Yield of PEVA
The result obtained showed that 300 g of air-dried and pulverized leaves of V. amygdalina produced a percentage (%) yield of 8.74 ± 0.40 of PEVA [Table 2].
Table 2.
Percentage yield of PEVA

Total Phenolics and Total Flavonoids Content of the Leaf Extract
These were determined to be 681.70 ± 4.70 mg of GAE/g of the leaf extract and 23.70 ± 1.80 mg of quercetin equivalent/g of the leaf extract [Table 3].
Table 3.
Total phenol and total flavonoids content of the leaf extract

Acute Oral Toxicity Test (LD50) of PEVA
The oral LD50 of PEVA was determined to be ≥ 4242.64 mg/kg body weight in adult Wistar rats [Table 4].
Table 4.
Acute oral toxicity test (LD50) of PEVA
Water Intake and Urine Volume (ml)
During 5 days of Cd intoxication, the experimental groups recorded a significant decrease (P < 0.05) in water intake when compared with their respective baseline and control group [Figure 1]. At week 1 of the study, there was a significant decrease in water intake in the Cd + recovery group (–2.90 ± 0.58 ml) when compared with the groups that were treated with graded doses of PEVA (Group 4 = 8.00 ± 0.07 ml; Group 5 = 5.60 ± 0.80 ml; Group 6 = 7.90 ± 0.12 ml), with reference to the level of alteration that was recorded after Cd toxicity. The Cd + recovery group recorded water intake of over five-fold lower than groups that were treated with PEVA. However, with reference to the alteration that was recorded from baseline levels, the PEVA treated groups recorded significant increase in water intake (Group 4 = –0.40 ± 0.07; Group 5 = –0.20 ± 0.03; Group 6 = –5.0 ± 0.4) when compared with the Cd + recovery group (–6.8 ± 0.10) (P > 0.05) at week 4 post-Cd intoxication.
Figure 1.
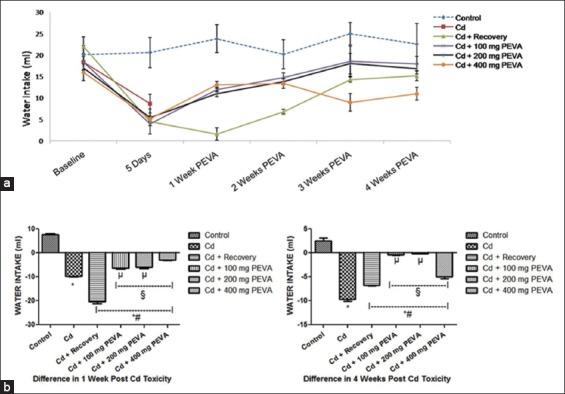
(a) Effect of polyphenol-rich extract of the leaves of Vernonia amygdalina (PEVA) on the water intake of rats with Cd-induced toxicity. (b) Differences in the water intake (ml) of control and PEVA-treated groups, during weeks 1 and 4 post-Cd toxicity with reference to baseline values. Each value represents mean ± standard error of mean (n = 5); *significantly different from Control Group (P < 0.05); #significantly different from Cd group; §significantly different from Cd + recovery group (P < 0.05); µ: significantly different from Cd + 400 mg PEVA group (P < 0.05)
There was a non-corresponding and significant increase (P < 0.05) in the urine volume of rats during the period of Cd intoxication in the experimental groups when compared with the control group and the respective baselines [Figure 2]. There was a significant increase in the urine volume of rats in the Cd + recovery group (1.67 ± 0.12 ml) when compared with the PEVA-treated groups (Group 4 = 0.7 ± 0.14 ml; Group 5 = –0.81 ± 0.14 ml; Group 6 = 0.8 ± 0.13 ml) over the 4-week study period. At weeks 1 and 4 post-Cd toxicity, PEVA treated groups showed significant degree (P < 0.05) of reversal in the alterations in urine volume of the rats when compared with the Cd + recovery group [Figure 2].
Figure 2.
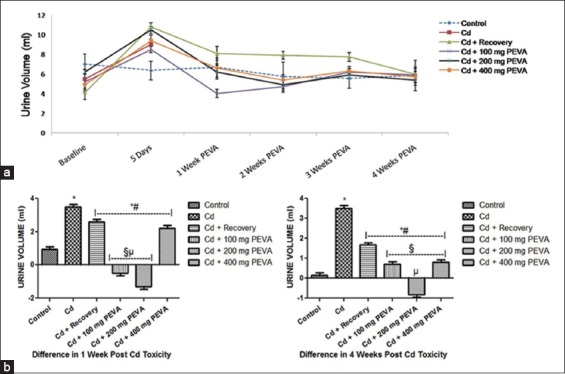
(a) Effect of polyphenol-rich extract of the leaves of Vernonia amygdalina (PEVA) on the urine volume of rats with Cd-induced toxicity. (b) Differences in the urine volume (ml) of control and PEVA-treated groups, during weeks 1 and 4 post-Cd toxicity with reference to baseline values. Each value represents mean ± standard error of mean (n = 5); *significantly different from Control Group (P < 0.05); #significantly different from Cd group; §significantly different from Cd + recovery group (P < 0.05); µ: significantly different from Cd + 400 mg PEVA group (P < 0.05)
Food Consumption and Body Weight (g)
There was a significant decrease (P < 0.05) in food consumption (about –67.72 ± 3.76%) in the Cd-treated groups during the period of exposure to Cd toxicity when compared with the control group and their respective baselines [Figure 3]. This was marked by a corresponding and significant decrease in body weight (about –19.55 ± 0.83%) (P < 0.05) in the Cd-treated groups when compared with their respective baselines at day 5 of the study [Figure 4]. PEVA administration was found to correct these Cd-induced aberrations toward baseline values in the order 200 mg > 100 mg > 400 mg per kg body weight over the 4-week study period.
Figure 3.
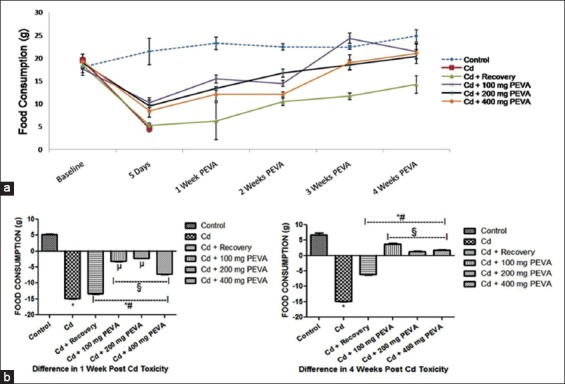
(a) Effect of polyphenol-rich extract of the leaves of Vernonia amygdalina (PEVA) on the food consumption of rats with Cd-induced toxicity. (b) Differences in the food consumption (g) of control and PEVA-treated groups, during weeks 1 and 4 post-Cd toxicity with reference to baseline values. Each value represents mean ± standard error of mean (n = 5); *significantly different from control group (P < 0.05); #significantly different from Cd group; §significantly different from Cd + recovery group (P < 0.05); µ: significantly different from Cd + 400 mg PEVA group (P < 0.05)
Figure 4.
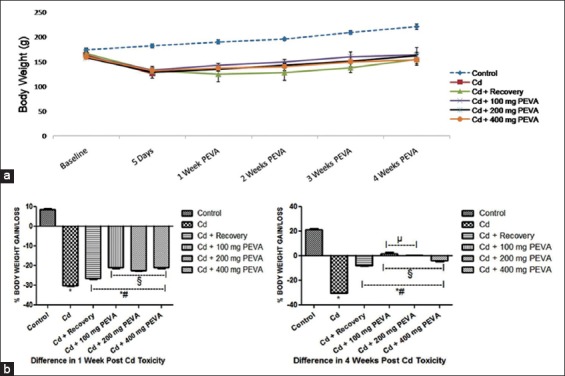
(a) Effect of polyphenol-rich extract of the leaves of Vernonia amygdalina (PEVA) on the body weight of rats with Cd-induced toxicity. (b) Differences in the % body weight gain/loss of control and PEVA-treated groups, during weeks 1 and 4 post-Cd toxicity with reference to baseline values. Each value represents mean ± standard error of mean (n = 5); *significantly different from control group (P < 0.05); #significantly different from Cd group; §significantly different from Cd + recovery group (P < 0.05); µ: significantly different from Cd + 400 mg PEVA group (P < 0.05)
PEVA treated groups recorded a significant increase (P < 0.05) in total food consumption (Group 4 = 3.80 ± 0.17; Group 5 = 1.40 ± 0.15; Group 6 = 1.80 ± 0.16) when compared with Cd group (–14.90 ± 0.15) and Cd + recovery group (–6.20 ± 0.13). Furthermore, there was a significant increase in total food consumption in Cd + recovery group (–7.74 ± 0.60) when compared with Cd group (–30.15 ± 0.20). However, the experimental groups recorded a significant decrease in total food consumption when compared with the control group (6.80 ± 0.60) [Figure 3].
PEVA treated groups recorded a significant increase (P < 0.05) in the % body weight gain of the rats (Group 4 = 1.83 ± 0.90; Group 5 = 0.40 ± 0.07; Group 6 = –3.89 ± 0.70) when compared with Cd group (–30.15 ± 0.20) and Cd + recovery group (–7.74 ± 0.60) at week 4 post-Cd toxicity [Figure 4]. Furthermore, there was significant increase in the % weight gain that was recorded in the Cd + recovery group (–6.20 ± 0.13) when compared with Cd group (–14.90 ± 0.15) during the same period. However, the rats in the experimental groups recorded a significant decrease in total food consumption at the end of the study period when compared with the control group (21.27 ± 0.60).
Plasma and Urine Glucose (mg/dl)
Plasma glucose level in Cd group (311.87 ± 1.36) was significantly increased (P < 0.05) when compared with that of the control group (115.31 ± 1.86). Although Cd + recovery group recorded a significant decrease (219.65 ± 2.85) when compared with Cd group (311.87 ± 1.36), this was found to be significantly higher than that of the control group (115.31 ± 1.86). The PEVA-treated groups (Group 4 = 110.10 ± 2.02; Group 5 = 101.28 ± 2.09; Group 6 = 100.97 ± 2.08) recorded significant a significant decrease in plasma levels of glucose when compared with the Cd + recovery group at the end of the study period [Table 5].
Table 5.
Changes in plasma and urine glucose level in rats exposed to Cd toxicity
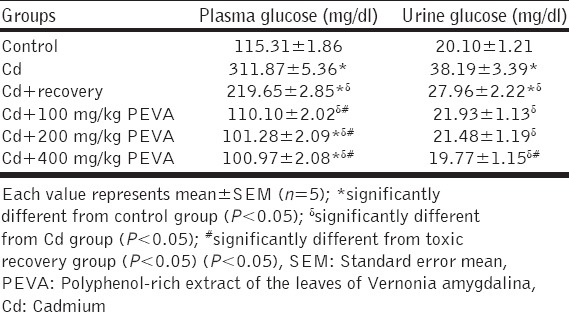
Significant increase in urine glucose level was recorded in Cd group (38.19 ± 1.39) when compared with the control group (20.10 ± 1.21) (P < 0.05). Cd + recovery group (27.96 ± 1.22) recorded no significant difference when compared with the control group (20.10 ± 1.21). The data obtained showed significant increase in urine glucose level in the Cd + recovery group (27.96 ± 1.22) when compared with the groups that received graded doses of PEVA (Group 4 = 21.93 ± 1.13); Group 5 = 21.48 ± 1.19; Group 6 = 19.77 ± 1.15) at the end of the study period. There was no significant difference (P > 0.05) between the control group and groups that received graded doses of PEVA [Table 5].
Non-enzymatic Antioxidant Status (GSH) (µg/mg Protein)
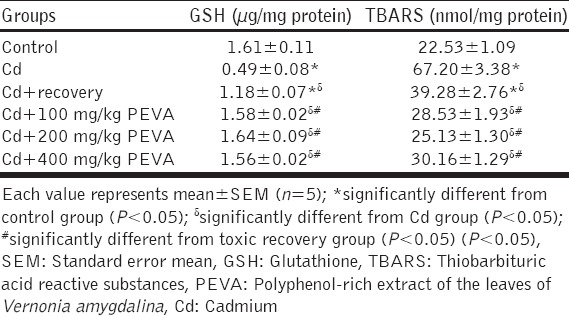
There was a significant decrease (P < 0.05) in plasma GSH levels in Cd group (0.49 ± 0.08) when compared with the control group (1.61 ± 0.11). Cd + recovery group (1.18 ± 0.07) recorded significant increase in plasma GSH level when compared with Cd group. Also, a significant increase in plasma GSH level was recorded in the PEVA-treated groups (Group 4 = 1.58 ± 0.02; Group 5 = 1.64 ± 0.09; Group 6 = 1.56 ± 0.02) when compared with Cd + recovery group (1.18 ± 0.07). There was no significant difference (P > 0.05) in the plasma GSH level of groups 4 to 6 when compared with the control group (1.61 ± 0.11) [Table 6].
Table 6.
Changes in plasma levels of reduced GSH and levels of in rats exposed to Cd toxicity
Measurement of Lipid Peroxidation (TBARS) (nmol/mg Protein)
The plasma TBARS level was significantly increased (P < 0.05) by Cd toxicity. Cd group (67.20 ± 3.38) recorded significant increase in plasma TBARS level when compared with the control group (22.53 ± 1.09). Cd + recovery group (39.28 ± 2.76) recorded a significant decrease in plasma TBARS level when compared with Cd group, and significant increase when compared with the control group (22.53 ± 1.09). There was no significant difference (P > 0.05) in plasma TBARS level of the PEVA-treated groups (Group 4 = 28.53 ± 1.93; Group 5 = 25.13 ± 1.30; Group 6 = 30.16 ± 1.29) when compared with the control group [Table 6].
DISCUSSION
The study demonstrated that Cd toxicity induced significant deleterious alteration in the feeding patterns, urine volume as well as significant disturbance of plasma antioxidant status and glucose homeostasis in a rat model. This is the first report on in vivo biological effects of PEVA.
The significant reduction in food consumption and water intake can be attributed to the lethargy that was observed (physical examination) during the period of exposure to Cd toxicity. Furthermore, the desire for food reduces with increasing blood glucose levels [25-27]. It is unknown whether certain intermediary factors or sensing of declining blood glucose by glycostat neurons in the brain is responsible for hunger [28]. The hyperglycemia that was observed suggests that Cd toxicity is associated with reduced body glucose tolerance. This, possibly, could have created a false sensation of satisfaction in the rats; the mechanism of which is subject to further investigation. This observation is similar to the findings of Merali and Singhal [29] on sub-acute Cd treatment in rats. They reported that Cd intoxication potentiates significant disturbance in glucose homeostasis. This was found to be associated with the suppression of insulin release, decrease in hepatic glycogen content and enhancement of hepatic gluconeogenic enzymes, with consequent decrease in glucose tolerance. The decrease in body weight can be attributed to the decrease in food consumption that was observed; since a balance between dietary intake and energy expenditure is the determinant for weight gain or loss [28]. Administration of PEVA for the study period significantly reversed the alteration in the aforementioned indices. The study, therefore, demonstrates the potential of PEVA to (both) increase the body’s glucose tolerance and restore body glucose homeostasis.
Solute load and osmolality of medullary interstitium are some basic determinants of urine volume or flow rate [30]. Significantly increased volumes of urine output during Cd toxicity can be attributed to the corresponding hyperglycemia that was recorded. Since glucose is an osmotically active substance [31], there may have been osmotic diuresis during this period. It is evident from the study that one of the mechanisms by which Cd-induced glycosuria was by reducing the body’s glucose tolerance with consequent hyperglycemia. Subject to further investigation and verification, other mechanisms could be saturation of glucose transporters (particularly in the kidney) and or reduced sensitivity of these transporters to the available glucose in urine; since targeting the baso-lateral membranes and brush border transporters of the kidneys are characteristic of Cd toxicity [32]. It is noteworthy to state that the Cd-induced hyperglycemia and glycosuria were significantly reversed in the PEVA-treated groups at a dose level of 100 mg/kg when compared with the control group while an increased risk profile of PEVA was observed to be associated with higher doses which recorded a dose-dependent decline in both plasma and urine glucose levels below control values. PEVA administration was found to have significantly ameliorated the Cd-induced glycosuria in a dose-dependent fashion. This further suggests that PEVA administration has a significant effect on body glucose homeostasis.
GSH is a non-enzymatic antioxidant index while TBARS is an index of lipid peroxidation and oxidative stress [33]. The findings on plasma GSH levels and TBARS activities support the reports of Tariq, 2014; Karabulut et al., 2008; Pari and Murugavel, 2005 [34-36]. The significant reduction in GSH levels following Cd intoxication could be attributed to the increased use of GSH (by the body tissues) to mop up ROS that may have been generated following Cd intoxication, possible-decreased tissue production of GSH, and/or direct binding of Cd to the peptide’s (GSH) active site. The increased activities of TBARS that were observed in the plasma of rats during Cd toxicity indicated a high degree of lipid peroxidation and oxidative stress. Although indirectly involved in the generation of free radicals, lipid peroxidation is considered a primary mechanism for Cd-induced toxicity [37-40]. The toxic effects of Cd are exerted through oxidative damage to cellular organelles by inducing the generation of ROS [41], which consist mainly of O2+, H2O2–and OH+[42]. Altered antioxidant system, lipid peroxidation, damage to membrane proteins, alterations to DNA and gene expression as well as apoptosis are some of the reactions of cellular biomolecules to these ROS [41,43]. The ability of Cd to potentiate the generation of free radicals gives a clue to the possibility of ameliorating its toxicity with potent antioxidants. PEVA administration to Cd-intoxicated rats reinstated the GSH levels along with the attenuation of the significantly altered TBARS activities in the plasma. This can be attributed to the ability of PEVA to counteract the aforementioned mechanism of Cd interaction with cellular biomolecules. Hence, the result of this study demonstrated PEVA as a potent antioxidant.
Although there are apparent benefits associated with PEVA administration, a high-risk profile is not unlikely at higher doses, as depicted by some of the indices such as total weight gain/loss as well as both plasma and urine glucose levels at the end of the study period. This could be a pointer to the fact that prolonged administration of high doses can potentiate deleterious health effects. This study recorded increased risk profile of PEVA at a dose level of 400 mg/kg which is associated with duration of administration. There should, therefore, be balance between the choice of therapeutic dose and duration of PEVA administration in order to maximize its possible health benefits.
CONCLUSION
In conclusion, the outcome of the study suggests that PEVA can be an herbal alternative in the treatment or management of subjects manifesting alterations in feeding pattern, glucose homeostasis and urine volume that is Cd-induced. Nevertheless, a high-risk profile at high doses is not unlikely.
To better understand the health benefits of dietary polyphenols, it is important to appreciate a proper classification of their considerable chemical complexity and diversity so that isolated forms can be extensively studied.
ACKNOWLEDGMENTS
The authors appreciate Mrs. Olatoye T. R., Department of Medical Pharmacology and Therapeutics OAU, Ile-Ife; Mr. K. Ilesanmi, Department of Physiological Sciences, OAU Ile-Ife; and Dr. E.M. Obuotor, Department of Biochemistry, OAU Ile-Ife for their excellent technical assistance.
Footnotes
Source of Support: Nil
Conflict of Interest: None declared.
REFERENCES
- 1.Agency for Toxic Substance and Disease Registry (ATSDR). Cadmium toxicity: What is the biological fate of cadmium in the body? Environ Health Med Educ 2008. [Last accessed on 2015 Oct 18]. Available from: http://www.atsdr.cdc.gov/csem/csem.asp?csem=6& po=9 .
- 2.Medical Disability Advisor. Toxic effects, cadmium. 2015. [Last accessed on 2015 Oct 18]. http://www.mdguidelines.com/toxic-effects-cadmium .
- 3.European Food Safety Authority (EFSA). Cadmium in food - Scientific opinion of the panel on contaminants in the food chain. EFSA J. 2009. [Last accessed on 2015 Oct 18]. Available from: http://www.efsa.europa.eu/en/efsajournal/pub/980 .
- 4.WHO. Preventing disease through healthy environments, exposure to cadmium: A major public health concern. Geneva: WHO; 2010. [Google Scholar]
- 5.Waalkes MP. Cadmium carcinogenesis. Mutat Res. 2003;533:107–20. doi: 10.1016/j.mrfmmm.2003.07.011. [DOI] [PubMed] [Google Scholar]
- 6.Lu J, Jin T, Nordberg G, Nordberg M. Metallothionein gene expression in peripheral lymphocytes and renal dysfunction in a population environmentally exposed to cadmium. Toxicol Appl Pharmacol. 2005;206:150–6. doi: 10.1016/j.taap.2004.12.015. [DOI] [PubMed] [Google Scholar]
- 7.Honey S, Neetu R, Blessy BM. The characteristics, toxicity and effects of cadmium. Int J Nanotechnol Nanosci. 2015;3:1–9. [Google Scholar]
- 8.Li Y, Yang H, Liu N, Luo J, Wang Q, Wang L. Cadmium accumulation and metallothionein biosynthesis in cadmium-treated freshwater mussel Anodonta woodiana. PLoS One. 2015;10:e0117037. doi: 10.1371/journal.pone.0117037. [DOI] [PMC free article] [PubMed] [Google Scholar]
- 9.Wang S, Moustaid-Moussa N, Chen L, Mo H, Shastri A, Su R, et al. Novel insights of dietary polyphenols and obesity. J Nutr Biochem. 2014;25:1–18. doi: 10.1016/j.jnutbio.2013.09.001. [DOI] [PMC free article] [PubMed] [Google Scholar]
- 10.European Food Information Council (EUFIC) Polyphenols. 2015. [Last accessed on 2015 Oct 18]. Available from: http://www.eufic.org/article/en/artid/Polyphenols/
- 11.Kamboh AL, Arain MA, Mughal JM, Zaman A, Arain MZ, Soomro AH. Flavonoids: Health promoting phytochemicals for animal production - A review. J Anim Health Prod. 2015;3:6–13. [Google Scholar]
- 12.Scalbert A, Johnson IT, Saltmarsh M. Polyphenols: Antioxidants and beyond. Am J Clin Nutr. 2005;81(1 Suppl):215S–7. doi: 10.1093/ajcn/81.1.215S. [DOI] [PubMed] [Google Scholar]
- 13.Munaya C. Bitter leaf-based extracts cures hepatitis co-inferation and others. The Guardian Newspaper. 2013 Jul 25; [Google Scholar]
- 14.Agbogidi OM, Akpomorine MO. Health and nutritional benefits of bitter leaf (Vernonia amygdalina del) Int J. A.PS.BMS Hetero Group J. 2013;2:164–70. [Google Scholar]
- 15.Kazeem MI, Akanji MA, Yakubu MT, Ashafa AO. Protective effect of free and bound polyphenol extracts from ginger (Zingiber officinale Roscoe) on the hepatic antioxidant and some carbohydrate metabolizing enzymes of streptozotocin-induced diabetic rats. Evid Based Complement Alternat Med 2013. 2013:935486. doi: 10.1155/2013/935486. [DOI] [PMC free article] [PubMed] [Google Scholar]
- 16.Comfort FF, Chibuike CU, Rotimi EA. Antioxidant properties of chlorophyll-enriched and chlorophyll-depleted polyphenolic fractions from leaves of Vernonia amygdalina and Gongronema latifolium. Food Res Int. 2011;44:2435–41. [Google Scholar]
- 17.Online Math Learning.com. Percentage yield and percentage purity. 2015. [Last accessed on 2015 Sep 29]. Available from: http://www.onlinemathlearning.com/percent-yield.html .
- 18.Singleton VL, Rossi JA. Colorimetry of total phenolics with phosphomolybdic-phosphotungstic acid reagents. Am J Enol Viticult. 1965;16:144–58. [Google Scholar]
- 19.Gulcin I, Oktay M, Kirecci E, Kufrevioglu OI. Screening of antioxidant and antimicrobial activities of anise (Pimpinella anisum L.) seed extracts. Food Chem. 2003;83:371–82. [Google Scholar]
- 20.Zhilen J, Mengeheng T, Jianming W. The determination of flavonoids contents in mulberry and their scavenging effects on superoxide radicals. Food Chem. 1999;64:555–9. [Google Scholar]
- 21.Miliauskas G, Venskutonis PR, van Beek TA. Screening of radical scavenging activity of some medicinal and aromatic plant extracts. Food Chem. 2004;85:231–7. [Google Scholar]
- 22.Lorke D. A new approach to practical acute toxicity testing. Arch Toxicol. 1983;54:275–87. doi: 10.1007/BF01234480. [DOI] [PubMed] [Google Scholar]
- 23.Beutler E, Duron O, Kelly BM. Improved method for the determination of blood glutathione. J Lab Clin Med. 1963;61:882–8. [PubMed] [Google Scholar]
- 24.Ohkawa H, Ohishi N, Yagi K. Assay for lipid peroxides in animal tissues by thiobarbituric acid reaction. Anal Biochem. 1979;95:351–8. doi: 10.1016/0003-2697(79)90738-3. [DOI] [PubMed] [Google Scholar]
- 25.Andrews JM, Rayner CK, Doran S, Hebbard GS, Horowitz M. Physiological changes in blood glucose affect appetite and pyloric motility during intraduodenal lipid infusion. Am J Physiol. 1998;275:G797–804. doi: 10.1152/ajpgi.1998.275.4.G797. [DOI] [PubMed] [Google Scholar]
- 26.Ciampolini M, Bianchi R. Training to estimate blood glucose and to form associations with initial hunger. Nutr Metab (Lond) 2006;3:42. doi: 10.1186/1743-7075-3-42. [DOI] [PMC free article] [PubMed] [Google Scholar]
- 27.Trainingpeaks.com. Apetite. 2013. [Last accessed on 2015 Sep 29]. Available from: http://www.home.trainingpeaks.com/blog/article/apetite-101 .
- 28.Katherine AS, Niamh MM, Steve RB. Hypothalamic regulation of apetite. Expert Rev Endocrinol Metab. 2008;3:577–92. doi: 10.1586/17446651.3.5.577. [DOI] [PubMed] [Google Scholar]
- 29.Merali Z, Singhal RL. Prevention by zinc of cadmium-induced alterations in pancreatic and hepatic functions. Br J Pharmacol. 1976;57:573–9. doi: 10.1111/j.1476-5381.1976.tb10387.x. [DOI] [PMC free article] [PubMed] [Google Scholar]
- 30.Sands JM, Layton HE. The physiology of urinary concentration: An update. Semin Nephrol. 2009;29:178–95. doi: 10.1016/j.semnephrol.2009.03.008. [DOI] [PMC free article] [PubMed] [Google Scholar]
- 31.Stuart IF. Human Physiology. 12th ed. New York: McGraw-Hill; 2011. pp. 596–7. [Google Scholar]
- 32.Sabolic I, Ljubojevic M, Herak-Kramberger CM, Brown D. Cd-MT causes endocytosis of brush-border transporters in rat renal proximal tubules. Am J Physiol Renal Physiol. 2002;283:F1389–402. doi: 10.1152/ajprenal.00066.2002. [DOI] [PubMed] [Google Scholar]
- 33.Ho E, Karimi Galougahi K, Liu CC, Bhindi R, Figtree GA. Biological markers of oxidative stress: Applications to cardiovascular research and practice. Redox Biol. 2013;1:483–91. doi: 10.1016/j.redox.2013.07.006. [DOI] [PMC free article] [PubMed] [Google Scholar]
- 34.Ashour TH. Preventative effects of caffeic Acid phenyl ester on cadmium intoxication induced hematological and blood coagulation disturbances and hepatorenal damage in rats. ISRN Hematol 2014. 2014:764754. doi: 10.1155/2014/764754. [DOI] [PMC free article] [PubMed] [Google Scholar]
- 35.Karabulut-Bulan O, Bolkent S, Yanardag R, Bilgin-Sokmen B. The role of vitamin C, vitamin E, and selenium on cadmium-induced renal toxicity of rats. Drug Chem Toxicol. 2008;31:413–26. doi: 10.1080/01480540802383200. [DOI] [PubMed] [Google Scholar]
- 36.Pari L, Murugavel P. Role of diallyl tetrasulfide in ameliorating the cadmium induced biochemical changes in rats. Environ Toxicol Pharmacol. 2005;20:493–500. doi: 10.1016/j.etap.2005.05.009. [DOI] [PubMed] [Google Scholar]
- 37.Dabak JD, Gazuwa SY, Ubom GA. Hepatoprotective potential of calcium and magnesium against cadmium and lead induced hepatotoxicity in wistar rats. Asian J Biotechnol. 2009;1:12–9. [Google Scholar]
- 38.Cinar M, Yigit AA, Yalcinkaya I, Oruc E, Duru O, Arslan M. Cadmium induced changes on growth performance, some biochemical parameters and tissue in broilers: Effects of vitamin C and vitamin E. Asian J Anim Vet Adv. 2011;6:923–34. [Google Scholar]
- 39.Farombi EO, Adedara IA, Akinrinde SA, Ojo OO, Eboh AS. Protective effects of kolaviron and quercetin on cadmium-induced testicular damage and endocrine pathology in rats. Andrologia. 2012;44:273–84. doi: 10.1111/j.1439-0272.2012.01279.x. [DOI] [PubMed] [Google Scholar]
- 40.Meena BM, Divya K, Haseena BS, Sailaja G, Sandhya D, Thyagaraju K. Evaluation of genotoxic and lipid peroxidation effect of cadmium in developing chick embryo. J Environ Anal Toxicol. 2014;4:238. [Google Scholar]
- 41.Bishak YK, Payahoo L, Osatdrahimi A, Nourazarian A. Mechanisms of cadmium carcinogenicity in the gastrointestinal tract. Asian Pac J Cancer Prev. 2015;16:9–21. doi: 10.7314/apjcp.2015.16.1.9. [DOI] [PubMed] [Google Scholar]
- 42.Nagma M, Jamal A, Jamal S, Abdu R. Protective effect of rutin against cadmium induced hepatotoxicity in Swiss albino mice. J Pharm Toxicol. 2012;7:150–7. [Google Scholar]
- 43.Gartel AL, Radhakrishnan SK. Lost in transcription: P21 repression, mechanisms, and consequences. Cancer Res. 2005;65:3980–5. doi: 10.1158/0008-5472.CAN-04-3995. [DOI] [PubMed] [Google Scholar]


