Abstract
Cardiopulmonary exercise testing provides oxygen pulse as a continuous measure of stroke volume, which is superior to other stress-testing methods in which systolic function is measured at baseline and at peak stress. However, the optimal peak oxygen pulse criterion for distinguishing cardiac from noncardiac causes of exercise limitation is unknown.
In comparing several peak oxygen pulse criteria against the clinical standard of cardiopulmonary exercise testing, we retrospectively studied 54 consecutive patients referred for cardiopulmonary exercise testing. These exercise tests included measurement of oxygen consumption, carbon dioxide production, breathing reserve, arterial blood gases at baseline and at peak stress, exercise electrocardiogram, heart rate, and blood pressure response. Results were blindly interpreted and patients were categorized as members either of our Cardiac Group (abnormal result secondary to cardiac causes of exercise limitation) or of our Noncardiac Group (normal or abnormal result secondary to any noncardiac cause of exercise limitation).
The accuracy of the peak oxygen pulse criteria ranged from 50% for univariate criterion (≤15 mL/beat), to 61% for oxygen pulse curve pattern, to 63% for bivariate criterion (≤15 mL/beat for men, ≤10 mL/beat for women), to as high as 81% for a multivariate criterion. All multivariate criteria outperformed oxygen pulse curve pattern, univariate, and bivariate criteria.
This is the first study to evaluate the optimal peak oxygen pulse criterion for differentiating cardiac from noncardiac causes of exercise limitation. Multivariate criteria (especially a criterion incorporating age, sex, height, and weight) should be used preferentially, as opposed to the commonly used univariate and bivariate criteria.
Keywords: Exercise test; forced expiratory volume; heart diseases/diagnosis; lung diseases/diagnosis; oxygen consumption; oxygen pulse; stress test, cardiopulmonary; respiration; retrospective studies
One of the main clinical reasons for cardiopulmonary exercise testing (CPX) is diagnosis of the cause of exercise limitation as cardiac or noncardiac. A patient with dyspnea from both a chronic obstructive pulmonary disease and a severe cardiac disease necessitating surgery (such as mitral regurgitation) will benefit from mitral valve surgery only if the primary cause of exercise limitation is cardiac in nature. Of the multiple tools available for cardiac function assessment in CPX, including heart rate (HR), blood pressure response, exercise electrocardiogram (ECG), and various gas-based measurements, a crucial measurement is peak oxygen (O2) pulse. Defined as oxygen consumption (Vo2)/HR, oxygen pulse is a continuous measure of stroke volume, which renders it superior to other noninvasive stress-testing methods in which systolic function is measured only twice, at baseline and at peak stress.
Although peak O2 pulse has been in clinical use for several decades and multiple studies1,2 have evaluated its prognostic value, its diagnostic value in discriminating cardiac from noncardiac causes of exercise limitation has never undergone systematic study and remains unknown. The dearth of such data makes the interpretation of CPX nebulous and variable, with poor reproducibility of results. Whereas O2 pulse is considered to be the most valuable component of CPX in ascertaining the presence of a cardiac cause, there are 6 different definitions of peak O2 pulse, and not a single study compares the relative diagnostic accuracy of these criteria. In addition, the slope of O2 pulse used in CPX interpretation has never been systematically evaluated for its diagnostic accuracy.
To find the optimal criterion for differentiating cardiac from noncardiac causes of exercise limitation, we evaluated the diagnostic worth of peak O2 pulse by measuring the operating test characteristics of the 6 commonly used criteria.3–7
Patients and Methods
In accordance with the amended Declaration of Helsinki and with approval by the institutional review board of Aurora St. Luke's Medical Center (approval #13.09E), we retrospectively studied a population of 54 consecutive patients referred for CPX from May 2008 through February 2012. The cardiac component of comprehensive CPX included exercise ECG and the measurement of HR, blood pressure response, and O2 pulse. The noncardiac component included medical record evaluation, pre- and post-test spirometry, the measurement of arterial blood gases at baseline and at peak stress, and the measurement of Vo2, of carbon dioxide production (VCo2), and of multiple other variables available from the metabolic cart (such as VE/VCo2, VE, PetCo2, breathing reserve, and respiratory exchange ratio). All data from the comprehensive CPX were evaluated in light of clinical correlations by an expert (MKE), who categorized the patients as members of the Cardiac Group (whose primary cause of exercise limitation was cardiac in nature) or of the Noncardiac Group. These last included patients with normal functioning, pulmonary deconditioning, poor effort, and musculoskeletal abnormality.
Subsequently, we applied 6 peak O2 pulse criteria to all patients. The ability of O2 pulse alone to distinguish a cardiac from a noncardiac cause of exercise limitation was compared with the clinical standard of comprehensive CPX interpretation. Although an ideal comparison would have involved the calculation of cardiac output by means of cardiac catheterization, magnetic resonance imaging, or echocardiography, such data were not available. For decades, CPX interpretation has been performed by pulmonologists without the availability of such data. It is widely accepted that clinical interpretation by a CPX expert is accurate, and such interpretation is the current criterion standard. In his or her interpretation, the pulmonologist ascribes cardiac or noncardiac origin of exercise limitation on the basis not only of O2 pulse data, but of approximately 30 other variables available from the gas-exchange data collected during CPX. The gas-exchange data provide information that is not provided by any other testing method. The goals of cardiac function are to deliver oxygen to tissues and to remove carbon dioxide, both of which are measured during CPX. Cardiopulmonary exercise testing provides data on these gas-exchange variables.
In addition, all of our patients underwent invasive arterial blood gas testing at rest and at peak exercise, which provided additional CPX data usually unavailable across the country. These invasive data provide additional insights to the reader, rendering interpretation more accurate. Moreover, our pulmonologist examined each patient and reviewed the medical records, which often contained cardiac-testing information such as the results of echocardiography and cardiac angiography—before the interpretation. These data, in addition to hemodynamic data (HR and blood pressure response to exercise) and continuous ECG monitoring during CPX, provided enough information for the pulmonologist to assign cardiac or noncardiac cause to the exercise limitation.
Exercise Protocol
Patients were instructed to stop taking short-acting bronchodilators, but to maintain all other medications on the day of the test. A brachial arterial line was placed in order to obtain whole arterial blood for the testing of arterial gases (lactate, acidity [pH], arterial oxygen tension [Pao2], carbon dioxide tension [PaCo2], and bicarbonate [HCo3]), at rest and at peak exercise (30 s before the termination of exercise). Samples were processed with use of the ABL800 FLEX blood gas analyzer (Radiometer Medical ApS; Brønshøj, Denmark) within 10 min of collection. The Vo2 and VCo2 data were obtained with use of the Ultima CPXTM metabolic stress-testing system (MGC Diagnostics Corporation; St. Paul, Minn). The system was calibrated for inspiratory and expiratory volumes before each test. With the nose clip and mouthpiece in place, the patients provided resting data for at least 2 min. Maximum voluntary ventilation was obtained at rest; a 12-lead ECG was obtained on a CardioPerfect® Workstation (Welch Allyn Inc.; Skaneateles Falls, NY) at rest and continuously during exercise. Blood pressure and HR were recorded continuously throughout testing. Spirometry was performed at rest and after the test. For all but one patient, a Medtrack® SR60 treadmill (Quinton Cardiology Systems, Inc.; Bothell, Wash) was used for exercise. The remaining patient exercised on a VIAsprintTM 150P bicycle (CareFusion Corporation; San Diego, Calif). The exercise protocol (Bruce, modified Bruce, Naughton, modified Naughton, or bicycle) was selected on the basis of each patient's fitness level.
Peak Oxygen Pulse Criteria
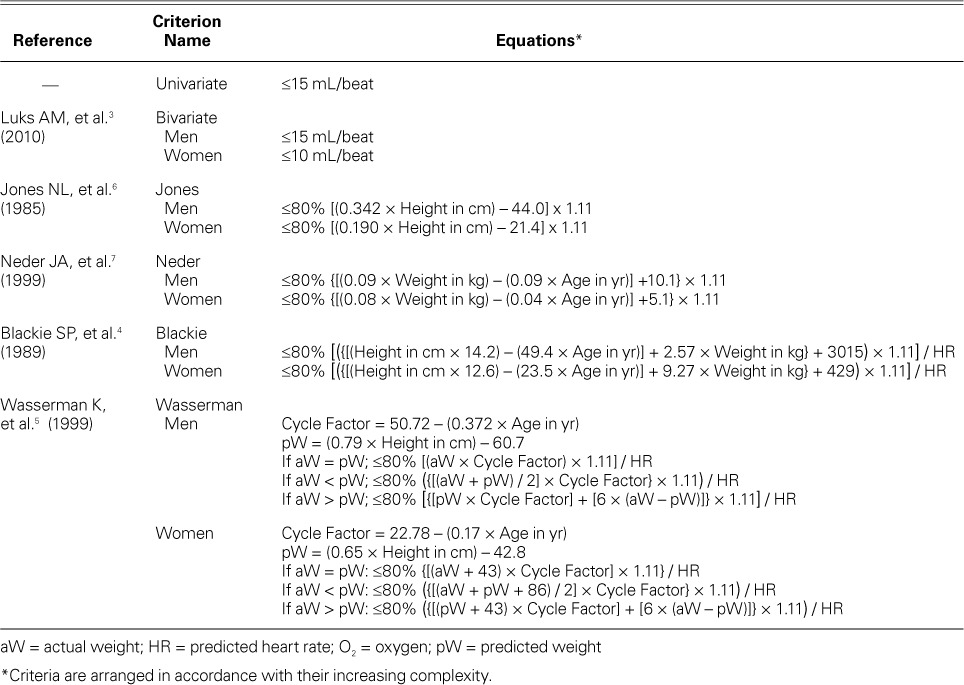
The study's 6 peak O2 pulse criteria for distinguishing cardiac from noncardiac causes of exercise limitation included a univariate criterion that was provided in the automated report generated by BreezeSuiteTM (MGC Diagnostics), a bivariate criterion (sex-specific),3 and 4 multivariate criteria4–7 that used height, age, weight, and sex in varying combinations (Table I).
TABLE I.
Different Criteria of Oxygen Pulse
Oxygen Pulse Curve Pattern
The O2 pulse curve pattern and the absolute value of peak O2 pulse have been proposed for use in evaluating cardiac output during exercise.5 Figure 1 depicts various representative O2 pulse curve patterns. To test reproducibility, 3 different readers (MKE, KAA, and MNA) independently evaluated O2 pulse curve patterns, blinded to other data. The κ statistic agreement was calculated.
Fig. 1.
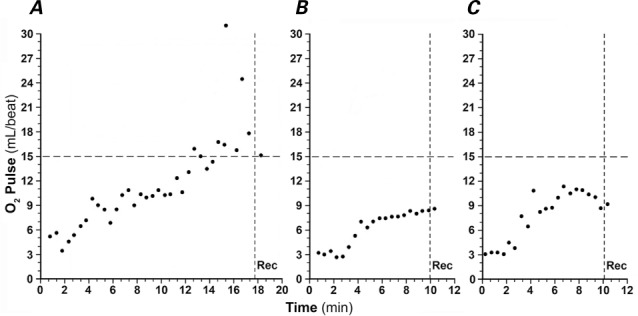
Representative oxygen (O2) pulse curves depict A) a normal O2 pulse rise during exercise; B) an abnormal O2 pulse with achievement of peak O2 pulse before peak exercise, followed by a plateau as the patient continues to exercise, which is consistent with dyspnea caused by cardiac output limitation; and C) an abnormal O2 pulse with achievement of peak O2 pulse before peak exercise, followed by a drop in O2 pulse as the patient continues to exercise, which indicates falling cardiac output. Panels B and C can be seen in patients with cardiac output limitation.
Rec = recovery period after exercise
Combining the Peak Oxygen Pulse with the Oxygen Pulse Curve Pattern
The O2 pulse curve pattern and peak O2 pulse are both used in clinical practice and are given equal weight in distinguishing cardiac from noncardiac causes of exercise limitation. To approximate and reproduce clinical practice, we further analyzed the results by creating 2 new groups of patients. The Cardiac Group included patients with abnormal O2 pulse by both O2 pulse curve pattern and the optimal criterion for peak O2 pulse. The optimal criterion was assigned on the basis of highest accuracy. The Noncardiac Group included patients judged to have normal O2 pulse by both the O2 pulse curve pattern and the optimal criterion for peak O2 pulse.
The cardiac output limitation was determined by our expert on the basis of exercise ECG, subjective response, blood pressure response, HR response to exercise, peak O2 pulse value, O2 pulse curve pattern, VE/VCo2, and lactate levels (invasively obtained). She also had access to the clinical data in the medical record, which included echocardiograms and the results of prior nuclear testing.
Statistical Analysis
The statistical package used for all analyses was JMP®, version 10 (SAS Institute Inc.; Cary, NC). Continuous variables were expressed as mean ± SD, and categorical variables were expressed as number and percentage. The Student t test was used for comparisons of statistical analysis between the groups. A P value of <0.05 was considered statistically significant. The operating test characteristics of the various O2 pulse criteria included sensitivity, specificity, positive predictive value (PPV), and negative predictive value (NPV). These were calculated by plotting the interpretation arising from these criteria against the standard criterion of overall test interpretation as performed by the pulmonologist (MKE). For example, if all the patients characterized by the Wasserman criteria as cardiac patients were also characterized by the pulmonologist as cardiac patients, then the positive predictive value of the Wasserman O2 pulse criterion would be 100%. The pulmonologist was blinded to the information from all the different O2 pulse criteria, although she was provided raw data pertaining to peak O2 pulse, as well as the O2 pulse curve plotted against time.
Results
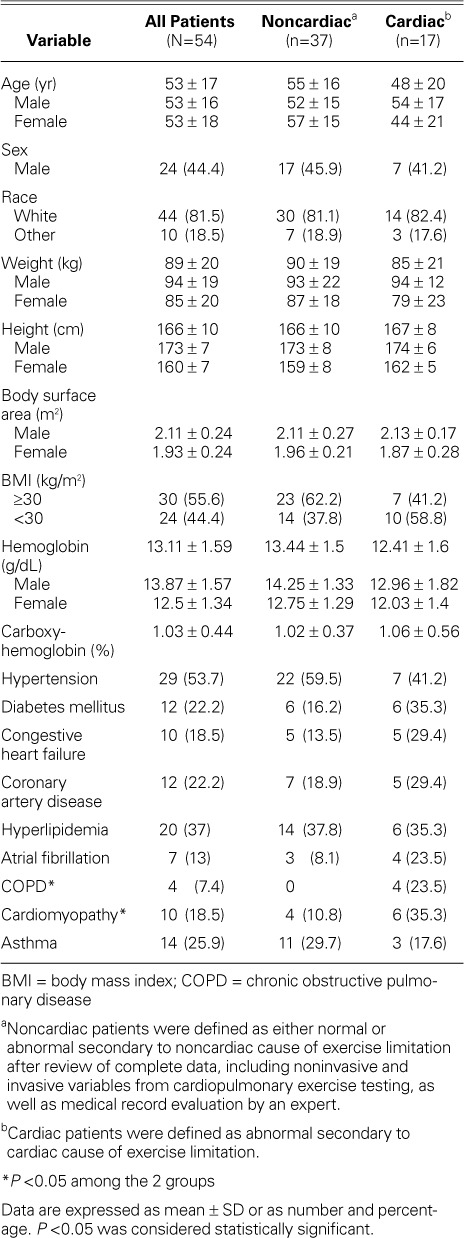
The study population consisted of 54 consecutive patients (mean age, 53 ± 17 yr; 24 men). Table II shows the baseline characteristics of the study population. Patients had been referred for unexplained exertional dyspnea and fatigue (n=50) or for presurgical evaluation (n=4). The patient population consisted of middle-aged adults with a high prevalence of diabetes mellitus (22.2%). The 2 groups were similar in age, sex distribution, and race. The Cardiac Group (n=17; mean age, 48 ± 20 yr; 7 men) had a higher prevalence of diabetes, congestive heart failure, chronic obstructive pulmonary disease, coronary artery disease, atrial fibrillation, and cardiomyopathy, whereas the Noncardiac Group (n=37; mean age, 55 ± 16 yr; 17 men) had a higher prevalence of asthma, hypertension, and obesity.
TABLE II.
Baseline Characteristics of Patients
The mean achieved peak O2 pulse was significantly lower for the Cardiac Group (9.9 ± 2.8 mL/beat) than for the Noncardiac Group (13.1 ± 4.4 mL/beat, P=0.0039) (Table III). The highest peak O2 pulse achieved in the Cardiac and Noncardiac groups was 15 mL/beat and 24 mL/beat, respectively. The lowest peak O2 pulse achieved in the Cardiac and Noncardiac groups was 5 mL/beat and 3 mL/beat, respectively.
TABLE III.
Predicted Peak Oxygen Pulse versus Achieved Peak Oxygen Pulse
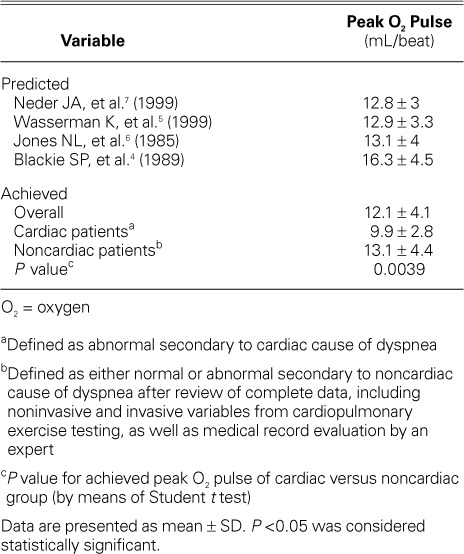
The predicted peak O2 pulse varied between multivariate criteria, ranging from 12.8 ± 3 to 16.3 ±4.5 mL/beat.
The peak O2 pulse criterion by Wasserman and colleagues,5 which incorporated age, sex, height, and weight, had the highest accuracy (81%) and PPV (71%) (Table IV). The univariate criterion (<15 mL/beat) had the lowest accuracy (50%), followed by the bivariate criterion (≤15 mL/beat for men and ≤10 mL/beat for women) (61%). Figure 2 shows the accuracy of the different criteria in an ascending order.
TABLE IV.
Criteria for Predicting Abnormal Peak O2 Pulse to Distinguish Cardiac from Noncardiac Causes of Exercise Limitation Compared with the Clinical Standard of Cardiopulmonary Exercise Testing
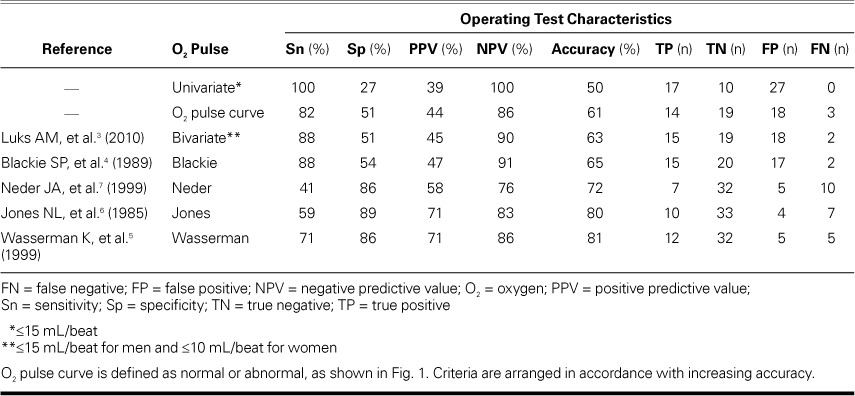
Fig. 2.
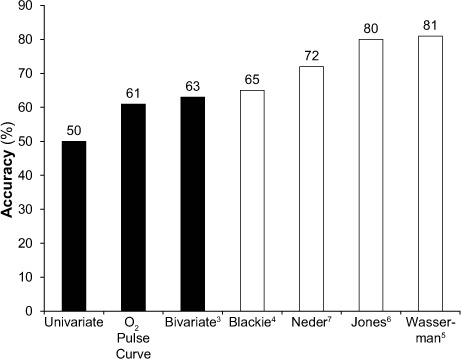
Accuracy of different peak oxygen (O2) pulse criteria and O2 pulse curve pattern for differentiating cardiac from noncardiac causes of exercise limitation. Simple criteria (black bars: univariate, O2 pulse curve pattern, and bivariate) had a lower accuracy than did the multivariate criteria (white bars: Blackie, Neder, Jones, and Wasserman).
The O2 pulse curve pattern, when used to differentiate between Cardiac and Noncardiac groups, produced an accuracy of 61%—greater than the univariate and bivariate criteria, but lower than the 4 multivariate criteria. The interobserver variability was moderate, as shown by the κ statistic (MKE vs MNA = 0.56, P <0.0001; MKE vs KAA = 0.43, P=0.0004; and KAA vs MNA = 0.63, P <0.0001).
The data were further analyzed by dividing each group into 2 subgroups: the Cardiac Group included patients with abnormal O2 pulse by optimal peak O2 pulse (Wasserman criterion), as well as patients with O2 pulse curve pattern; and the Noncardiac Group included patients with normal O2 pulse by optimal peak O2pulse (Wasserman criterion), as well as patients with O2 pulse curve pattern. This led us to the exclusion of 23 patients who were normal or abnormal by only one criterion. These patients were categorized as “borderline.” The accuracy of the optimal peak O2 pulse and O2 pulse curve pattern in determining abnormal causes of exercise limitation, without the borderline patients, was 87% (Fig. 3). When the borderline patients were included in the Cardiac Group, the accuracy dropped to 61%, and when they were included in the Noncardiac Group the accuracy dropped to 81%.
Fig. 3.
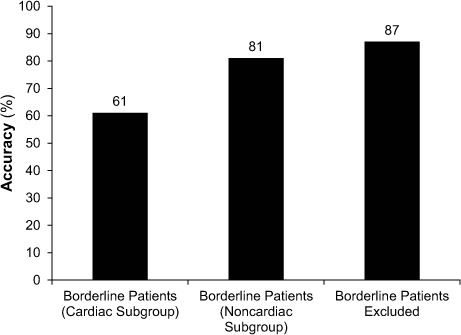
Accuracy of combined oxygen (O2) pulse curve pattern and optimal peak O2 pulse criteria pattern for differentiating cardiac from noncardiac causes of exercise limitation. The Cardiac Group included patients who had abnormal results as determined by both optimal peak O2 pulse and O2 pulse curve patterns, and the Noncardiac Group included patients who had normal results as determined by both optimal peak O2 pulse and O2 pulse curve patterns. Borderline patients had abnormal or normal results as determined by only one criterion.
Discussion
This is the first study to evaluate the use of optimal peak O2 pulse in distinguishing between cardiac and noncardiac causes of exercise limitation. Univariate and bivariate criteria underperformed; multivariate criteria that incorporate age, sex, height, and weight—such as the Wasserman criterion5—are more accurate and should be used preferentially.
These new data reveal the low accuracy of the O2 pulse curve pattern when that method is used alone (Fig. 2). In current clinical practice, as recommended by Wasserman and colleagues,5 the O2 pulse curve pattern and the peak O2 pulse are given equal weight in evaluating cardiac causes of exercise limitation. These new data reveal that the accuracy of peak O2 pulse is much greater than that of the O2 pulse curve (Fig. 2). Therefore, peak O2 pulse should be given greater weight in clinical practice. The O2 pulse curve pattern is constructed by plotting breath-to-breath O2 pulse against time during exercise, which introduces variability with every breath, as seen in a scatter plot (Fig. 1). In addition, there are no set “normal reference limits” for the O2 pulse curve rate of rise (that is, the slope). The scatter plot of O2 pulse in the O2 pulse curve pattern creates interobserver variability. In our study, the O2 pulse curve pattern showed moderate interobserver reproducibility upon application of the κ statistic. Whereas the pulse curve suffers from interobserver variability, peak O2 pulse is objectively measured by the metabolic cart, which resolves subjective interpretation and interobserver variability concerns.
The Vo2 max has been shown to parallel cardiac output at peak exercise, as C(a-v)O2 becomes constant, in multiple subgroups of populations and is consistently about 15 mL/dL (13–16 mL/dL), regardless of the patient subgroup, when measurements are taken invasively with deployment of a Swan-Ganz catheter and arterial and venous lines.8–11 These subgroups from other studies9–11 have included healthy subjects (n=5; mean age, 25 ± 6 yr),9 normal subjects (n=12; mean age, 45 ± 13 yr), patients with chronic heart failure attributable to severe left ventricular dysfunction (n=30; mean age, 55 ± 10 yr),10 and patients with normal hemoglobin values and stable heart failure (n=40; mean age, 56.5 ± 10 yr).11 In such instances, the peak O2 pulse is highly representative of peak stroke volume, because the C(a-v) O2 is constant at peak exercise. This might provide the physiologic rationale for the greater accuracy of many peak O2 pulse criteria, when peak O2 pulse is compared with the O2 pulse curve pattern (Fig. 2).
This study shows the limitation of a univariate criterion (that is, ≤15 mL/beat), suggesting that “one size does not fit all.” Although this univariate criterion provides the highest sensitivity (100%), the tradeoffs are the lowest specificity (27%), the lowest PPV (39%), and the lowest accuracy (50%). A simple bivariate criterion that acknowledges sex-based differences of height and weight resulted in a minimal decrease in sensitivity (100% to 88%), while the specificity doubled from 27% to 51% and the PPV rose from 39% to 45% (Table IV). The bivariate criterion (≤15 mL/beat for men and ≤10 mL/beat for women) is easily applicable and should be used preferentially over the univariate criterion in clinical practice, although it is not part of the automated clinical report provided by BreezeSuite—which curiously uses the criterion with the poorest performance.
The 4 multivariate criteria performed better. Of these, the Wasserman criterion5 performed the best, with the highest accuracy (81%) and PPV (71%). The bivariate criterion and the Blackie criterion4 tied for the 2nd highest sensitivity (88%), but came at a loss of specificity (51% and 54%, respectively). Wasserman and colleagues' criterion had a sensitivity of 86%. The PPVs for the bivariate criterion and the Blackie criterion were 45% and 47%, respectively; Wasserman's PPV was 71%.
The combination of O2 pulse curve and optimal peak O2 pulse (the Wasserman criterion) in determining a cardiac cause of exercise limitation results in the highest accuracy (87%). This suggests that the clinical practice of using both the O2 pulse curve and the optimal peak O2 pulse is reasonable. However, this practice led to the exclusion of 23 subjects, about whom there was disagreement between O2 pulse curve and optimal peak O2 pulse; ergo about 46% of these patients might not be classifiable in clinical practice. In such cases, peak O2 pulse might well be more accurate, because of the much greater accuracy (81% vs 61%) of the peak O2 pulse (the Wasserman criterion). In addition, the data suggest that categorizing these borderline patients as Noncardiac increases accuracy from 61% to 81% (Fig. 3). In clinical practice, this observation can be considered to categorize the patient as Noncardiac when either the peak O2 pulse or the O2 pulse curve pattern is normal.
The various applications of these criteria can be dictated by the clinical setting. Criteria providing higher NPV (for example, the Blackie criterion) are better for screening patients for an invasive study. However, criteria that yield higher specificity and higher PPV (for example, the Wasserman criterion5 and the Jones criteria6) are of greater value in considering whether a patient should undergo major cardiac surgery, because the results will portend greater probability of therapeutic response to treatment in a patient who has both severe cardiac and severe pulmonary disease.
Strengths and Limitations of the Study
The strengths of the present study include its patient population (which is representative of a population referred to a cardiopulmonary stress laboratory in a tertiary-care center) and our clinician's access to invasive data generated during CPX, such as the data pertaining to arterial blood gases. This enables an above-average clinical interpretation of CPX: in many institutions, these data are not obtained in CPX laboratories.
Lack of an imaging technique like echocardiography or a hemodynamic technique like Fick cardiac output or thermodilution cardiac output by cardiac catheterization certainly limits our ability to determine the comparative worth of peak O2 pulse as a measure of peak systolic performance. However, we should remember that peak O2 pulse is derived from Vo2 (Vo2/HR), and it has been shown that the arteriovenous O2 content difference does not change at peak exercise. As a consequence, cardiac output is directly proportional to Vo2, and Vo2-based peak O2 pulse should run parallel to Fick cardiac output.8–11 The peak cardiac index in our Noncardiac Group was 6.08 ± 2.3 L/min/m2, quite similar to that reported by a prior study,12 which gives some external validity to the current study.
Conclusions
Ours is the first study to evaluate the optimal peak O2 pulse criterion for distinguishing between cardiac and noncardiac causes of exercise limitation. Simple criteria, like univariate and bivariate criteria, underperformed. We conclude that multivariate criteria incorporating age, sex, height, and weight—like the Wasserman criterion5—should be used preferentially, for their greater accuracy. In addition, this study provides interesting insights into the clinical practice of combining peak O2 pulse and O2 pulse curve pattern to distinguish cardiac from noncardiac causes of exercise limitation.
Acknowledgments
The authors gratefully acknowledge editorial preparation by Joe Grundle, Katie Klein, and Susan Nord of Aurora Cardiovascular Services and work on the graphics by Brian Miller and Brian Schurrer, of Aurora Research Institute.
Footnotes
From: Aurora Cardiovascular Services (Drs. M.M. Ahmad, M.N. Ahmad, Ammar, Paterick, Ullah, Yousaf, and Yusuf), Aurora Sinai/Aurora St. Luke's Medical Centers, University of Wisconsin School of Medicine and Public Health; and Division of Pulmonary and Critical Care Medicine (Dr. Ellis), Medical College of Wisconsin and Clement J. Zablocki VA Medical Center; Milwaukee, Wisconsin 53215
Presented as an abstract at the American Heart Association Scientific Sessions; Dallas, Texas (16–20 November 2013).
References
- 1.Oliveira RB, Myers J, Araujo CG, Abella J, Mandic S, Froelicher V. Maximal exercise oxygen pulse as a predictor of mortality among male veterans referred for exercise testing. Eur J Cardiovasc Prev Rehabil. 2009;16(3):358–64. doi: 10.1097/HJR.0b013e3283292fe8. [DOI] [PubMed] [Google Scholar]
- 2.Laukkanen JA, Kurl S, Salonen JT, Lakka TA, Rauramaa R. Peak oxygen pulse during exercise as a predictor for coronary heart disease and all cause death. Heart. 2006;92(9):1219–24. doi: 10.1136/hrt.2005.077487. [DOI] [PMC free article] [PubMed] [Google Scholar]
- 3.Luks AM, Glenny R, Robertson HT. Introduction to cardiopulmonary exercise testing. 2nd ed. Seattle: Division of Pulmonary and Critical Care Medicine, University of Washington; 2010. p. 7. p. Available from: http://www.ucl.ac.uk/anaesthesia/research/CPEx_Interpretation.pdf [cited 2013 Jun 11] [Google Scholar]
- 4.Blackie SP, Fairbarn MS, McElvaney GN, Morrison NJ, Wilcox PG, Pardy RL. Prediction of maximal oxygen uptake and power during cycle ergometry in subjects older than 55 years of age [published erratum appears in Am Rev Respir Dis 1990;141(5 Pt 1):1380] Am Rev Respir Dis. 1989;139(6):1424–9. doi: 10.1164/ajrccm/139.6.1424. [DOI] [PubMed] [Google Scholar]
- 5.Wasserman K, Hansen JE, Sue DY, Whipp BJ, Casaburi R. Principles of exercise testing and interpretation. 3rd ed. Philadelphia: Lippincott Williams & Wilkins; 1999. Normal values; pp. 143–64. p. [Google Scholar]
- 6.Jones NL, Makrides L, Hitchcock C, Chypchar T, McCartney N. Normal standards for an incremental progressive cycle ergometer test. Am Rev Respir Dis. 1985;131(5):700–8. doi: 10.1164/arrd.1985.131.5.700. [DOI] [PubMed] [Google Scholar]
- 7.Neder JA, Nery LE, Castelo A, Andreoni S, Lerario MC, Sachs A et al. Prediction of metabolic and cardiopulmonary responses to maximum cycle ergometry: a randomised study. Eur Respir J. 1999;14(6):1304–13. doi: 10.1183/09031936.99.14613049. [DOI] [PubMed] [Google Scholar]
- 8.Stringer WW, Hansen JE, Wasserman K. Cardiac output estimated noninvasively from oxygen uptake during exercise. J Appl Physiol (1985) 1997;82(3):908–12. doi: 10.1152/jappl.1997.82.3.908. [DOI] [PubMed] [Google Scholar]
- 9.Wasserman K, Hansen JE, Sue DY, Whipp BJ, Casaburi R. Principles of exercise testing and interpretation. 3rd ed. Philadelphia: Lippincott Williams & Wilkins; 1999. Measurements during integrative cardiopulmonary exercise testing; pp. 62–94. p. [Google Scholar]
- 10.Sullivan MJ, Knight JD, Higginbotham MB, Cobb FR. Relation between central and peripheral hemodynamics during exercise in patients with chronic heart failure. Muscle blood flow is reduced with maintenance of arterial perfusion pressure. Circulation. 1989;80(4):769–81. doi: 10.1161/01.cir.80.4.769. [DOI] [PubMed] [Google Scholar]
- 11.Agostoni PG, Wasserman K, Perego GB, Guazzi M, Cattadori G, Palermo P et al. Non-invasive measurement of stroke volume during exercise in heart failure patients. Clin Sci (Lond) 2000;98(5):545–51. [PubMed] [Google Scholar]
- 12.Stratton JR, Levy WC, Cerqueira MD, Schwartz RS, Abrass IB. Cardiovascular responses to exercise. Effects of aging and exercise training in healthy men. Circulation. 1994;89(4):1648–55. doi: 10.1161/01.cir.89.4.1648. [DOI] [PubMed] [Google Scholar]


