Abstract
Recent progress in cancer treatment has improved patient survival, but has increased the number of patients with metastatic bone tumors. Data were collected from all bone metastasis patients at Kagoshima University, where almost all patients with metastatic bone tumors who reside in Kagoshima province are treated surgically. The scoring systems used in bone metastasis patients were then evaluated to identify those most suitable for our patients. Clinical data were collected from 145 patients with bone metastases. The patients were assigned prognostic scores based on four scoring systems, namely those described by the Ratasvuori, Mizumoto, Tokuhashi and Katagiri groups. Statistical examinations were performed to assess patient distribution regarding prognostic factors and the four data sets reported in the literature. The patient distributions for all prognostic factors were significantly different between the Scandinavian Sarcoma Group (SSG) and Kagoshima data. The distributions of patients for 3 of 5 and for 5 of 7 prognostic factors were statistically different between the Kagoshima data and the Katagiri and Tokuhashi data, respectively. Additionally, the distribution of patients in each scoring group was statistically different between the Kagoshima data and the Katagiri, Tokuhashi and Mizumoto data. The predictions of prognosis were significantly different between the results of each group and ours. The Tokuhashi scoring system detected the highest survival at 6 months (88.8%) in the Kagoshima data. Patients with a life expectancy of >6 months benefited from tumor excision and reconstruction. These findings suggest that the Tokuhashi scoring system is the most suitable for identifying patients who should be assessed for curative surgical intervention. SSG scoring, however, was suitable for identifying patients expected to survive for <6 months (91.3%). Prior to selecting a scoring system to predict prognosis, it is important to determine which scoring system is the most appropriate, based on each hospital's particular characteristics.
Keywords: metastatic bone tumor, prognosis, scoring, performance status, prognostic factor
Introduction
Recent progress in the treatment of malignant tumors has improved patient survival. The improved prognosis, however, has increased the number of patients with metastatic bone tumors. Surgical and radiation therapy interventions to treat metastatic bone tumors are complicated by a highly variable clinical course. The precise roles of surgery and radiation therapy remain undefined and cannot be resolved unless prognosis-related factors are elucidated. Scoring systems may help physicians predict the prognosis of patients with bone metastases and provide a practical tool for clinicians to facilitate treatment selection.
In 2013, Ratasvuori et al (1) described a prognosis scoring system for 1,195 surgically-treated patients with skeletal metastases in the extremities that was based on the Scandinavian Sarcoma Group (SSG) Skeletal Metastasis Registry (SSG score); in 2005, Katagiri et al (2) described a prognosis scoring system based on the data from 350 surgically or non-surgically treated patients with skeletal metastases (Katagiri score); in 2005, Tokuhashi et al (3) described a prognosis scoring system that was based on data from 164 patients with spinal metastases who were surgically or non-surgically treated (Tokuhashi score); and in 2008, Mizumoto et al (4) reported yet another prognosis scoring system based on data from 544 patients with spinal column metastases who had been treated with radiotherapy (Mizumoto score).
For the present study, we collected data from all patients with bone metastases who were treated at the Department of Orthopaedic Surgery, Kagoshima University Hospital, which is the only teaching hospital in Kagoshima province, Japan. Almost all patients with metastatic bone tumors who reside in this area are referred to our department. We evaluated the four reported scoring systems in regard to our patient population to determine which was the most suitable for our patients with bone metastases.
Patients and methods
Patients
A total of 6,539 cancer patients were registered in the Kagoshima University cancer registry between 2007 and 2011; 209 patients had bone metastases. In this retrospective study, we reviewed the medical records and images of 145 patients with metastatic bone tumors who were referred to the Department of Orthopaedic Surgery, Kagoshima University Hospital between 2007 and 2011 as previously reported (5). The patients included 81 men and 64 women with a mean age of 65 years (range, 29–87 years). The mean follow-up was 10 months. Two well-trained radiologists reviewed all bone scans. The bone scan results were compared with radiographs, computed tomography scans, or magnetic resonance images, taking into account the patient's clinical symptoms. Any positive findings were considered as bone metastases.
We collected data on the age and gender of the patient, the primary tumor, site(s) and number of metastases, presence of other metastases, type of surgery, performance status (2,6), complications, previous chemotherapy, Frankel classification (7) and presence of hypercalcemia (>10 mg/dl). Overall survival was defined as the time interval between the date the first skeletal metastasis was diagnosed and the date of death, or the date when the patient was last known to be alive. The study protocol was approved by the Ethics Committee on Clinical Research at Kagoshima University Hospital.
Statistical analysis
Differences in the categorical variables between each scoring system and the data from our hospital were analyzed by the Fisher's exact or Mann-Whitney U test. Kaplan-Meier analysis was performed to illustrate the time to death. The significance of all Kaplan-Meier analyses were tested by log-rank analysis. Statistical analyses were performed using Excel statistics 2012 (Social Survey Research Information Co., Ltd. Tokyo, Japan).
Results
Evaluation of prognosis by the SSG survival scoring system
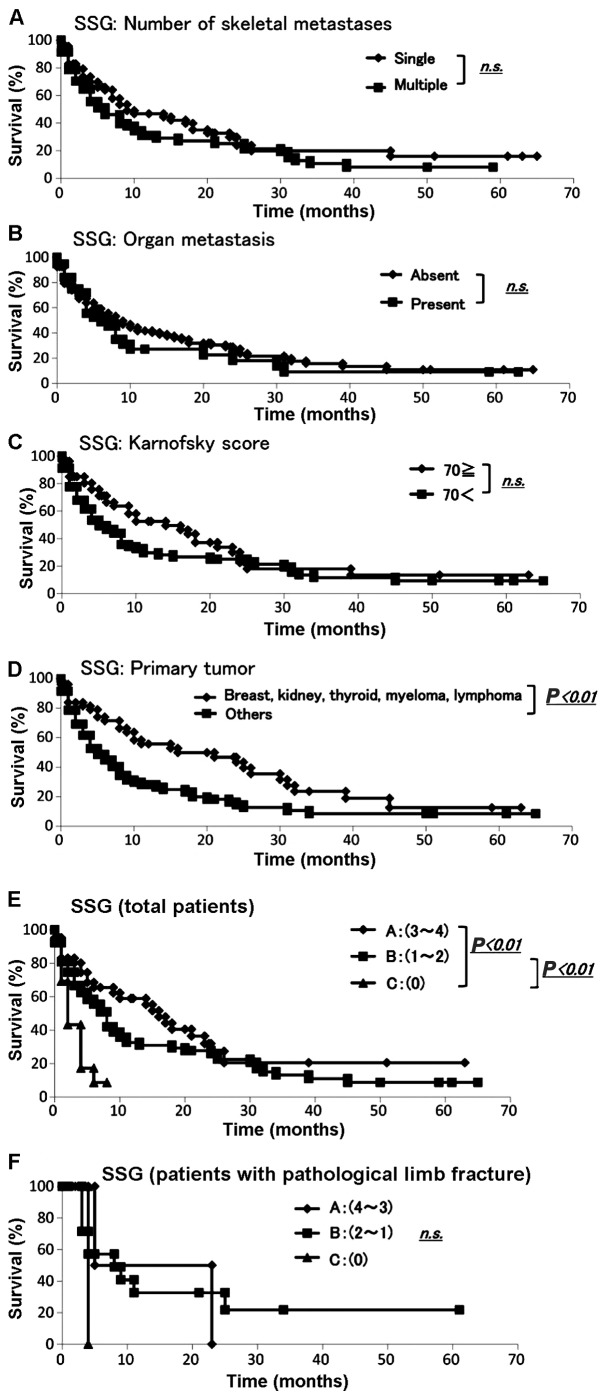
Data were collected from 145 patients with skeletal metastases regarding prognosis, number of skeletal metastases, presence of organ metastasis, primary lesion and Karnofsky score (6) according to the SSG survival scoring (1). The demographic data for each prognostic factor from Kagoshima University and the SSG report are summarized in Table IA. We performed the Fisher's exact test to assess any significant differences between the Kagoshima University and SSG data sets. All the sets differed significantly with respect to the presence of organ metastasis (P<0.01), primary tumor (breast, kidney, thyroid, myeloma, or lymphoma vs. other cancers, P<0.01), Karnofsky score (≥70 vs. <70, P<0.01) and number of skeletal metastases (single or multiple, P<0.01) (Table IA). The Kaplan-Meier analysis and log-rank analysis revealed that none of the other variables (apart from the primary tumor) was a significant prognostic factor (Fig. 1A–D).
Table I.
Distribution and prognosis of patients for each score of SSG survival scoring system.
| A, Distribution of prognostic factors | ||||
|---|---|---|---|---|
| Prognostic factors | Kagoshima | SSG | P-valuea | |
| Skeletal metastasis | <0.01 | |||
| Single | 65 | 146 | ||
| Multiple | 80 | 505 | ||
| Organ metastasis | <0.01 | |||
| Absent | 107 | 384 | ||
| Present | 38 | 267 | ||
| Primary tumor | <0.01 | |||
| Breast, kidney, thyroid, myeloma, lymphoma | 51 | 360 | ||
| Other | 94 | 291 | ||
| Karnofsky score | <0.01 | |||
| ≥70 | 26 | 338 | ||
| <70 | 119 | 313 | ||
| Impending fracture | 122 | 156 | <0.01 | |
| Pathological fracture | 23 | 495 | ||
| SSG survival score | ||||
| Group A, 3–4 | 42 | N/A | ||
| Group B, 1–2 | 90 | N/A | ||
| Group C, 0 | 13 | N/A | ||
| B, SSG survival scoring | ||||
| Prognostic factors | Points | Sum | Groups | Estimated survival (months) |
| Skeletal metastasis | >12 | |||
| Single | 1 | |||
| Multiple | 0 | 4 | A | |
| Organ metastasis | 3–6 | |||
| Absent | 1 | 3 | ||
| Present | 0 | 2 | B | |
| Breast, kidney, thyroid, myeloma, lymphoma | <3 | |||
| Yes | 1 | 1 | ||
| No | 0 | 0 | C | |
| Karnofsky score | ||||
| ≥70 | 1 | |||
| <70 | 0 | |||
| C, SSG scoring | ||||
| Prognostic score | Months | Survival rate (%) | 95% CI | |
| Group A, 3–4 | 3 | 80.2 | 0.69–0.93 | |
| 6 | 65.5 | 0.50–0.81 | ||
| 12 | 59.0 | 0.43–0.75 | ||
| 24 | 27.4 | 0.10–0.44 | ||
| Group B, 1–2 | 3 | 66.7 | 0.56–0.77 | |
| 6 | 55.5 | 0.44–0.67 | ||
| 12 | 32.6 | 0.21–0.44 | ||
| 24 | 26.0 | 0.15–0.37 | ||
| Group C, 0 | 3 | 43.3 | 0.15–0.71 | |
| 6 | 8.7 | 0.00–0.25 | ||
Measured with Fisher's exact probability test. SSG, Scandinavian Sarcoma Group; CI, confidence interval.
Figure 1.
Evaluation using the Scandinavian Sarcoma Group (SSG) score. The (A) number of skeletal metastases, (B) presence of organ metastasis and (C) Karnofsky score were not significant prognostic factors; (D) The Kaplan-Meier analysis for all patients identified primary tumor as a significant prognostic factor (P<0.01); (E) survival rate examined by the SSG score. Prognosis for total patients of each scoring factor. There were statistical differences between A and C, B and C; (F) The Kaplan-Meier analysis for postoperative patients revealed no statistically significant difference.
The SSG survival scoring system was applied to the validation set (Table IB) (1). The SSG scoring system divides patients into groups A, B and C (Table IB). The Kaplan-Meier analysis demonstrated that groups A and C and groups B and C had significantly different prognoses (Fig. 1E). Among the patients in group A, 80.2% survived for 3 months and 59.0% survived for >12 months. Among the patients in group B, 55.5% survived for >6 months. Among the patients in group C, 43.3% survived for 3 months and 8.7% for 6 months (Table IC). The SSG survival scoring was based on the Scandinavian Skeletal Metastasis Registry for patients with surgically treated, skeletal metastases of the extremities.
The SSG survival scoring was then applied to the data set for our patients who had been surgically treated for skeletal metastases of the extremities. The demographic data for the scoring groups from Kagoshima University are summarized in Table II. The Kaplan-Meier analysis and log-rank analysis demonstrated that there were no significant differences in prognosis between groups (Fig. 1F).
Table II.
Evaluation by the SSG survival scoring system for patients with fracture operation.
| Patients with fracture operation | ||
|---|---|---|
| Scoring, points | Kagoshima | SSG |
| Group A, 3–4 | 42 | N/A |
| Group B, 1–2 | 90 | N/A |
| Group C, 0 | 13 | N/A |
SSG, Scandinavian Sarcoma Group; N/A, not available.
Evaluation of prognosis by the Katagiri score
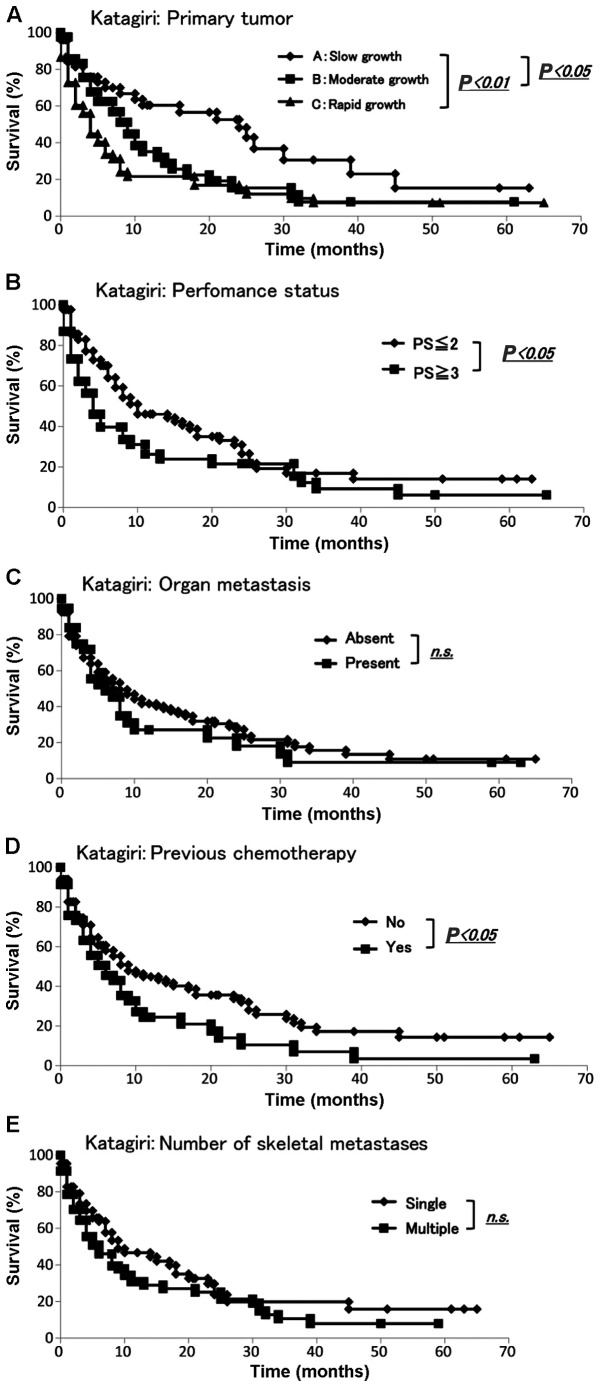
We collected data from all 145 patients with skeletal metastasis regarding prognosis, primary lesion, presence of visceral and cerebral metastases, performance status (2), history of previous chemotherapy and number of skeletal metastases according to the Katagiri score (2). The demographic data for each prognostic factor from Kagoshima University and Katagiri et al (2) are summarized in Table IIIA. To determine whether there were any significant differences between the Kagoshima University and Katagiri score data sets, we performed the Fisher's exact or Mann-Whitney U test. The sets significantly differed with respect to the presence of visceral and cerebral metastasis, performance status (4 and 3 vs. 2 and 1) and the number of skeletal metastases (single or multiple) (all P-values <0.01). The sets did not differ significantly with respect to the primary lesion or history of previous chemotherapy (Table IIIA). The Kaplan-Meier and log-rank analyses revealed that slow growth and moderate or rapid growth were significantly different (P<0.05 and P<0.01, respectively) (Fig. 2A). Additionally, the Kaplan-Meier and log-rank analyses demonstrated that performance status (≤2 vs. ≥3) and history of previous chemotherapy exhibited significant differences (P<0.05) (Fig. 2B and D). None of the remaining variables was a significant prognostic factor (Fig. 2C and E).
Table III.
Distribution of patients for each score of the Katagiri scoring system.
| A, Proportion of patients | |||
|---|---|---|---|
| Prognostic factors | Kagoshima | Katagiri (2005) | P-value |
| Primary lesiona | 0.65b | ||
| Rapid growth | 52 | 132 | |
| Moderate growth | 42 | 74 | |
| Slow growth | 51 | 144 | |
| Visceral and cerebral metastasis | <0.01c | ||
| Yes | 37 | 178 | |
| No | 108 | 172 | |
| Performance status (ECOG) | <0.01c | ||
| 3 or 4 | 61 | 219 | |
| 1 or 2 | 84 | 131 | |
| Previous chemotherapy | 0.47c | ||
| Yes | 46 | 108 | |
| No | 99 | 241 | |
| Skeletal metastases | <0.01c | ||
| Multiple | 80 | 238 | |
| Single | 65 | 112 | |
| B, Katagiri scoring | |||
| Scoring | All patients Kagoshima | All patients Katagiri (2005) | P-value |
| 0–2 | 31 | 23 | <0.01b |
| 3–5 | 54 | 67 | |
| 6–8 | 60 | 156 | |
| C, Katagiri scoring | |||
| Prognostic score | Months | Survival rate (%) | 95% CI |
| 0–2 points | 3 | 78.0 | 0.66–0.90 |
| 6 | 69.7 | 0.56–0.84 | |
| 12 | 66.5 | 0.52–0.81 | |
| 24 | 38.2 | 0.20–0.57 | |
| 3–5 points | 3 | 63.5 | 0.52–0.75 |
| 6 | 52.0 | 0.40–0.64 | |
| 12 | 29.0 | 0.17–0.41 | |
| 24 | 21.8 | 0.11–0.33 | |
| 6–8 points | 3 | 64.5 | 0.45–0.84 |
| 6 | 29.8 | 0.10–0.49 | |
| 12 | 13.2 | 0.00–0.29 | |
| 24 | 6.61 | 0.00–0.19 | |
Primary lesions in hepatocellular, gastric, lung carcinoma, other carcinoma and sarcoma, breast, prostate, thyroid carcinoma
measured with Mann-Whitney test
measured with Fisher's exact probability test. ECOG, Eastern Cooperative Oncology Group; CI, confidence interval.
Figure 2.
Evaluation using the Katagiri score. The Kaplan-Meier and log-rank analyses revealed significant differences by (A) primary tumor, (B) performance status and (D) history of previous chemotherapy (P<0.05); (C and E) none of the other two variables was a significant prognostic factor. n.s., non-significant.
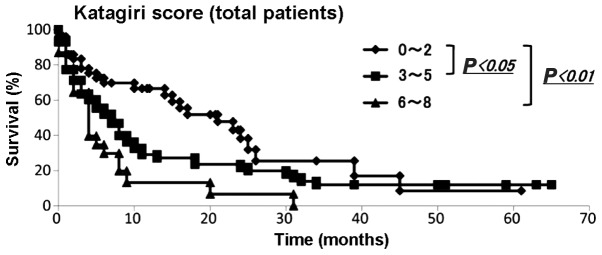
We then applied the Katagiri scoring system to our data. The demographic data of each score from the Kagoshima University and Katagiri et al (2) are summarized in Table IIIB. The Mann-Whitney U test demonstrated that the distributions of each score were statistically significant (P<0.01). The Kaplan-Meier and log-rank analyses revealed that patients with 0–2 and 3–5 points had significantly different prognoses from those with 0–2 and 6–8 points (P<0.05 and <0.01, respectively) (Fig. 3). Among the patients with 0–2 points, 78.0, 69.7, 66.5 and 38.2% survived for 3, 6, 12 and 24 months, respectively. Among patients with 3–5 points, 63.5, 52.0, 29.0 and 21.8% survived for 3, 6, 12 and 24 months, respectively. Among patients with 6–8 points, 64.5, 29.8, 13.2 and 6.6% survived for 3, 6, 12 and 24 months, respectively (Table IIIC).
Figure 3.
Evaluation of survival rate using the Katagiri score. The Kaplan-Meier analysis for all patients revealed significantly different prognoses between patients with 0–2 and 3–5 points and those with 0–3 and 6–8 points (P<0.05 and P<0.01, respectively).
Evaluation of prognosis by the Tokuhashi score
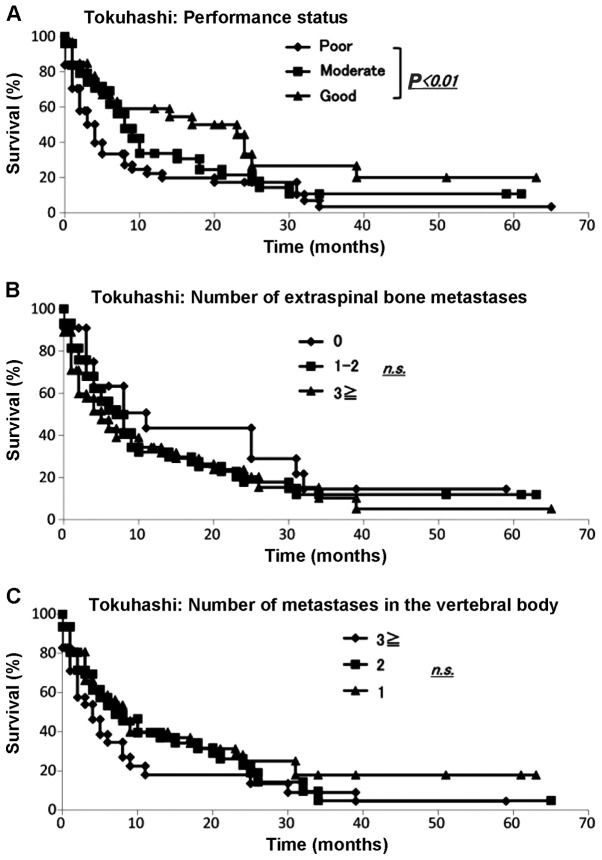
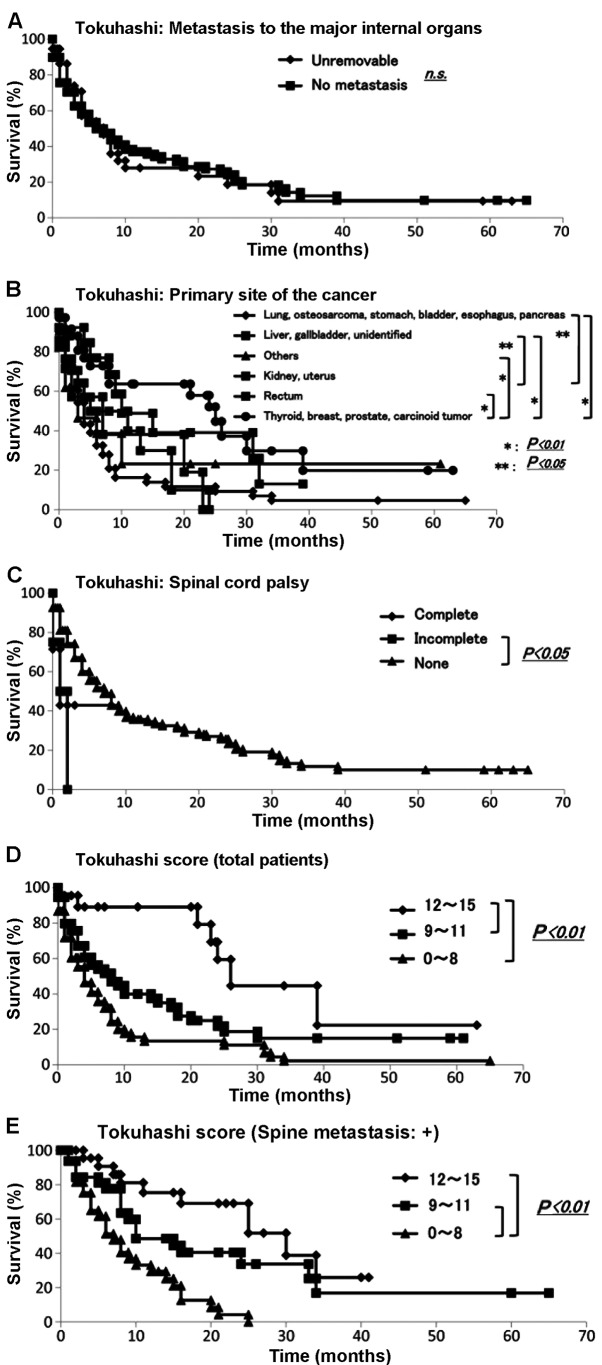
We collected data for all 145 skeletal metastasis patients regarding prognosis, performance status (6), number of extraspinal bone metastases, number of metastases in the vertebral body, presence or absence of metastases to major internal organs, site of the primary lesion and severity of palsy (7) according to the Tokuhashi score (3). The demographic data for each prognostic factor from Kagoshima University are summarized in Table IV. The Kaplan-Meier and log-rank analyses demonstrated that performance status (poor vs. good) (Fig. 4A), primary site of cancer (Fig. 5B) and palsy (incomplete vs. none) (Fig. 5C) exhibited significant differences (P<0.05). No other variable was found to be a significant prognostic factor (Fig. 4B and C; Fig. 5A).
Table IV.
Distribution of patients for each score of the Tokuhashi scoring system.
| Proportion of patients | |||
|---|---|---|---|
| Prognostic factors | All patients Kagoshima | With spine metastasis Tokuhashi (2005) | With spine metastasis Kagoshima |
| Performance status | |||
| Poor, 10–40% | 61 | N/A | 45 |
| Moderate, 50–70% | 51 | N/A | 36 |
| Good, 80–100% | 33 | N/A | 17 |
| No. of extraspinal bone metastases | |||
| ≥3 | 22 | N/A | 15 |
| 1–2 | 58 | N/A | 18 |
| 0 | 65 | 65 | |
| No. of metastases in the vertebral body | |||
| ≥3 | 36 | N/A | 36 |
| 2 | 17 | N/A | 17 |
| 1 | 45 | N/A | 45 |
| 0 | 47 | N/A | 0 |
| Metastases to the major internal organs | |||
| Unresectable | 36 | N/A | 28 |
| Resectable | 0 | N/A | 0 |
| No metastasis | 109 | N/A | 70 |
| Primary cancer site | |||
| Lung, osteosarcoma, stomach, bladder, esophagus, pancreas | 50 | N/A | 30 |
| Liver, gallbladder, unidentified | 17 | N/A | 12 |
| Kidney, uterus | 13 | N/A | 7 |
| Rectum | 7 | N/A | 5 |
| Thyroid, breast, prostate, carcinoid | 37 | N/A | 29 |
| Others | 21 | N/A | 15 |
| Palsy | |||
| Complete, Frankel A and B | 7 | N/A | 7 |
| Incomplete, Frankel C and D | 4 | N/A | 4 |
| None, Frankel E | 134 | N/A | 87 |
N/A, not available.
Figure 4.
Evaluation of Tokuhashi score. The Kaplan-Meier and log-rank analyses revealed (A) significant differences in performance status (P<0.05); (B and C) no other variable was found to be a significant prognostic factor.
Figure 5.
Evaluation of survival using the Tokuhashi score. The Kaplan-Meier and log-rank analyses revealed that (A) the presence of metastasis to the major internal organs was not statistically significant; however, (B) the primary cancer site and presence of spinal cord palsy exhibited significant differences (P<0.05); (B and C) no other variable was a significant prognostic factor. Survival rate examined by the Tokuhashi score; the Kaplan-Meier and log-rank analyses demonstrated that (D) patients with scores of 12–15 and 9–11 and those with scores of 12–15 and 0–8 had significantly different prognoses and that (E) for patients with spinal metastasis, those with scores of 12–15 and 0–8 and those with scores of 9–11 and 0–8 had significantly different prognoses (P<0.01).
We then applied the Tokuhashi scoring system to the data for all of our patients with metastases and to those with metastases only to the spine (Table VA). The results of score calculation of the total group and the spinal metastasis group revealed significant differences for both distributions compared with that of the Tokuhashi score (P<0.01). The Kaplan-Meier and log-rank analyses demonstrated that patients with scores of 12–15 and 9–11 and those with scores of 12–15 and 0–8 had significantly different prognoses (P<0.01) (Fig. 5D). Among the patients with 12–15 points, 84.4% survived for >12 months and 53.6% survived for >24 months. Among the patients with 9–11 points, 67.8, 53.1, 34.5 and 18.2% survived for 3, 6, 12 and 24 months, respectively. Among patients with 0–8 points, 58.9, 38.0, 18.9 and 16.5% survived for 3, 6, 12 and 24 months, respectively (Table VB).
Table V.
Evaluation of prognosis by the Tokuhashi scoring system for patients with spine metastasis.
| A, Proportion of patients | |||
|---|---|---|---|
| Scoring | All patients Kagoshima | Patients with spine metastasis Tokuhashi (2005)a | |
| 12–15 points | 31 | 23 | |
| 9–11 points | 54 | 67 | |
| 0–8 points | 60 | 156 | |
| Patients with spine metastasis | |||
| Scoring | Kagoshima | Tokuhashi (2005)a | |
| 12–15 points | 25 | 23 | |
| 9–11 points | 29 | 67 | |
| 0–8 points | 44 | 156 | |
| B, Tokuhashi scoring | |||
| Prognostic score | Months | Survival rate | 95% CI |
| 12–15 points | 3 | 88.8 | 0.77–1.00 |
| 6 | 88.8 | 0.77–1.00 | |
| 12 | 84.4 | 0.77–1.00 | |
| 24 | 53.6 | 0.30–0.77 | |
| 9–11points | 3 | 67.8 | 0.55–0.81 |
| 6 | 53.1 | 0.38–0.68 | |
| 12 | 34.5 | 0.20–0.49 | |
| 24 | 18.2 | 0.06–0.31 | |
| 0–8 points | 3 | 58.9 | 0.46–0.72 |
| 6 | 38.0 | 0.25–0.51 | |
| 12 | 18.9 | 0.08–0.30 | |
| 24 | 16.5 | 0.06–0.27 | |
Measured with Mann-Whitney test, P<0.01. CI, confidence interval.
As the Tokuhashi score was originally based on the prognoses of patients with metastatic spinal tumors, it was applied to our patients who suffered from metastatic spine tumors. The number of each group from Kagoshima University and Tokuhashi et al (3) are summarized in Table VA. The Mann-Whitney U test revealed that there was a statistically significant difference (P<0.05). The Kaplan-Meier and log-rank analyses demonstrated that patients with scores of 12–15 and 0–8 and those with scores of 9–11 and 0–8 had significantly different prognoses (P<0.01) (Fig. 5E).
Evaluation of prognosis by the Mizumoto score
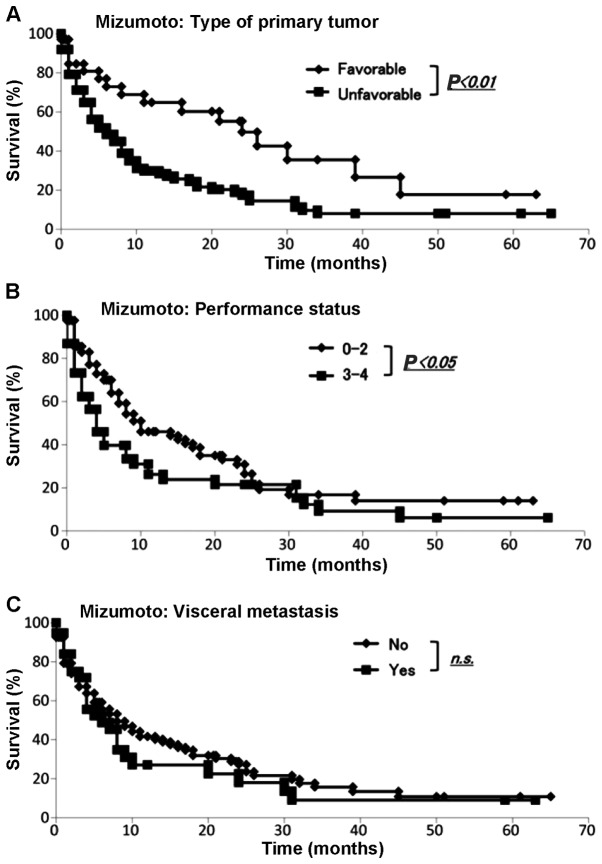
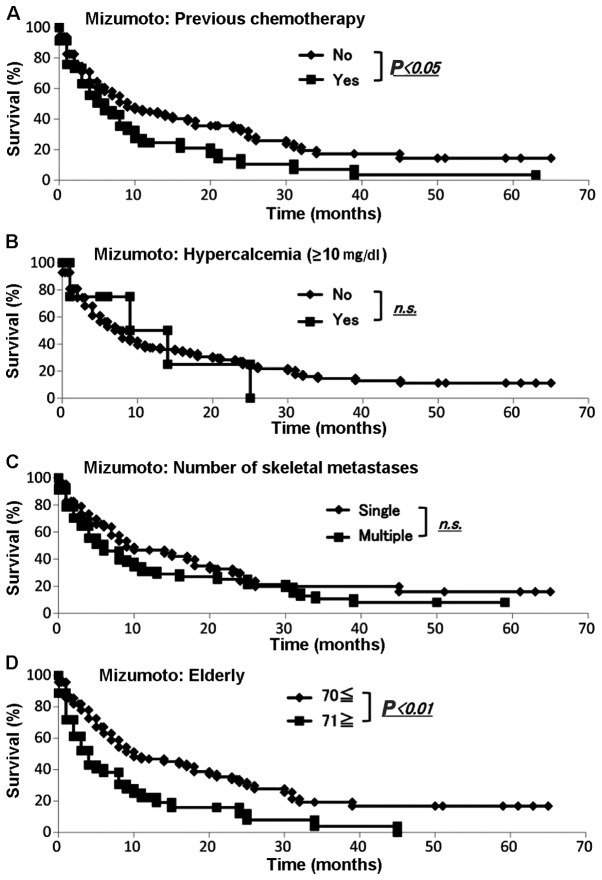
We collected the data for all our 145 skeletal metastasis patients regarding prognosis, type of primary lesion, performance status, presence or absence of visceral metastases, history of previous chemotherapy, presence or absence of hypercalcemia (>10 mg/dl), number of bone metastases and age (≥70 or <70 years) according to the Mizumoto scoring system (4). The demographic data for each prognostic factor from Kagoshima University and Mizumoto et al (4) are summarized in Table VI. We performed the Fisher's exact test to assess any significant differences between the Kagoshima University and Mizumoto score data sets. The sets differed significantly with respect to primary tumor type (P<0.05), presence or absence of visceral metastasis, history of previous chemotherapy, number of skeletal metastases (single or multiple) and age ≥71 years (P<0.01). The sets did not differ significantly with respect to performance status or total serum calcium (>10 or ≤10 mg/dl) (Table VI). The Kaplan-Meier and log-rank analyses revealed that primary tumor type (favorable or unfavorable), performance status (0–2 or 3–4) (Fig. 6A and B), history of chemotherapy (yes or no) and age (<70 or ≥71 years) (Fig. 7A and D) exhibited significant differences. By contrast, the Kaplan-Meier and log-rank analyses demonstrated that the presence of visceral metastases (yes or no) (Fig. 6C), total serum calcium (>10 or ≤10 mg/dl) and number of skeletal metastases (single or multiple) (Fig. 7B and C) were not significantly different.
Table VI.
Distribution of patients for each score of the Mizumoto scoring system.
| Proportion of patients | Kagoshima all patients | Mizumoto (2008) radiation | Fisher's exact probability test | Kagoshima radiation | Fisher's exact probability test |
|---|---|---|---|---|---|
| Type of primary tumor | <0.05 | <0.01 | |||
| Favorable | 34 | 174 | 8 | ||
| Unfavorable | 111 | 370 | 37 | ||
| Performance status | 0.29 | 0.08 | |||
| 0–2 | 84 | 331 | 22 | ||
| 3–4 | 61 | 213 | 23 | ||
| Visceral metastasis | <0.01 | <0.05 | |||
| No | 108 | 248 | 29 | ||
| Yes | 37 | 296 | 16 | ||
| Previous chemotherapy | <0.01 | <0.05 | |||
| No | 99 | 233 | 27 | ||
| Yes | 46 | 311 | 18 | ||
| Total serum calcium, mg/dl | 0.069 | <0.05 | |||
| ≤10 | 137 | 490 | 45 | ||
| >10 | 8 | 54 | 0 | ||
| Multiple bone metastases | <0.01 | <0.01 | |||
| No | 80 | 58 | 13 | ||
| Yes | 65 | 486 | 32 | ||
| Age, years | <0.01 | 0.48 | |||
| <70 | 92 | 402 | 34 | ||
| ≥71 | 53 | 142 | 11 |
Figure 6.
Evaluation of Mizumoto score. The Kaplan-Meier and log-rank analyses revealed significant differences by (A) the type of primary tumor and (B) performance status; by contrast, (C) the difference in the presence of visceral metastasis was not statistically significant.
Figure 7.
Evaluation of prognosis by the Mizumoto score. The Kaplan-Meier and log-rank analyses revealed that (A) history of chemotherapy and (D) elderly patients exhibited significant differences. By contrast, the (B) total serum calcium (≤10 or >10 mg/dl) and (C) number of skeletal metastases (single or multiple) were not significantly different.
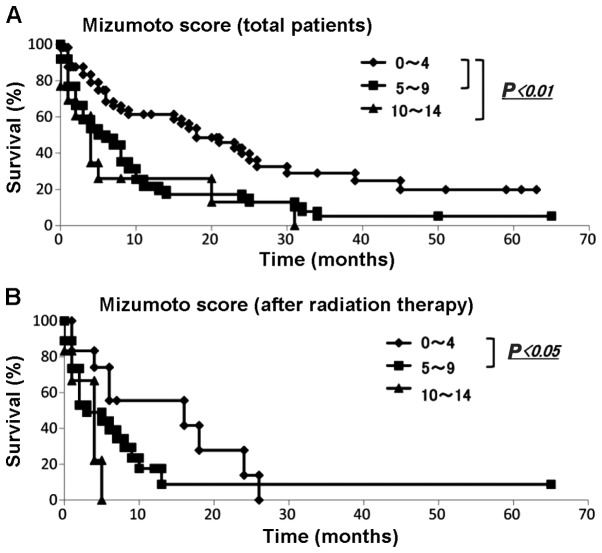
We applied the Mizumoto scoring system to the data from our patients with metastatic bone tumors. The numbers of each group from Kagoshima University and Mizumoto et al (4) are summarized in Table VIIA. The results of the scoring calculation for all patients and for the spinal metastasis patients exhibited significant differences in each distribution compared with those of Mizumoto et al (4) (P<0.01). The Kaplan-Meier and log-rank analyses demonstrated that patients with scores of 0–4 and 5–9 and those with scores of 0–4 and 10–14 exhibited significantly different prognoses (Fig. 8A). Among the patients with 0–4 points, 83.3, 68.3, 61.3 and 39.8% survived for 3, 6, 12 and 24 months, respectively. Among the patients with 5–9 points, 58.4, 48.1, 21.5 and 15.1% survived for 3, 6, 12 and 24 months, respectively. Among those with 10–14 points, 60.6, 26.0, 26.0 and 13.0% survived for 3, 6, 12 and 24 months, respectively (Table VIIB).
Table VII.
Evaluation of prognosis by the Mizumoto survival scoring system.
| A, Mizumoto score | |||
|---|---|---|---|
| Scoring | All patients Kagoshima | All patients Mizumoto (2008)a | |
| 0–4 | 58 | 131 | |
| 5–9 | 74 | 310 | |
| 10–14 | 13 | 103 | |
| Scoring | Radiation Kagoshima | Radiation Mizumoto (2008)a | |
| 0–4 | 12 | 131 | |
| 5–9 | 27 | 310 | |
| 10–14 | 6 | 103 | |
| B, Mizumoto scoring | |||
| Prognostic score | Months | Survival rate | 95% CI |
| 0–4 points | 3 | 83.3 | 0.73–0.93 |
| 6 | 68.3 | 0.55–0.81 | |
| 12 | 61.3 | 0.47–0.75 | |
| 24 | 39.8 | 0.25–0.55 | |
| 5–9 points | 3 | 58.4 | 0.47–0.70 |
| 6 | 48.1 | 0.36–0.60 | |
| 12 | 21.5 | 0.11–0.32 | |
| 24 | 15.1 | 0.05–0.25 | |
| 10–14 points | 3 | 60.6 | 0.33–0.88 |
| 6 | 26.0 | 0.01–0.51 | |
| 12 | 26.0 | 0.01–0.51 | |
| 24 | 13.0 | 0.00–0.35 | |
Measured with Mann-Whitney test, P<0.01. CI, confidence interval.
Figure 8.
Survival rate evaluated by the Mizumoto score. (A) The Kaplan-Meier analysis for all patients revealed that patients with scores of 0–4 and 5–9 and those with scores of 0–4 and 10–14 exhibited significantly different prognoses (P<0.01); (B) The Kaplan-Meier analysis of patients after radiation therapy revealed that those with scores of 0–4 and 5–9 exhibited significantly different prognoses (P<0.05).
The Mizumoto score was originally based on the prognosis of patients with spinal metastases who underwent radiotherapy; therefore, it was applied to our patients who suffered from spinal metastases and had undergone radiotherapy. The Mann-Whitney U test demonstrated that there were no statistical differences (P<0.01) (Table VIIA). The Kaplan-Meier and log-rank analyses revealed that patients with scores between 0 and 4 and between 5 and 9 had significantly different prognoses (P<0.05) (Fig. 8B).
Discussion
Using single-center data, we evaluated previously reported prognostic scoring systems in patients with bone metastases. It is difficult to determine which treatment should be selected for patients with bone metastases: Curative surgery, palliative surgery, or conservative treatment. A scoring system may be useful in predicting the prognosis of patients with bone metastases. Although scoring systems are based on statistical evaluations of data obtained from a large number of patients, there are several sampling biases.
The distributions of patients in each scoring group were statistically different between the Kagoshima and Katagiri, Tokuhashi and Mizumoto groups (P<0.01). The distributions of patients for all prognostic factors were significantly different between the SSG group and the Kagoshima group (1). The SSG patients comprised those whose extremity skeletal metastases were treated surgically. The distributions of patients for 5 of 7 prognostic factors were significantly different between the Mizumoto and Kagoshima data (4). The Mizumoto system included data from patients whose metastatic bone tumors were treated by radiation, whereas the Kagoshima data were from patients who had skeletal metastases. These differences in collection criteria may affect the differences in the group compositions. However, the distributions of patients in 3 of 5 prognostic factors were statistically different between the Katagiri and the Kagoshima data, although these two data sets were based on patients who had metastatic bone tumors (2).
Regional and hospital characteristics may also lead to sampling biases. The Katagiri data were collected at Shizuoka Cancer Center Hospital, which is one of the university hospitals in Shizuoka province. Thus, a proportion of the Katagiri patients with bone metastases may have been treated originally at other university hospitals; some of these patients achieved remission and others were referred to the Shizuoka Cancer Center Hospital. By contrast, the Kagoshima data were collected at Kagoshima University Hospital, which is the only university hospital in Kagoshima province. Almost all Kagoshima province patients with metastatic bone tumors are first referred to our department. In support of these hypotheses, the Katagiri data include a higher number of patients with visceral and cerebral metastases, lower performance status and multiple skeletal metastases. These findings suggest that differences in the background may affect the prediction of prognosis determined by scoring systems.
The predictions of prognosis were substantially different in each system's results and in our results for the good- as well as the poor-prognosis groups. The 6-month survival rates for the SSG and Kagoshima reports for group A using the SSG score were 88.1 and 65.5%, respectively. The 6-month survival rates in the Katagiri and Kagoshima patients with scores of 0–2 by the Katagiri system were 97.9 and 69.7%, respectively. The 6-month survival rates in the Tokuhashi and Kagoshima reports for patients with 12–15 points by the Tokuhashi score were 100 and 88.8%, respectively. The 6-month survival rates in the Mizumoto and Kagoshima reports for patients with 10–14 points (group A) by the Mizumoto score were 89.0 and 65.5%, respectively.
These differences suggest that it is crucial to evaluate scoring systems to determine which is the most suitable for each hospital. The Tokuhashi scoring system detected the highest survival patient group at 6–12 months (12–15 points, 88.4%) in the Kagoshima data. Patients with a life expectancy of >6 months may benefit from tumor excision and endoprosthetic reconstruction (8). These findings suggest that Tokuhashi scoring is the most appropriate scoring system for identifying patients who should be explored for curative surgical intervention at our hospital. By contrast, recovery from surgery must be shorter than the prediction of survival. The 6-month survival rates of SSG and Kagoshima patients in group C according to the SSG score were 14.3 and 8.7%, respectively. The 6-month survival rate in the Kagoshima data set among patients with 6–8 points by the Katagiri score was 29.8%. The 6-month survival rates for the Tokuhashi and Kagoshima patients with 0–8 points by the Tokuhashi score were 14.7 and 38.0%, respectively. The 6-month survival rates for the Mizumoto and Kagoshima patients in group C according to the Mizumoto score were 7.0 and 26.0%, respectively. It is difficult to select curative surgical intervention in patients with a life expectancy of <6 months (7,9). Our findings suggest that SSG scoring is appropriate in our hospital for identifying patients who are expected to live <6 months (group C, 91.3%).
The type of primary lesion, performance status, number of skeletal metastases, presence of organ metastasis, history of previous chemotherapy, spinal cord palsy, hypercalcemia and advanced age were proposed as prognostic factors by all four scoring systems, although the cut-offs and the number of prognostic factors assessed were different. Kaplan-Meier analysis demonstrated that the type of primary lesion and performance status statistically affected different prognoses in three of the four scoring systems when calculated by the Kagoshima data. However, the number of skeletal metastases and presence of organ metastases were not statistically significantly different in any of the four scoring systems when calculated by the Kagoshima data. Although we were unable to identify the cause of the differences, these results suggest that other sets of prognostic factors may be suitable as a scoring system for individual hospitals that have multidisciplinary care teams to treat metastatic bone tumors. In conclusion, prior to predicting prognosis by a scoring system, it is crucial to select the most suitable for the characteristics of each particular hospital.
Acknowledgements
The authors would like to thank Hui Gao for the excellent technical assistance and Edanz for English editing services.
References
- 1.Ratasvuori M, Wedin R, Keller J, et al. Insight opinion to surgically-treated metastatic bone disease: Scandinavian Sarcoma Group Skeletal Metastasis Registry report of 1195 Operated Skeletal Metastasis Surg Oncol. 2013;22:132–138. doi: 10.1016/j.suronc.2013.02.008. [DOI] [PubMed] [Google Scholar]
- 2.Katagiri H, Takahashi M, Wakai K, Sugiura H, Kataoka T, Nakanishi K. Prognostic factors and a scoring system for patients with skeletal metastasis. J Bone Joint Surg Br. 2005;87:698–703. doi: 10.1302/0301-620X.87B5.15185. [DOI] [PubMed] [Google Scholar]
- 3.Tokuhashi Y, Matsuzaki H, Oda H, Oshima M, Ryu J. A revised scoring system for preoperative evaluation of metastatic spine tumor prognosis. Spine. 2005;30:2186–2191. doi: 10.1097/01.brs.0000180401.06919.a5. [DOI] [PubMed] [Google Scholar]
- 4.Mizumoto M, Harada H, Asakura H, et al. Prognostic factors and a scoring system for survival after radiotherapy for metastases to the spinal column: A review of 544 patients at Shizuoka Cancer Center Hospital. Cancer. 2008;113:2816–2822. doi: 10.1002/cncr.23888. [DOI] [PubMed] [Google Scholar]
- 5.Shimada H, Setoguchi T, Yokouchi M, et al. Metastatic bone tumors: Analysis of factors affecting prognosis and efficacy of CT and 18F-FDG PET-CT in identifying primary lesions. Mol Clin Oncol. 2014;5:875–881. doi: 10.3892/mco.2014.326. [DOI] [PMC free article] [PubMed] [Google Scholar]
- 6.Oken MM, Creech RH, Tormey DC, et al. Toxicity and response criteria of the Eastern Cooperative Oncology Group. Am J Clin Oncol. 1982;5:649–655. doi: 10.1097/00000421-198212000-00014. [DOI] [PubMed] [Google Scholar]
- 7.Frankel HL, Hancock DO, Hyslop G, et al. The value of postural reduction in the initial management of closed injuries of the spine with paraplegia and tetraplegia. I. Paraplegia. 1969;7:179–192. doi: 10.1038/sc.1969.30. [DOI] [PubMed] [Google Scholar]
- 8.Quinn RH, Drenga J. Perioperative morbidity and mortality after reconstruction for metastatic tumors of the proximal femur and acetabulum. J Arthroplasty. 2006;21:227–232. doi: 10.1016/j.arth.2005.04.032. [DOI] [PubMed] [Google Scholar]
- 9.Eastley N, Newey M, Ashford RU. Skeletal metastases - the role of the orthopaedic and spinal surgeon. Surg Oncol. 2012;21:216–222. doi: 10.1016/j.suronc.2012.04.001. [DOI] [PubMed] [Google Scholar]


