

Abstract
In mice, FGF21 is rapidly induced by fasting, mediates critical aspects of the adaptive starvation response, and displays a number of positive metabolic properties when administered pharmacologically. In humans, however, fasting does not consistently increase FGF21, suggesting a possible evolutionary divergence in FGF21 function. Moreover, many key aspects of FGF21 function in mice have been identified in the context of transgenic overexpression or administration of supraphysiologic doses, rather than in a physiologic setting. Here, we explored the dynamics and function of FGF21 in human volunteers during a 10-day fast. Unlike mice, which show an increase in circulating FGF21 after only 6 hours, human subjects did not have a notable surge in FGF21 until 7 to 10 days of fasting. Moreover, we determined that FGF21 induction was associated with decreased thermogenesis and adiponectin, an observation that directly contrasts with previous reports based on supraphysiologic dosing. Additionally, FGF21 levels increased after ketone induction, demonstrating that endogenous FGF21 does not drive starvation-mediated ketogenesis in humans. Instead, a longitudinal analysis of biologically relevant variables identified serum transaminases — markers of tissue breakdown — as predictors of FGF21. These data establish FGF21 as a fasting-induced hormone in humans and indicate that FGF21 contributes to the late stages of adaptive starvation, when it may regulate the utilization of fuel derived from tissue breakdown.
Introduction
As periods of famine were an important aspect of the human evolutionary environment, the body’s adaptive ability during periods of starvation was a key survival advantage. Fibroblast growth factor 21 (FGF21) has been described as a key liver-secreted hormonal mediator of the adaptive response to starvation, a finding primarily based on data generated from mouse models (1, 2). Functions attributed to FGF21 during starvation include driving (a) ketogenesis (2, 3), (b) gluconeogenesis (3–5), (c) growth hormone resistance (6), which prevents expenditure of energy on growth, and (d) disruption of the hypothalamic-pituitary-ovarian axis (7), which minimizes the expenditure of energy on reproduction.
It might seem counterintuitive that a starvation-induced hormone would also prevent diet-induced obesity and improve glucose tolerance, but treatment of ob/ob mice with pharmacologic doses of FGF21 lowers glucose and insulin levels during oral glucose tolerance testing (8). Furthermore, FGF21 transgenic mice demonstrate improved glucose clearance and insulin sensitivity as compared with their WT littermates (8). FGF21 mediates this improvement in glucose clearance in part through an insulin-independent pathway involving glucose transporter 1 (GLUT1) (8). FGF21 transgenic mice are also resistant to a high-fat/high-carbohydrate diet; despite eating more food than do their WT littermates, they gain less weight (8), an effect that appears to be at least partially mediated by induction of thermogenesis (9–14). Why a hormone that is upregulated during starvation would enhance weight loss and induce thermogenesis is unknown.
The confluence of positive preclinical data showing beneficial metabolic effects of FGF21 in mouse models has provided a rationale to develop FGF21 or related mimetics for the treatment of human obesity and diabetes mellitus (15, 16), despite ongoing questions regarding the conservation of FGF21 regulation and function between mice and humans. Indeed, the original paradigm of FGF21 as a fasting-induced hormone has not seamlessly translated to humans. One small study that measured serum FGF21 before and after a 7-day fast in patients with rheumatoid arthritis demonstrated a modest 74% increase in FGF21 levels (17). Subsequently, however, numerous studies have demonstrated no change in FGF21 levels with fasting for up to 72 hours (18–20). Moreover, women with anorexia nervosa, a state of chronic nutritional deprivation, have reduced or similar levels of FGF21 as compared with levels in normal-weight controls (21, 22). Therefore, it is unknown whether these contradictory results are due to interstudy differences in the duration of fasting or whether they speak to a lack of generalizability of the fasting effect observed in rheumatoid arthritis.
Therefore, the primary aim of this study was to test the hypothesis that fasting induces circulating levels of FGF21 in humans and, secondarily, to determine whether the functions attributed to FGF21 in murine models also apply to humans. We reasoned that a prolonged fast was necessary to definitively test this hypothesis and therefore recruited healthy individuals to undergo a medically supervised fast for 10 days, following a previously published protocol (23, 24). We performed (a) serial measurements of circulating FGF21 levels and factors that have been functionally linked to FGF21 in animal models, such as ketones; (b) pre- and post-fasting PET/MRI scans to measure brown adipose tissue (BAT); and (c) serial transcriptional analysis of white adipose tissue (WAT) biopsy specimens to assess the expression of FGF21 pathway genes. The analyses of multiple time points over the course of the 10-day fast allowed us to leverage a relatively small cohort to dissect both the fasting-mediated dynamics of FGF21 and to gain a greater understanding of the role of FGF21 in the adaptive starvation response.
Results
Circulating FGF21 is induced by prolonged fasting in humans.
To test whether FGF21 is induced by fasting in humans, we serially measured circulating levels over the course of a 10-day fast in healthy human volunteers. We recruited volunteers ranging in age from 22.4 to 48.3 years, who were normal to slightly overweight. Baseline clinical characteristics are listed in Table 1. All female subjects were premenopausal and had regular menstrual cycles. BMIs ranged from 22.7 to 29.3 kg/m2, and baseline serum glucose levels were all within the normal fasting range (<100 mg/dl). Baseline FGF21 levels were similar to the pre-baseline FGF21 levels (median [interquartile range]: pre-baseline = 124 [46, 491] pg/ml vs. day 0 = 182 [50, 304] pg/ml, P = 0.33). Consistent with previous studies (25), there was a trend toward positive associations between baseline insulin and homeostatic model assessment for insulin resistance (HOMA-IR) and baseline FGF21 levels (Supplemental Figure 1; supplemental material available online with this article; doi:10.1172/JCI83349DS1). Then, over the course of the fast, FGF21 levels significantly increased (P = 0.02), with mean FGF21 levels on day 10 that were 4-fold higher than mean baseline (day 0) levels (day 0: mean ± SEM = 188 ± 46 pg/ml vs. day 10 = 799 ± 189 pg/ml, P < 0.03) (Figure 1). Only 1 subject did not have an increase in FGF21 levels on day 10 as compared with baseline levels (baseline FGF21 level: 452 pg/ml and day-10 FGF21 level: 230 pg/ml). Remarkably, FGF21 levels declined in most subjects during the early phase of the fast, and it was only in the later stages of the fasting protocol (days 7–10) that we observed a marked surge in FGF21 levels (Figure 1). We also considered the possibility that we were measuring the accumulation of inactive FGF21. Therefore, we re-measured our samples using an assay specific for the intact protein (Supplemental Figure 2). These measurements were consistent with those of the initial finding, therefore providing independent confirmation for the late, fasting-mediated surge in functional FGF21. While these data provide strong evidence in support of FGF21 as a fasting-induced hormone, the unexpected trajectory of FGF21 levels raises the possibility that FGF21, as reflected in circulating levels, has a role in the late adaptive starvation response.
Table 1. Baseline characteristics of the study subjects.
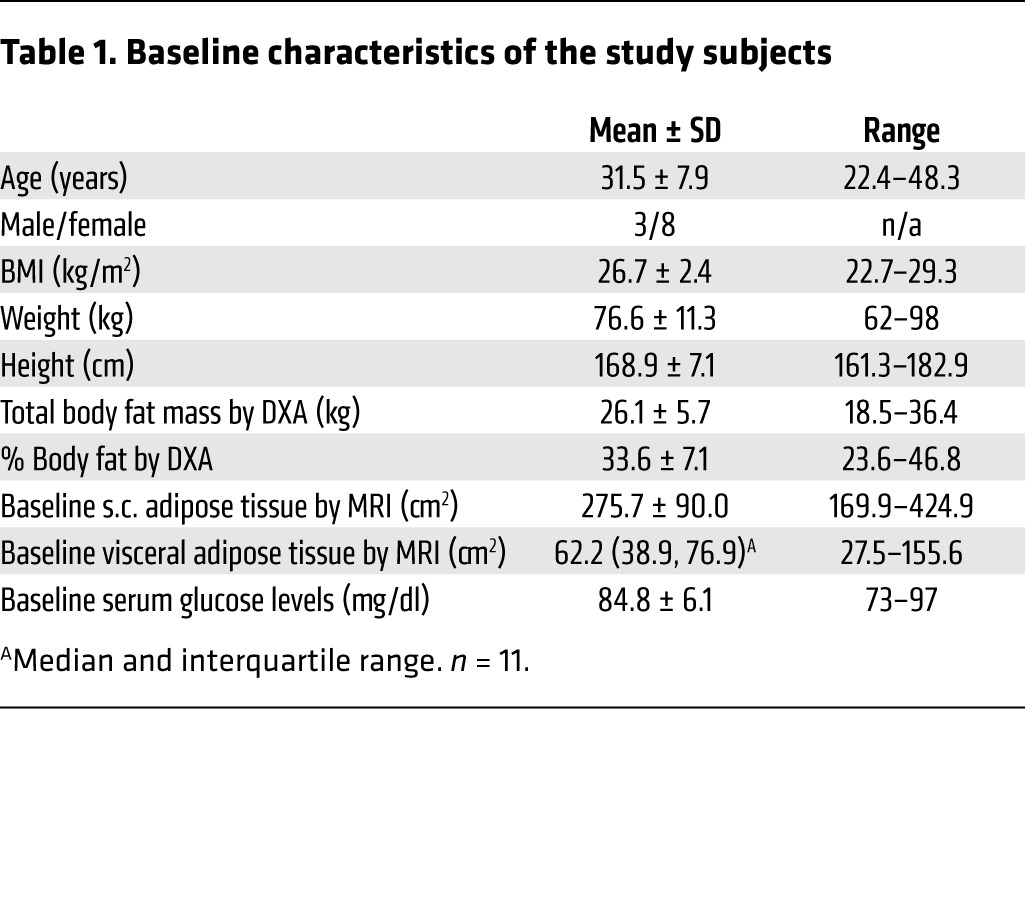
Figure 1. Circulating FGF21 is induced by prolonged fasting in humans.

(A) Spaghetti plot showing serial FGF21 serum measurements over a 10-day fasting period. (B) Fasting FGF21 data displayed with Tukey box plots. After an initial downward trend in serum FGF21 levels, a significant surge in circulating FGF21 was observed at the 10-day time point when compared with baseline values. P < 0.03, paired t test.
Fasting-induced FGF21 does not lead to induction of thermogenic fat in humans.
Although seemingly paradoxical, FGF21 has consistently been implicated in the induction of adaptive thermogenesis in WAT (10–14); therefore, we considered the possibility that fasting-induced circulating FGF21 would drive thermogenesis. We performed pre- and post-fasting PET/MRI scans of 7 of the human subjects who completed the study (8 subjects had a baseline scan). At baseline, 5 of 8 subjects (62.5%) or 5 of 7 (71.4%) of the study completers showed areas of fluorodeoxyglucose (FDG) activity in supraclavicular and neck fat after cooling that were consistent with BAT. On day 10, which coincided with a marked increase in circulating FGF21 levels, we found that FDG activity in supraclavicular and neck fat disappeared in all 5 of the subjects who had detectable thermogenic adipose tissue at baseline (Figure 2A, binomial test, P < 0.05).
Figure 2. Human fasting is associated with downregulation of thermogenic activity in adipose tissue.

(A) FDG-PET/MRI images of a representative subject before and after the 10-day fast. In coronal FDG-PET images (top row), arrows indicate FDG uptake in the cervical and supraclavicular regions at baseline, which disappeared with fasting. T1-weighted MRI images (middle row) and fused FDG-PET/MRI images (bottom row) localized FDG uptake to adipose tissue, consistent with BAT. Of the 5 subjects with detectable BAT at baseline, none had significant areas of FDG avidity after 10 days of fasting. P < 0.05, binomial test. (B) qPCR performed on human periumbilical sWAT samples collected at baseline and on days 1 and 10 of fasting showed fasting-mediated downregulation of transcriptional regulators of the thermogenic program. Data are expressed as the mean ± SEM and were analyzed by repeated-measures ANOVA and Dunnett’s test for multiple comparisons (n = 7). Note: UCP1 was measured but not detectable; PRDM16 data represent a subset of 5 subjects with detectable transcript levels. *P < 0.05, **P < 0.01. (C) Resting energy expenditure measured by indirect calorimetry. Note that the y axis starts at 800 kcal/d. (D) Serial circulating adiponectin during human fasting. Data are normalized to baseline values and displayed as Tukey box plots. P < 0.01, paired t test. Mean baseline adiponectin level: 9.9 μg/ml ± 5.7 (SD). Note that the y axis starts at 50%. (E) Serial circulating total T3 levels during human fasting. Data are normalized to baseline values and displayed as a Tukey box plot. P < 0.01, baseline level compared with day 10 using a Wilcoxon signed-rank test. Median baseline T3 level with interquartile range: 116.6 ng/dl (99.3, 129.7). Note that the y axis starts at 50%. (F) qPCR performed on the samples analyzed in B demonstrate fasting-mediated downregulation of thyroid effector genes in human sWAT. Repeated-measures ANOVA and Dunnett’s test for multiple comparisons were used to analyze the data, which are presented as the mean ± SEM. *P < 0.05, **P < 0.01, ***P < 0.005.
We also performed quantitative PCR (qPCR) on periumbilical fat biopsy samples collected at baseline and on days 1 and 10 to assess the expression of key genes involved in the thermogenic program. We did not reliably detect uncoupling protein 1 (UCP1) at any of the time points, which may be due to the fact that thermogenic activity is not typically seen with FDG imaging at the sampling site, including in the present study. We did, however, observe downregulation of other key transcriptional regulators of the thermogenic program, including CIDEA and PPARγ coactivator 1 α (PGC1A) (Figure 2B). These data must be interpreted with caution, given the sampling site; however, the effect of fasting on key transcriptional regulators of the thermogenic program is consistent with the PET imaging data in demonstrating a fasting-mediated suppression of thermogenesis, while coinciding with the reduced energy expenditure observed during starvation (Figure 2C).
Because the effects of supraphysiologic FGF21 on energy expenditure in fed mice appear to be dependent on adiponectin, and FGF21 potently stimulates adiponectin secretion in mice (26, 27) and humans (15), we also measured the dynamics of adiponectin in this fasting study. Although adiponectin levels have previously been shown to be stable during a 72-hour fast (28), the known inverse association between measures of adiposity and circulating adiponectin (29) provided an additional rationale to test whether adiponectin levels would rise concurrently with FGF21 levels in the setting of weight loss during a prolonged fast. We found the opposite, however, as there was a modest decline in circulating adiponectin levels in all subjects completing the fast (Figure 2D). Together, these data suggest that the FGF21/adiponectin axis is not functional in humans in the context of starvation. Because the downstream effects of FGF21 may be context specific, these data do not exclude the possibility that FGF21 actions on adipose tissue, such as stimulation of adiponectin or thermogenesis, are evident in the fed state or after administration of supraphysiologic doses.
Given that the fasting-mediated reduction in energy expenditure has been linked to decreased thyroid hormone levels, we also examined the thyroid axis by measuring triiodothyronine (T3) levels and the transcription of thyroid hormone effector genes to determine whether these were associated with changes in FGF21 levels. Consistent with previous studies (30), we found that T3 levels decreased with fasting; T3 levels dropped by day 3 of the fast, and the lower levels were maintained throughout the remainder of the fast (Figure 2E). All subjects had final-fast-day T3 levels that were lower than their baseline levels. In addition, in human WAT, the thyroid effector genes were generally downregulated by fasting (Figure 2F), including significant reductions in the thyroid hormone receptors α1 and β1 (TRAC1 and THRB), thyroid hormone–responsive spot 14 (S14), and sterol regulatory element–binding protein 1c (SREBP1c). We observed similar results in murine WAT (Supplemental Figure 3). The time course of T3 reduction did not correlate with the fasting-mediated increase in FGF21 levels, nor were starvation-induced FGF21 levels associated with indices of resting energy expenditure. These data are consistent with those of prior studies demonstrating that the effects of FGF21 and T3 on energy expenditure are largely independent (31, 32) and support the concept that any potential effect of FGF21 that promotes BAT activity or increases energy expenditure is overwhelmed in the starvation state by regulatory forces favoring energy conservation.
FGF21 is not a causal mediator of the ketogenic response in humans.
FGF21 was originally described as a mediator of the starvation-induced ketogenic response in mice (1–3), although this has not been consistently shown in all studies. In fact, a study of FGF21-null mice demonstrated an increase in ketogenesis after a 24-hour fast (33). In humans, supraphysiologic administration of an FGF21 analog results in a rise in serum ketones (15). This provided the rationale to test whether circulating FGF21 in humans is causally linked to ketosis. During the 10-day fast, we found a marked induction of ketones (P < 0.01 at all time points, corrected for multiple comparisons) in the serum (Figure 3A), with peak levels achieved between days 1 and 3 of fasting. Importantly, ketone dynamics during fasting differed markedly from that of circulating FGF21, with ketone levels rising prior to the rise in FGF21 levels (Figure 3B). At the time point at which an individual’s ketone levels rose at least 10-fold compared with baseline, the mean change in FGF21 levels from baseline was –38 ± 47 pg/ml. Importantly, there was no significant difference between FGF21 levels at baseline compared with FGF21 levels at the time point at which ketone levels increased by at least 10-fold (P = 0.43).
Figure 3. FGF21 does not drive ketogenesis in human fasting.

(A) Serial serum ketone measurements during fasting in humans. Ketones were significantly elevated in the serum by the first fasting day and remained elevated for the duration of the fast. Data are shown as Tukey box plots. Kruskal-Wallis test, followed by the Dunn’s correction for multiple comparisons. P < 0.01 at all time points. (B) Line plot overlay of serum FGF21 and ketone levels in fasting humans. The onset of ketogenesis occurred by day 1 of fasting during the initial downward trend in serum FGF21 levels. Serum FGF21 peaked on day 10 of fasting, approximately 7 days after achievement of near-peak ketone levels. (C) Fasting in C57BL/6 mice (n = 5/time point) led to significantly elevated serum FGF21 levels after 6 or 24 hours of fasting compared with baseline measurements in the fed state. ANOVA and Dunnett’s multiple comparisons correction. Data are shown as Tukey box plots. (D) Ketones were measured in the same serum samples as in C (n = 5/time point). Ketones were not significantly elevated until the 24-hour time point. ANOVA and Dunnett’s multiple comparisons correction. Data are shown as Tukey box plots. β-OH-butyrate, β-hydroxybutyrate.
As a comparison, we also performed a similar analysis in WT C57BL/6 mice subjected to fasting for up to 24 hours, followed by 6 hours of refeeding. In these mice, we detected an early induction of FGF21 in serum after only 6 hours of fasting that became more elevated at the 24-hour time point (Figure 3C). Because mice are known to rapidly lose weight during fasting, this raises the question of whether interspecies differences in weight loss rates could explain the difference in FGF21 dynamics. Indeed, the C57BL/6 mice used in this study lost an average of 17.4% ± 1.6% (SD) of their BW over a 24-hour fasting period, whereas the human subjects lost 9.2% ± 0.93% (SD) of their BW over the 10-day fast. However, human subjects had already lost the majority of the weight (6.6% ± 3.7% of their initial BW) at the time of their increase in FGF21 levels. In contrast, mice showed an increase in circulating FGF21 levels 6 hours into the fast, when they had lost only 2.9% ± 3.6% of their BW. This suggests that the interspecies difference is not solely due to differences in the rates of weight loss. Moreover, consistent with the previously demonstrated role of FGF21 in the ketogenic response in mice, we found that the FGF21 release into serum preceded the elevation in serum ketones, which were significantly elevated at the 24-hour time point (Figure 3D). Therefore, these data reveal an interspecies difference in both the time scale of FGF21 release and its temporal relationship to the ketogenic response in starvation. Whereas the time course of FGF21 release in mice is consistent with a role in ketogenesis, our data strongly suggest that circulating FGF21 is not a key driver of fasting-induced ketogenesis in humans.
Fasting-induced FGF21 and the late response to starvation.
To develop new hypotheses for FGF21 function during human starvation, we performed exploratory analyses of the association of FGF21 with other biologically plausible measures of physiology and metabolism. Among other changes, we observed that subjects lost weight, reduced their energy expenditure, and altered their lipid trafficking over the course of the 10-day fast (Supplemental Figure 4). However, none of the changes in these variables were significantly correlated with the change in FGF21 levels at day 10 over baseline levels (Supplemental Table 1).
We then focused specifically on metabolic processes previously linked to prolonged starvation, including (a) the development of relative peripheral insulin resistance and (b) the breakdown of tissue protein for use as an alternate fuel source. In examining serially measured variables with biologically plausible relationships with the metabolic adaptation to starvation, we observed that only insulin, HOMA-IR, nonesterified fatty acids (NEFA), and serum transaminases displayed late changes grossly resembling the dynamics of FGF21 (Figure 4). We therefore performed a longitudinal analysis of the association of these variables with log-transformed FGF21 using a mixed-effects model. Random effects were included for each subject, and a first-order autocorrelation structure grouped by subject was fit to model the time correlation in the error terms.
Figure 4. Correlation of FGF21 with serum markers of late starvation in humans.

Parameters for A–E are displayed as Tukey box plots with a line graph of mean serum FGF21 values (red) superimposed for reference. (A) Serum insulin levels. (B) HOMA-IR levels. (C) Serum NEFA. (D) Serum ALT levels. (E) Serum AST levels.
The longitudinal analysis showed no significant effect of insulin, HOMA-IR, or NEFA on FGF21 levels (Table 2), consistent with the notion that the induction of FGF21 is not directly related to the alterations in peripheral tissue insulin signaling. In contrast, in unadjusted analyses, both serum transaminases — aspartate aminotransferase (AST) and alanine aminotransferase (ALT) — had significant predictive effects on FGF21. After adjustment for the repeated analyses, the effect of AST remained significant (P = 0.04).
Table 2. Longitudinal analysis of predictors of log-transformed FGF21 using a mixed-effects model.

While ALT is typically more specific to liver cell death, AST is liberated by tissue breakdown in a wide variety of tissues including skeletal muscle and rbc. The analysis suggesting an association between AST and FGF21 during fasting is thus consistent with the concept that FGF21 has a role in the latter stages of the human adaptive starvation response, when tissue stress becomes evident by transaminase release and when glucose homeostasis is increasingly reliant on the shunting of liberated amino acids to gluconeogenesis in the liver. The role of FGF21 and peripheral tissue fuel shifting in the late starvation response is also strongly supported by investigations in mice (3, 5, 34). Therefore, unlike ketogenesis, this link between FGF21 and the late starvation response in humans suggests this as a conserved physiological role for fasting-induced FGF21.
Although this study was not designed to measure tissue catabolism and fuel shifting, we explored this hypothesis further with additional secondary analyses of indirectly related indices of circulating amino acids and body mass. Classic starvation studies conducted in obese subjects by Cahill and colleagues (35) suggested that although circulating amino acid levels were largely related to kidney excretion, circulating levels of certain amino acids surged within the approximate time window of the FGF21 surge. On the basis of this work, we measured glutamine, branched-chain amino acids, and glucagon in the stored serum samples. We observed a gradual reduction in glutamine and a surge in branched-chain amino acids approximately 3 days into the fast, similar to the findings of Cahill and colleagues (ref. 35 and Figure 5, A–C). However, these variables were not significantly correlated with FGF21 levels in a longitudinal analysis, likely reflecting the diverse factors affecting circulating amino acid levels.
Figure 5. Correlation of FGF21 with weight loss in humans.

(A) Serum glutamine levels are displayed as a Tukey box plot. Note that the y axis starts at 0.4 mM. (B) Serum branched-chain amino acids are displayed as a Tukey box plot. (C) Serum glucagon levels are displayed as a Tukey box plot. For A–C, the line graphs of mean serum FGF21 values (red) are superimposed for reference. (D) Tukey box plot displaying daily cumulative weight loss in the fasting human subjects. (E) Individual FGF21 measurements are plotted in relation to the absolute amount of weight loss. Each subject is plotted using a different color, with the dots ranging from unfilled to solid as a function of the duration of fasting. In a longitudinal model, there was a significant association between FGF21 levels and weight loss (P = 0.049); this relationship remained significant when controlling for sex (P = 0.026).
In our initial analyses, we found no association between FGF21 and BMI, percentage of body fat, or visceral adipose tissue when looking at the change from baseline to the final day of fasting (Supplemental Table 1), nor did we find an association between baseline BMI and onset of FGF21 induction. To further explore the time course of weight loss as a potential indicator of adaptive fuel shifting to conserve muscle mass, we reviewed the subjects’ charts and collected the daily body mass measurements to allow a longitudinal analysis. We observed no significant association between FGF21 levels and total weight or percentage of weight loss; however, we observed a statistically significant positive association between FGF21 levels and absolute weight loss (P = 0.049, Figure 5, D and E). Unexpectedly, subjects with the most weight loss had the most delayed upregulation of their FGF21 levels (Figure 5E). Since weight loss not normalized to BW is correlated with sex, we included sex as an additional fixed effect in the model, but the effect of weight loss remained significant (P = 0.026). We hypothesize that these data, together with the transaminase data, suggest that each individual has a threshold of fasting-mediated weight loss that, when exceeded, is manifested by markers of tissue stress and breakdown and FGF21 release.
Tissue-specific transcription regulation of FGF21 pathway genes with fasting in mice and humans.
Because of the absence of a clear link between fasting-induced FGF21 and previously predicted functional outcomes, such as induction of ketogenesis and adipose thermogenesis, we hypothesized that the hormonal activities of FGF21 may be further regulated at the level of target tissues and therefore profiled the transcriptional activity of FGF21 and related genes as an indication of tissue-specific FGF21 activity. We first performed transcriptional analysis in the mouse, which allowed a comparison of FGF21 pathway genes across metabolically relevant tissues. Because the fasting-mediated induction of circulating FGF21 is thought to occur primarily in the liver, we analyzed the mouse liver during fasting and refeeding as a positive control. As expected, we found a marked early fasting–mediated increase in the transcriptional activity of FGF21 pathway genes in the mouse liver, an effect that was largely reversed during refeeding (Figure 6A). This included a significant increase in the transcription of a key transcriptional determinant of FGF21, PPARα (Ppara), Fgf21 itself, and a key component of the FGF21 receptor complex, klotho β (Klb) (Figure 6A). Relative to the liver, FGF21 transcriptional activity in both skeletal muscle and WAT was significantly lower, consistent with a previous report that the liver is the dominant source of circulating FGF21 (36). Although fasting did not result in significantly altered FGF21 transcript levels in skeletal muscle, we did observe an increase in fibroblast growth factor receptor 1 (Fgfr1) and a significant increase in the levels of the downstream glucose transporter 1 (Glut1), perhaps due to a hormonal effect of elevated circulating FGF21 (Figure 6B). In contrast to the upregulation of FGF21 in the liver, fasting led to a decline in FGF21 pathway genes in WAT that was statistically significant for Pparg and Klb (Figure 6C). With refeeding, the fasting effect was reversed and, in some instances, markedly increased above the baseline fed state.
Figure 6. Divergent tissue-specific transcriptional activity of the FGF21 pathway genes with fasting.

(A) Bar graph (mean ± SEM) of qPCR measurements of FGF21 pathway genes in murine liver in the fed and fasted states (n = 5). (B) Bar graph (mean ± SEM) of qPCR measurements of FGF21 pathway genes in murine skeletal muscle in the fed and fasted states (n = 5). (C) Bar graph (mean ± SEM) of qPCR measurements of FGF21 pathway genes in murine inguinal sWAT in the fed and fasted states (n = 5). For A–C, data were compared using ANOVA and Sidak’s correction of multiple comparisons (baseline vs. 6 and 24 hours of fasting, 24 hours of fasting vs. refed). (D) Bar graph (mean ± SEM) of qPCR measurements of FGF21 pathway genes in human periumbilical sWAT. Repeated measurements made at baseline and on days 1 and 10 of fasting. Fasting measurements were normalized to baseline measurements. *P < 0.05, **P < 0.01, ***P < 0.005, repeated-measures ANOVA, with Dunnett’s correction of multiple comparisons (n = 7).
Using periumbilical biopsy specimens collected from the human subjects at baseline (day 0) and on days 1 and 10, we were also able to measure the effect of fasting on FGF21 pathway activity in human WAT. We found that fasting was associated with downregulation of FGF21 transcriptional activity (Figure 6D). Similar to the mouse, however, the FGF21 qPCR amplification plots revealed low cycle threshold values for human WAT samples (median [interquartile range] = 35.8 [34.8, 36.9]), consistent with the concept that local regulation of WAT FGF21 production does not contribute significantly to circulating levels of FGF21 (36). Relative to baseline measurements, KLB was markedly downregulated in s.c. WAT (sWAT) biopsy samples at day 1 and day 10, and FGFR1 was significantly reduced at the day-10 time point (Figure 6D). These data suggest similarities in the adipose tissue response to fasting in mice and humans with respect to FGF21 pathway genes. The transcriptional downregulation of FGF21 receptors in WAT with fasting may render WAT resistant to the fasting-mediated increase in FGF21 levels, which offers one potential explanation for why the fasting-mediated increase in FGF21 levels did not translate into activation of a thermogenic program in WAT or stimulation of adiponectin release. Moreover, these data are consistent with the concept that FGF21 activity during fasting is differentially regulated in a tissue-specific manner, in part by transcriptionally modulating components of the FGF21 receptor complex.
Discussion
The adaptive response to starvation includes a series of key physiologic changes in fuel utilization, starting with the exhaustion of glycogen stores, then a subsequent shift to ketogenic utilization of fatty acids liberated from adipocytes, and, finally, breakdown of tissue proteins to produce glucose (37). Certain aspects of the starvation response, such as the depletion of adipose lipid stores and serum triglycerides, could, in theory, provide metabolic benefits if recapitulated outside the context of starvation, such as in obese individuals. This concept underscores the intense excitement elicited by the discovery of FGF21 (8), a novel fasting-induced hormone in murine models. Having been ascribed a central role in coordinating the ketogenic response to starvation (1, 2), FGF21 also mediates additional metabolically beneficial functions in mice by promoting improved insulin sensitivity (8) and “browning” of WAT (10–13). Although such preclinical mouse data provided a rationale to develop FGF21 or FGF21 mimetics to treat human metabolic disease, the very question of whether FGF21 is a fasting-induced hormone in humans has remained unresolved.
In this study, in which healthy volunteers underwent a prolonged, medically supervised fast, we provide strong evidence for induction of FGF21 over a 10-day period. By documenting the serial dynamics of circulating FGF21, we provide insight into why it has been so challenging to establish FGF21 as a fasting hormone in humans: namely, the protracted time scale necessary to elucidate the response. Not only did it take the full 10 days to demonstrate a statistically meaningful induction of FGF21, but we also observed an initial decline in FGF21 levels in the majority of subjects.
In considering potential explanations for the differing dynamics of circulating FGF21 between mice and humans, it is tempting to invoke the divergent metabolic rates between the 2 species. Indeed, the mass-specific resting metabolic rate of mice exceeds that of humans by a factor of approximately 7 (38), which approximates the time-scale difference in the FGF21 effect between mice and humans (Figures 1 and 3). Our data, however, suggest that the difference between mice and humans with respect to FGF21 regulation and function may go beyond the time course of its release into the circulation. In contrast to the pattern observed in fasting mice, the ketogenic response in our human subjects preceded the induction of FGF21. Importantly, in several patients, the onset of ketosis occurred at a time point when serum FGF21 levels had dropped below baseline values. While this study does not exclude the possibility that FGF21 promotes ketone production in some contexts — such as was observed in modest fashion with administration of an FGF21 analog at supraphysiologic doses (15) — these data argue strongly against a paradigmatic role for FGF21 as a determinant of the human ketogenic response to starvation.
Given the somewhat paradoxical role ascribed to FGF21 in the activation of a thermogenic program in murine adipose tissue (10–13), we also explored the possibility that prolonged fasting would lead to activation of a thermogenic program in humans. Despite inducing a robust increase in circulating FGF21 levels with fasting, we demonstrate a decrease in thermogenic fat activity, by both PET imaging and at the level of the thermogenic gene program. The observed downregulation of thermogenic activity is a likely mechanism for conserving energy during starvation, as manifested by the reduction in resting energy expenditure observed in this study and others (39, 40). Although these data do not exclude the possibility that FGF21 or its mimetics may promote thermogenesis in other contexts, it does suggest that elevations in circulating FGF21 levels alone are insufficient to activate a thermogenic program.
As 2 paradigmatic functions of FGF21 were not evident in this study of physiologic FGF21 induction during human fasting, what insight can we derive regarding its role in the adaptive starvation response? Given the delayed time course of FGF21 production in humans, we hypothesized a functional relevance in the late phases of the starvation response, finding significant associations between FGF21 and both AST (a marker of tissue breakdown) and weight loss in a longitudinal analysis. The induction of AST with fasting has previously been demonstrated in humans; however, interestingly, it was shown that concurrent administration of small doses of oral glucose — insufficient to correct the marked negative calorie balance — reversed the fasting-mediated increase in serum AST levels, while also improving markers of protein catabolism (41). We speculate that each individual has a threshold of weight loss during starvation that, when exceeded, results in tissue stress (marked by AST release) and FGF21 production. Consistent with recent work in mouse models suggesting that FGF21 drives a “feed-forward” loop contributing to gluconeogenesis during prolonged fasting (34), FGF21 may participate in the late starvation response as a hormonal link between tissue stress and liberation of amino acids and their downstream utilization by the liver for gluconeogenesis and/or the shunting of newly synthesized glucose to needy tissues. Although we did not find an association between FGF21 and serum levels of glutamine or branched-chain amino acids in this study, definitively exploring the relationship between FGF21 and the products of tissue catabolism will require a dedicated prospective study, in which the various metabolic pathways that dictate absolute serum amino acid levels are accounted for, including excretion, anabolism, catabolism, and fuel utilization.
FGF21 may also direct tissue-specific glucose utilization, as suggested by studies demonstrating FGF21-stimulated glucose uptake in skeletal muscle and adipose tissue (42, 43). Indeed, we speculate that the functional effects of circulating FGF21 on glucose utilization, for example, are refined by dynamic modulation of its cognate receptors in a tissue-specific manner. Consistent with this hypothesis, we show that fasting results in the transcriptional downregulation of FGF21 pathway genes, including key components of the receptor complex, in murine and human WAT, which may provide a mechanism for energy conservation by inhibiting both glucose trafficking to adipocytes and activation of WAT thermogenesis. In skeletal muscle, however, the transcription of FGF21 receptors is maintained with fasting, which, in concert with the rise in serum levels, is associated with increased expression of downstream GLUT1 in mice. Therefore, the FGF21 pathway may be the critical gatekeeper, shunting glucose away from utilization by adipose tissue in favor of the needs of more critical organs, thereby minimizing unnecessary energy expenditure in the face of starvation.
An important and recurring point of emphasis in this discussion is that our data are most directly applicable to the regulation and physiologic function of FGF21 in the starved state. While the induction of FGF21 in this human study required the fairly dramatic stimulus of prolonged and complete calorie abstinence, other studies have found evidence for FGF21 release in response to more narrow nutritional interventions, such as with acute carbohydrate administration (44) or prolonged protein restriction (45). A limitation of this study is the fact that we were not able to explore all of the potential physiologic functions of FGF21 during fasting, including its effects on growth hormone resistance and the reproductive axis, areas which may be more easily explored in longer-term fasting studies. With regard to the functional activity of FGF21, some areas where our human data seemingly contradict previous animal studies may be related to interspecies differences, as most paradigmatic functions of FGF21 have been elucidated in mice. However, nutritional status may also represent a key to understanding the functional activity of FGF21 in target tissues. For example, it is possible that the administration of FGF21 to humans in the fed state may promote increased energy expenditure and uncoupled thermogenesis. If FGF21 or related mimetics continue to advance through the drug development pipeline, it may be that their efficacy and any potential off-target effects will be highly dependent on coexistent nutritional status.
In summary, a key strength of this study is the repeated measurement of critical serum factors over a 10-day fasting period in humans, which allowed us to dissect the dynamics of serum FGF21 and several factors hypothesized to be functionally relevant to FGF21 activity. With this analysis, we establish FGF21 as a fasting-induced hormone in humans, but over a time scale that is an order of magnitude longer than in mice. We also observed a dissociation of the earlier ketogenic response from the late FGF21 surge in humans, thereby demonstrating that circulating FGF21 is not a mediator of fasting-induced ketogenesis in humans. Importantly, the late increase in FGF21 levels in humans correlated with weight loss and markers of tissue stress, providing a rationale to focus future mechanistic studies on the role of FGF21 in regulating fuel production and trafficking during the latter phase of starvation, with a particular focus on human studies, given the apparent evolutionary divergence in some FGF21 functions between mice and humans. With regard to the potential therapeutic implications of this study, we cannot assume that any hypothesized functional roles of FGF21 in the starved state are relevant to supraphysiologic administration of FGF21 mimetics in patients with metabolic disease; however, this study underscores the emerging concept that the nutritional state has profound implications not only for the production of FGF21 (44, 45), but also for its functional activity in target tissues.
Methods
Human subjects and protocol
We studied 11 subjects (8 women and 3 men; mean age, 31.5 years; range, 22.4–48.3 years) who were between 101% and 130% of their ideal BW. The subjects were recruited through on-line advertisements, and all had normal thyroid function and regular menstrual cycles (women). Subjects with a history of an eating disorder or any chronic illness, including diabetes mellitus, were excluded. The subjects initially presented for a visit approximately 10 days before the initiation of the fast (range, 9–11 days for study completers). At this pre-baseline visit, blood was drawn for laboratory studies at the Clinical Translational Science Center at Massachusetts General Hospital after an overnight fast (at least 8 hours), and a nutritional evaluation was performed, including height and weight measurements. Height was measured as the average of 3 readings on a single stadiometer, and each subject, wearing a hospital gown, was weighed on an electronic scale. The subjects then presented approximately 10 days later, having fasted for at least 8 hours before, and were admitted to the Center for Clinical Investigation at Brigham and Women’s Hospital for a 10-day fast, during which time their only oral intake consisted of water ad libitum, a daily multivitamin, 20 mEq potassium chloride daily to prevent hypokalemia, and 200 mg allopurinol daily (23, 24). Of the 11 subjects who started the fast, 9 completed the study. Dual-energy x-ray absorptiometry (DXA) and MRI scans were performed at baseline and on the final day of the fast (day 10) to assess body composition, and integrated whole-body 18FFDG PET/MRI was performed at baseline and on day 10 to evaluate for BAT in a subset of the study subjects (n = 7 completers). Resting energy expenditure was measured using indirect calorimetry with the Vmax Encore 29 Metabolic Cart (CareFusion) at baseline and on day 10. Blood was drawn for laboratory studies at the pre-baseline visit, at baseline (day 0), on days 1, 3, 5, 7, and 9, and on the final day of the fast (day 10). Blood at the pre-baseline and baseline visits was drawn in the morning or early afternoon, and blood was drawn in the morning on days 1 through 10. Subjects were weighed on an electronic scale on admission and on days 1 through 10. A subset of subjects (n = 7 completers) also underwent serial s.c. fat tissue biopsy. Samples were collected from alternating sites of the periumbilical region at baseline and on days 1 and 10, using a 14-gauge Temno biopsy needle (CareFusion). At the conclusion of the fast, the subjects were monitored overnight as they resumed oral intake and were discharged the day after concluding the fast.
Body composition
DXA.
All subjects underwent DXA to measure body composition, including fat mass (kg) and percentage of body fat, using a Hologic Discovery A densitometer (Hologic Inc.). Coefficients of variation of DXA have been reported as less than 2.7% for fat mass (46).
MRI.
A single-axial MRI slice through the abdomen at the L4 level was obtained (Siemens Trio 3T; Siemens Healthcare) to determine abdominal s.c. adipose tissue and visceral adipose tissue areas.
BAT assessment
Subjects were studied wearing a standard hospital gown. Two hours before PET/MRI scans, the subjects were fitted with a cooling vest (Cool Flow System; Polar Products), which was cooled to 17°C. After 1 hour of cooling, the subjects were given an i.v. injection of 5 mCi (185 MBq) FDG. After the injection, the subjects remained under the same cooling conditions. One hour after injection, simultaneous integrated whole-body FDG-PET/MRI was performed using the Biograph mMR 3T scanner (Siemens Healthcare). PET-compatible phased-array coils (6-channel) covering the whole body were used to acquire the MRI data. A 2-point Dixon 3D VIBE breath-hold T1-weighted sequence (repetition time [TR] = 3.6 ms, echo time 1 [TE1] = 1.225 ms, TE2 = 2.45 ms, matrix size = 79 × 192, number of excitations (NEX) = 1, field of view [FOV] = 500 mm, slice thickness = 5.5 mm) was used to derive the attenuation correction map. Coronal whole-body T1-weighted turbo spin-echo sequences were obtained (TR = 616 ms, TE = 9.5 ms, matrix = 186 × 384, NEX = 1, FOV = 450 mm, slice thickness = 6.5 mm) to provide the anatomic correlation of FDG uptake.
PET images were reconstructed using a 3D attenuation-weighted ordered subsets expectation maximization (OSEM) algorithm, with 3 iterations and 21 subsets (zoom = 1), and Gaussian smoothing of 4 mm full-width half-maximum (FWHM) was applied after reconstruction. Image analysis was performed using OsiriX Imaging Software, version 3.2.1 (www.osirix-viewer.com/index.html), with fusion software embedded to merge whole-body FDG-PET images with MRI images. A board-certified radiologist assessed FDG uptake along the neck and supraclavicular regions. Semiquantitative analyses of FDG uptake were performed by creating a region of interest (ROI) to determine standardized uptake values (SUVs). SUVs were calculated and normalized for BW using the following formula: SUV = Ctis/Dinj/BW. Ctis is tissue concentration expressed as megabecquerels per milliliter, Dinj is injected dose expressed in megabecquerels, and BW is BW expressed as kilograms. SUVs of greater than 2.5 in a region of fat signal intensity on the MRI were considered BAT.
Mouse studies
Ten-week-old male C57BL/6 mice were purchased from Charles River Laboratories and housed at 22°C ± 2°C, with a 12-hour light (0700–1900 hours)/12-hour dark (1900–0700 hours) cycle and free access to food and water. Mice were fed a diet containing 23% protein, 21% fat, and 55% carbohydrates (PicoLab Mouse Diet 20; LabDiet). Fasting was initiated at 0800 hours, and mice continued to have free access to water. Serum and tissues were collected at the time of sacrifice.
qPCR
Human fat specimens were immediately placed in RNAlater (Life Technologies) and stored at –80°C. RNA was isolated using QIAzol Lysis Reagent (QIAGEN) and an miRNeasy Micro Kit (QIAGEN). cDNA was synthesized using the QuantiTect Reverse Transcription Kit (QIAGEN). Mouse tissues were harvested, homogenized in TRIzol (Life Technologies), and RNA extracted according to the manufacturer’s protocol. cDNA was synthesized using the High-Capacity cDNA Reverse Transcription Kit (Life Technologies). qPCR was performed using either iTaq Universal SYBR Green Supermix (Bio-Rad) and normalized to 18S or TaqMan Universal Master Mix II (Life Technologies) normalized to β-actin on an iCycler (Bio-Rad) instrument. The ΔΔCt method was used to calculate the fold change in transcript levels. Primers used in the qPCR reactions are listed in Supplemental Table 2.
Biochemical assessment
FGF21 levels in serum samples were measured by ELISA (R&D Systems) in both humans and mice, with a sensitivity of 8.69 pg/ml in humans and an intra-assay coefficient of variation (CV) of 2.9%–3.9% and an interassay CV of 5.2%–10.9%. In mice, the sensitivity was 13.4 pg/ml, with an intra-assay CV of 2.4%–6.2% and an interassay CV of 6%–7.4%. Serum intact FGF21 levels were measured by ELISA (Eagle Biosciences), with an intra-assay CV of 4.2%–5.7% and an interassay CV of 1.9%–6.9%. Insulin levels in serum were measured by ELISA (EMD Millipore) in both humans and mice, with an intra-assay CV of 4.6%–7% and interassay CV of 9.1%–11.4% in humans and an intra-assay CV of 0.9%–8.4% and interassay CV of 6%–17.9% in mice. NEFA were measured using an in vitro enzymatic colorimetric assay (Wako Chemicals USA), with a sensitivity of 0.0014 mEq/l, an intra-assay CV of 0.61%–0.75%, and an interassay CV of 0.75%–4.91%. β-Hydroxybutyrate (ketone body) levels were also measured using a colorimetric assay (Cayman Chemical), with an intra-assay CV of 4.05% and an interassay CV of 3.18%. Serum total adiponectin levels were measured by ELISA (R&D Systems), with an intra-assay CV of 2.5%–4.7% and an interassay CV of 5.8%–6.9%. Glucagon was measured using a chemiluminescent ELISA (EMD Millipore), with an intra-assay CV of less than 5% and an interassay CV of less than 10%. Glutamine was measured using a colorimetric assay kit with a sensitivity of 25 μM (Abcam). Branched-chain amino acids were measured using a biochemical assay with a detection limit of approximately 0.2 nmol (Abcam). T3 was measured by ELISA (Calbiotech). Blood glucose levels, AST, and ALT were measured by standard methods (47).
Statistics
Statistical analyses were performed using JMP, version 10.0 (SAS Institute), R (The R Foundation), and GraphPad Prism 6 (GraphPad Software) software. A 2-sided paired t test was performed to compare FGF21 levels between the pre-baseline visit and day 0 and to compare FGF21 levels between day 0 and day 10 as well as adiponectin levels between day 0 and day 10. The Wilcoxon signed-rank test was used to compare intact FGF21 levels and T3 levels at baseline and on day 10, since baseline levels were non-normally distributed. A 2-sided paired t test was used to compare baseline FGF21 levels with FGF21 levels at the point at which ketone levels increased by at least 10-fold in the human subjects.
Longitudinal analysis of the time series data was performed using mixed-effects models in R. The outcome — FGF21 — was log transformed to improve the normality of the outcome and the model residuals. Predictors of interest were included as fixed effects, and a random effect was fit for each subject using restricted maximum likelihood estimation. To account for the correlation of within-subjects data over time, a first-order autocorrelation function grouped by subject was fit to the error terms. Inclusion and exclusion of random effects and covariance structures were assessed by the effects on likelihood ratios, collinearity, normality of model residuals, and autocorrelation. A 2-sided P value of less than 0.05 was considered significant.
Study approval
The human study protocol was approved by the Partners HealthCare Institutional Review Board (Boston, Massachusetts, USA) and complied with the guidelines of the Health Insurance Portability and Accountability Act. Written informed consent was obtained from all subjects. The animal studies were approved by the Harvard Medical Area Standing Committee on Animals (Boston, Massachusetts, USA).
Author contributions
PKF, AK, PP, and MLS contributed to the study design. PKF, SMK, MAB, SW, CC, AK, and MLS conducted the human experiments. ML, SMK, YZ, and MLS conducted the animal experiments. PKF, ML, SMK, MAB, SW, YZ, CC, and MLS participated in acquisition of the data. PKF, HL, PP, and MLS performed data analysis. PKF, PP, and MLS contributed to writing of the manuscript. All authors critically reviewed and approved the manuscript.
Supplementary Material
Acknowledgments
We thank the nurses and bionutritionists at the Clinical Research Centers of Brigham and Women’s Hospital and Massachusetts General Hospital. This work was funded by grants from the National Institute of Diabetes and Digestive and Kidney Diseases (NIDDK), NIH (K23DK094820, to P.K. Fazeli and K08DK090147, to M.L. Steinhauser); a Claflin Distinguished Scholar Award (to P.K. Fazeli); a Watkins Cardiovascular Leadership Award (to M.L. Steinhauser); the National Institute for Biomedical Imaging and Bioengineering (5P41EB015896-17); the Harvard Clinical and Translational Science Center, National Center for Advancing Translational Science (8UL1 TR000170-05); and the Harvard Clinical and Translational Science Center, National Center for Research Resources (1UL1TR001102-01 and 1UL1RR025758-04). The content is solely the responsibility of the authors and does not necessarily represent the official views of the NIH.
Footnotes
Conflict of interest: The authors have declared that no conflict of interest exists.
Reference information:J Clin Invest. 2015;125(12):4601–4611. doi:10.1172/JCI83349.
References
- 1.Inagaki T, et al. Endocrine regulation of the fasting response by PPARα-mediated induction of fibroblast growth factor 21. Cell Metab. 2007;5(6):415–425. doi: 10.1016/j.cmet.2007.05.003. [DOI] [PubMed] [Google Scholar]
- 2.Badman MK, Pissios P, Kennedy AR, Koukos G, Flier JS, Maratos-Flier E. Hepatic fibroblast growth factor 21 is regulated by PPARα and is a key mediator of hepatic lipid metabolism in ketotic states. Cell Metab. 2007;5(6):426–437. doi: 10.1016/j.cmet.2007.05.002. [DOI] [PubMed] [Google Scholar]
- 3.Potthoff MJ, et al. FGF21 induces PGC-1α and regulates carbohydrate and fatty acid metabolism during the adaptive starvation response. Proc Natl Acad Sci U S A. 2009;106(26):10853–10858. doi: 10.1073/pnas.0904187106. [DOI] [PMC free article] [PubMed] [Google Scholar]
- 4.Fisher FM, et al. Integrated regulation of hepatic metabolism by fibroblast growth factor 21 (FGF21) in vivo. Endocrinology. 2011;152(8):2996–3004. doi: 10.1210/en.2011-0281. [DOI] [PMC free article] [PubMed] [Google Scholar]
- 5.Liang Q, et al. FGF21 maintains glucose homeostasis by mediating the cross talk between liver and brain during prolonged fasting. Diabetes. 2014;63(12):4064–4075. doi: 10.2337/db14-0541. [DOI] [PubMed] [Google Scholar]
- 6.Inagaki T, Lin VY, Goetz R, Mohammadi M, Mangelsdorf DJ, Kliewer SA. Inhibition of growth hormone signaling by the fasting-induced hormone FGF21. Cell Metab. 2008;8(1):77–83. doi: 10.1016/j.cmet.2008.05.006. [DOI] [PMC free article] [PubMed] [Google Scholar]
- 7.Owen BM, et al. FGF21 contributes to neuroendocrine control of female reproduction. Nat Med. 2013;19(9):1153–1156. doi: 10.1038/nm.3250. [DOI] [PMC free article] [PubMed] [Google Scholar]
- 8.Kharitonenkov A, et al. FGF-21 as a novel metabolic regulator. J Clin Invest. 2005;115(6):1627–1635. doi: 10.1172/JCI23606. [DOI] [PMC free article] [PubMed] [Google Scholar]
- 9.Hondares E, Rosell M, Gonzalez FJ, Giralt M, Iglesias R, Villarroya F. Hepatic FGF21 expression is induced at birth via PPARα in response to milk intake and contributes to thermogenic activation of neonatal brown fat. Cell Metab. 2010;11(3):206–212. doi: 10.1016/j.cmet.2010.02.001. [DOI] [PMC free article] [PubMed] [Google Scholar]
- 10.Fisher FM, et al. FGF21 regulates PGC-1α and browning of white adipose tissues in adaptive thermogenesis. Genes Dev. 2012;26(3):271–281. doi: 10.1101/gad.177857.111. [DOI] [PMC free article] [PubMed] [Google Scholar]
- 11.Lee P, Werner CD, Kebebew E, Celi FS. Functional thermogenic beige adipogenesis is inducible in human neck fat. Int J Obes (Lond) 2014;38(2):170–176. doi: 10.1038/ijo.2013.82. [DOI] [PMC free article] [PubMed] [Google Scholar]
- 12.Fu T, et al. MicroRNA 34a inhibits beige and brown fat formation in obesity in part by suppressing adipocyte fibroblast growth factor 21 signaling and SIRT1 function. Mol Cell Biol. 2014;34(22):4130–4142. doi: 10.1128/MCB.00596-14. [DOI] [PMC free article] [PubMed] [Google Scholar]
- 13.Lee P, et al. Irisin and FGF21 are cold-induced endocrine activators of brown fat function in humans. Cell Metab. 2014;19(2):302–309. doi: 10.1016/j.cmet.2013.12.017. [DOI] [PMC free article] [PubMed] [Google Scholar]
- 14.Emanuelli B, et al. Interplay between FGF21 and insulin action in the liver regulates metabolism. J Clin Invest. 2014;124(2):515–527. doi: 10.1172/JCI67353. [DOI] [PMC free article] [PubMed] [Google Scholar]
- 15.Gaich G, et al. The effects of LY2405319, an FGF21 analog, in obese human subjects with type 2 diabetes. Cell Metab. 2013;18(3):333–340. doi: 10.1016/j.cmet.2013.08.005. [DOI] [PubMed] [Google Scholar]
- 16.Foltz IN, et al. Treating diabetes and obesity with an FGF21-mimetic antibody activating the βKlotho/FGFR1c receptor complex. Sci Transl Med. 2012;4(162): doi: 10.1126/scitranslmed.3004690. [DOI] [PubMed] [Google Scholar]
- 17.Galman C, et al. The circulating metabolic regulator FGF21 is induced by prolonged fasting and PPARα activation in man. Cell Metab. 2008;8(2):169–174. doi: 10.1016/j.cmet.2008.06.014. [DOI] [PubMed] [Google Scholar]
- 18.Christodoulides C, Dyson P, Sprecher D, Tsintzas K, Karpe F. Circulating fibroblast growth factor 21 is induced by peroxisome proliferator-activated receptor agonists but not ketosis in man. J Clin Endocrinol Metab. 2009;94(9):3594–3601. doi: 10.1210/jc.2009-0111. [DOI] [PubMed] [Google Scholar]
- 19.Dushay J, et al. Increased fibroblast growth factor 21 in obesity and nonalcoholic fatty liver disease. Gastroenterology. 2010;139(2):456–463. doi: 10.1053/j.gastro.2010.04.054. [DOI] [PMC free article] [PubMed] [Google Scholar]
- 20.Andersen B, Beck-Nielsen H, Hojlund K. Plasma FGF21 displays a circadian rhythm during a 72-h fast in healthy female volunteers. Clin Endocrinol (Oxf) 2011;75(4):514–519. doi: 10.1111/j.1365-2265.2011.04084.x. [DOI] [PubMed] [Google Scholar]
- 21.Dostalova I, et al. Plasma concentrations of fibroblast growth factors 19 and 21 in patients with anorexia nervosa. J Clin Endocrinol Metab. 2008;93(9):3627–3632. doi: 10.1210/jc.2008-0746. [DOI] [PubMed] [Google Scholar]
- 22.Fazeli PK, et al. Serum FGF-21 levels are associated with worsened radial trabecular bone microarchitecture and decreased radial bone strength in women with anorexia nervosa. Bone. 2015;77:6–11. doi: 10.1016/j.bone.2015.04.001. [DOI] [PMC free article] [PubMed] [Google Scholar]
- 23.Beitins IZ, et al. Hormonal responses to short term fasting in postmenopausal women. J Clin Endocrinol Metab. 1985;60(6):1120–1126. doi: 10.1210/jcem-60-6-1120. [DOI] [PubMed] [Google Scholar]
- 24.Grinspoon SK, Baum HB, Peterson S, Klibanski A. Effects of rhIGF-I administration on bone turnover during short-term fasting. J Clin Invest. 1995;96(2):900–906. doi: 10.1172/JCI118137. [DOI] [PMC free article] [PubMed] [Google Scholar]
- 25.Zhang X, et al. Serum FGF21 levels are increased in obesity and are independently associated with the metabolic syndrome in humans. Diabetes. 2008;57(5):1246–1253. doi: 10.2337/db07-1476. [DOI] [PubMed] [Google Scholar]
- 26.Holland WL, et al. An FGF21-adiponectin-ceramide axis controls energy expenditure and insulin action in mice. Cell Metab. 2013;17(5):790–797. doi: 10.1016/j.cmet.2013.03.019. [DOI] [PMC free article] [PubMed] [Google Scholar]
- 27.Adams AC, et al. The breadth of FGF21’s metabolic actions are governed by FGFR1 in adipose tissue. Mol Metab. 2012;2(1):31–37. doi: 10.1016/j.molmet.2012.08.007. [DOI] [PMC free article] [PubMed] [Google Scholar]
- 28.Merl V, et al. Serum adiponectin concentrations during a 72-hour fast in over- and normal-weight humans. Int J Obes (Lond) 2005;29(8):998–1001. doi: 10.1038/sj.ijo.0802971. [DOI] [PubMed] [Google Scholar]
- 29.Arita Y, et al. Paradoxical decrease of an adipose-specific protein, adiponectin, in obesity. Biochem Biophys Res Commun. 1999;257(1):79–83. doi: 10.1006/bbrc.1999.0255. [DOI] [PubMed] [Google Scholar]
- 30.Portnay GI, et al. The effect of starvation on the concentration and binding of thyroxine and triiodothyronine in serum and on the response to TRH. J Clin Endocrinol Metab. 1974;39(1):191–194. doi: 10.1210/jcem-39-1-191. [DOI] [PubMed] [Google Scholar]
- 31.Domouzoglou EM, et al. Fibroblast growth factor 21 and thyroid hormone show mutual regulatory dependency but have independent actions in vivo. Endocrinology. 2014;155(5):2031–2040. doi: 10.1210/en.2013-1902. [DOI] [PMC free article] [PubMed] [Google Scholar]
- 32.Zhang A, et al. Thyroid hormone receptor regulates most genes independently of fibroblast growth factor 21 in liver. J Endocrinol. 2015;224(3):289–301. doi: 10.1530/JOE-14-0440. [DOI] [PubMed] [Google Scholar]
- 33.Hotta Y, et al. Fibroblast growth factor 21 regulates lipolysis in white adipose tissue but is not required for ketogenesis and triglyceride clearance in liver. Endocrinology. 2009;150(10):4625–4633. doi: 10.1210/en.2009-0119. [DOI] [PubMed] [Google Scholar]
- 34.Patel R, et al. Glucocorticoids regulate the metabolic hormone FGF21 in a feed-forward loop. Mol Endocrinol. 2015;29(2):213–223. doi: 10.1210/me.2014-1259. [DOI] [PMC free article] [PubMed] [Google Scholar]
- 35.Felig P, Owen OE, Wahren J, Cahill GF., Jr Amino acid metabolism during prolonged starvation. J Clin Invest. 1969;48(3):584–594. doi: 10.1172/JCI106017. [DOI] [PMC free article] [PubMed] [Google Scholar]
- 36.Markan KR, et al. Circulating FGF21 is liver derived and enhances glucose uptake during refeeding and overfeeding. Diabetes. 2014;63(12):4057–4063. doi: 10.2337/db14-0595. [DOI] [PMC free article] [PubMed] [Google Scholar]
- 37.Cahill GF., Jr Fuel metabolism in starvation. Annu Rev Nutr. 2006;26:1–22. doi: 10.1146/annurev.nutr.26.061505.111258. [DOI] [PubMed] [Google Scholar]
- 38.Adelman R, Saul RL, Ames BN. Oxidative damage to DNA: relation to species metabolic rate and life span. Proc Natl Acad Sci U S A. 1988;85(8):2706–2708. doi: 10.1073/pnas.85.8.2706. [DOI] [PMC free article] [PubMed] [Google Scholar]
- 39.Consolazio CF, Nelson RA, Johnson HL, Matoush LO, Krzywicki HJ, Isaac GJ. Metabolic aspects of acute starvation in normal humans: performance and cardiovascular evaluation. Am J Clin Nutr. 1967;20(7):684–693. doi: 10.1093/ajcn/20.7.684. [DOI] [PubMed] [Google Scholar]
- 40.Cahill GF., Jr Starvation in man. Clin Endocrinol Metab. 1976;5(2):397–415. doi: 10.1016/S0300-595X(76)80028-X. [DOI] [PubMed] [Google Scholar]
- 41.Abraira C, Virupannavar C, Nemchausky B. Protective effect of small amounts of glucose on abnormal liver function tests during starvation. Metabolism. 1980;29(10):943–948. doi: 10.1016/0026-0495(80)90037-2. [DOI] [PubMed] [Google Scholar]
- 42.Mashili FL, et al. Direct effects of FGF21 on glucose uptake in human skeletal muscle: implications for type 2 diabetes and obesity. Diabetes Metab Res Rev. 2011;27(3):286–297. doi: 10.1002/dmrr.1177. [DOI] [PubMed] [Google Scholar]
- 43.Xu J, et al. Acute glucose-lowering and insulin-sensitizing action of FGF21 in insulin-resistant mouse models — association with liver and adipose tissue effects. Am J Physiol Endocrinol Metab. 2009;297(5):E1105–E1114. doi: 10.1152/ajpendo.00348.2009. [DOI] [PubMed] [Google Scholar]
- 44.Dushay JR, Toschi E, Mitten EK, Fisher FM, Herman MA, Maratos-Flier E. Fructose ingestion acutely stimulates circulating FGF21 levels in humans. Mol Metabol. 2015;4(1):51–57. doi: 10.1016/j.molmet.2014.09.008. [DOI] [PMC free article] [PubMed] [Google Scholar]
- 45.Laeger T, et al. FGF21 is an endocrine signal of protein restriction. J Clin Invest. 2014;124(9):3913–3922. doi: 10.1172/JCI74915. [DOI] [PMC free article] [PubMed] [Google Scholar]
- 46.Johnson J, Dawson-Hughes B. Precision and stability of dual-energy X-ray absorptiometry measurements. Calcif Tissue Int. 1991;49(3):174–178. doi: 10.1007/BF02556113. [DOI] [PubMed] [Google Scholar]
- 47.Kratz A, Ferraro M, Sluss PM, Lewandrowski KB. Case records of the Massachusetts General Hospital. Weekly clinicopathological exercises. Laboratory reference values. N Engl J Med. 2004;351(15):1548–1563. doi: 10.1056/NEJMcpc049016. [DOI] [PubMed] [Google Scholar]
Associated Data
This section collects any data citations, data availability statements, or supplementary materials included in this article.