

The Prostate Imaging Reporting and Data System (PI-RADS) is an important standardization tool for reporting multiparametric MR imaging results; in this study the authors show that, like the first version of PIRADS, the second version is only moderately reproducible.
Abstract
Purpose
To evaluate accuracy and interobserver variability with the use of the Prostate Imaging Reporting and Data System (PI-RADS) version 2.0 for detection of prostate cancer at multiparametric magnetic resonance (MR) imaging in a biopsy-naïve patient population.
Materials and Methods
This retrospective HIPAA-compliant study was approved by the local ethics committee, and written informed consent was obtained from all patients for use of their imaging and histopathologic data in future research studies. In 101 biopsy-naïve patients with elevated prostate-specific antigen levels who underwent multiparametric MR imaging of the prostate and subsequent transrectal ultrasonography (US)–MR imaging fusion–guided biopsy, suspicious lesions detected at multiparametric MR imaging were scored by five readers who were blinded to pathologic results by using to the newly revised PI-RADS and the scoring system developed in-house. Interobserver agreement was evaluated by using κ statistics, and the correlation of pathologic results with each of the two scoring systems was evaluated by using the Kendall τ correlation coefficient.
Results
Specimens of 162 lesions in 94 patients were sampled by means of transrectal US–MR imaging fusion biopsy. Results for 87 (54%) lesions were positive for prostate cancer. Kendall τ values with the PI-RADS and the in-house–developed scoring system, respectively, at T2-weighted MR imaging in the peripheral zone were 0.51 and 0.17 and in the transitional zone, 0.45 and −0.11; at diffusion-weighted MR imaging, 0.42 and 0.28; at dynamic contrast material–enhanced MR imaging, 0.23 and 0.24, and overall suspicion scores were 0.42 and 0.49. Median κ scores among all possible pairs of readers for PI-RADS and the in-house–developed scoring system, respectively, for T2-weighted MR images in the peripheral zone were 0.47 and 0.15; transitional zone, 0.37 and 0.07; diffusion-weighted MR imaging, 0.41 and 0.57; dynamic contrast-enhanced MR imaging, 0.48 and 0.41; and overall suspicion scores, 0.46 and 0.55.
Conclusion
Use of the revised PI-RADS provides moderately reproducible MR imaging scores for detection of clinically relevant disease.
© RSNA, 2015
Introduction
To bring uniformity and standardization to reporting of multiparametric magnetic resonance (MR) imaging of the prostate, the European Society of Urogenital Radiology published a unified Prostate Imaging Reporting and Data System (PI-RADS) in 2012 (1). Several research groups have validated the original PI-RADS, mostly by using a PI-RADS sum score (on a scale of 3–15) for summation of the single scores for the three different pulse sequences (T2-weighted imaging, diffusion-weighted imaging [DWI], and dynamic contrast material–enhanced [DCE] MR imaging).However, several developments prompted reconsideration of the original PI-RADS. For instance, there was consensus that a single score system (on a scale of 1–5), similar to that used with the Breast Imaging Reporting and Data System, would improve communication among clinicians of different disciplines (2). Moreover, new data suggested that different weightings should be used depending on the location of the lesion in the peripheral zone (PZ) or transitional zone (TZ). For instance, Baur et al (3) reported that assigning a PI-RADS score on the basis of DWI for PZ lesions and a PI-RADS score on the basis of T2-weighted imaging for TZ lesions was sufficient for stratification of patients for further diagnostic workup. Furthermore, the contribution of DCE MR imaging curve-type analysis was reported to be of questionable value (3,4).
For these reasons, the European Society of Urogenital Radiology prostate MR imaging expert group and the PIRADS steering committee of the American College of Radiology have developed PI-RADS, version 2.0 (5). This version includes the following changes: (a) The concept of a dominant sequence depending on the location of the lesion was introduced. For example, in the PZ, the dominant sequence is DWI; in the TZ, the dominant sequence is T2-weighted imaging. (b) The consensus group reported that DCE imaging results should be scored as positive when there is early focal enhancement and as negative when there is no early focal enhancement or diffuse enhancement, instead of using curve-type analysis as described in the original version of PI-RADS. (c) For positive DCE imaging results, the overall PI-RADS suspicion score should be increased by one point, but only if it makes a clinically relevant difference (ie, when the PI-RADS score will increase from 3 to 4). (d) Finally, an overall score on a scale of 1–5 is assigned according to the revised rules in the second version of PI-RADS. The suggested modifications to PI-RADS also were proposed by Bomers et al (6) and Baur et al (3). Critical to the success of PI-RADS is the ability to show consistency in scores among readers, which, after all, is the primary goal of the guideline. The goal of this study was to evaluate both the accuracy and interobserver variability with the use of the PI-RADS, version 2.0, for detection of prostate cancer at multiparametric MR imaging in a biopsy-naïve patient population.
Materials and Methods
Study Design and Patient Population
This Health Insurance Portability and Accountability Act-compliant retrospective study was approved by the local ethics committee, and written informed consent was obtained from all patients for use of their imaging and histopathologic data in future research studies. Between December 2011 and May 2014, 101 consecutive biopsy-naïve patients (mean age, 62 years ± 9.50), with increased prostate-specific antigen levels (> 4 ng/mL [> 4 μg/L]) or abnormal results from a digital rectal examination underwent multiparametric MR imaging. All patients subsequently underwent transrectal ultrasonography (US)–MR imaging fusion–guided biopsy of lesions suspected to be cancer that were identified at multiparametric MR imaging performed within 6 weeks after MR imaging. Inclusion criteria were having never undergone a biopsy and having undergone a multiparametric MR imaging examination and a subsequent transrectal US–MR imaging fusion–guided biopsy. The exclusion criterion was having undergone a nondiagnostic multiparametric MR imaging examination. The flowchart of the patient selection process is presented in Figure 1.
Figure 1:

Flowchart for selection of the patient population in the current study. mpMRI = multiparametric MR imaging, TRUS = transrectal US.
MR Imaging Protocol
All MR imaging studies were performed by using a combination of an endorectal coil (BPX-30; Medrad, Pittsburgh, Pa) tuned to 127.8 MHz and a 16-channel cardiac coil (SENSE; Philips Medical Systems, Best, the Netherlands) with a 3-T MR imager (Achieva; Philips Medical Systems), without prior bowel preparation. The endorectal coil was inserted with a semianesthetic gel (xylocaine, Lidocaine; Astra Zeneca, Wilmington, Del) while the patient was in the left lateral decubitus position. The balloon surrounding the coil was distended with 3 mol/L of perfluorocarbon (Fluorinert; 3M, St Paul, Minn) to a volume of approximately 45 mL. MR imaging parameters included T1-weighted imaging, triplanar (coronal, sagittal, and axial) T2-weighted imaging, diffusion weighted imaging with a b value of 2000 sec/mm2, apparent diffusion coefficient (ADC) mapping derived from a separate DWI MR imaging examination performed by applying five evenly spaced b values ranging from 0 to 750 sec/mm2, and axial three-dimensional fast field-echo DCE imaging sequences. Axial DCE images were obtained before, during, and after a single dose of gadopentetate dimeglumine (Magnevist; Berlex, Wayne, NJ) administered at a dose of 0.1 mmol/kg of body weight through a peripheral vein at a rate 3 mL/sec by using a mechanical injector (Spectris MR injection System; Medrad, Pittsburgh, Pa). Each three-dimensional sequence was performed in 5.6 seconds. MR imaging pulse sequence parameters were defined in previous studies (7,8) (Table 1).
Table 1.
Multiparametric MR Imaging Sequence Parameters at 3 T
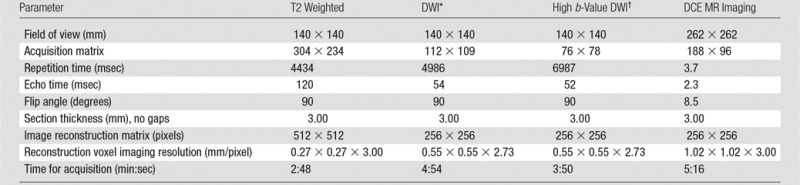
*For ADC map calculation. Five evenly-spaced b values (0–750 sec/mm2) were used.
†b = 2000 sec/mm2
MR Imaging–Transrectal US Fusion–guided Biopsy
In a single session, patients with any lesions suspicious for prostate cancer at multiparametric MR imaging underwent a standard 12-core transrectal US–guided extended sextant biopsy independent of the multiparametric MR imaging results and fusion biopsy of multiparametric MR imaging target lesions performed by the same operator by using an office-based fusion platform (UroNav; InVivo Corp, Gainesville, Fla) (9). Prebiopsy T2-weighted MR images were segmented, registered, and fused with the real-time transrectal US images. Lesions suspicious for prostate cancer were displayed as targets and were sampled in the axial and the sagittal plane, resulting in two cores per target (10). Needle trajectories were mapped with real-time electromagnetic tracking in the biopsy platform (Northern Digital, Ontario, Canada). Results of previous validation studies have indicated an accuracy of within 3 mm for this platform (11).
Histopathologic Evaluation
All biopsy cores were immediately fixed in formalin and stained with hematoxylin and eosin, and a routine histopathologic evaluation was performed. Higher grade prostate cancer was defined as lesions showing a primary Gleason score pattern of 4 or higher. Pathologic specimens were reviewed by a single genitourinary pathologist (M.J.M., with more than 25 years of experience).
MR Image Interpretation
In each patient, images of the lesions most suspicious for cancer (up to two) at multiparametric MR imaging were presented to five independent readers with varying levels of experience in multiparametric MR imaging of the prostate (reader 1, P.L.C., with 12 years of experience [approximately 4000 examinations]; reader 2, B.T., with 7 years of experience [approximately 3500 examinations]; reader 3, J.M., with 1 year of experience [approximately 500 examinations]; reader 4, S.S., with 1 year of experience [approximately 500 examinations]; reader 5, B.G.M., with 6 months of experience [approximately 250 examinations]). These five readers, all of whom were blinded to initial multiparametric MR imaging reports and resultant clinical-pathologic outcomes, scored the examinations. In each session, the lesions and four different pulse sequences (axial T2-weighted, ADC mapping with DWI, DWI performed with a b value of 2000 sec/mm2, and DCE imaging) were shown to the readers, who independently scored the lesions according to the revised PI-RADS and the scoring system developed in-house and displayed on a commercially available workstation (DynaCAD software; Invivo, Orlando, Fla).
PI-RADS Scoring
According to the European Society of Urogenital Radiology guidelines, T2-weighted and DWI examinations were scored on a scale of 1–5 by using the PI-RADS system. For DCE images, a binary scale was used (0 = no focal early enhancement; 1 = presence of early focal enhancement). In addition, the overall score consisted of the score for the dominant sequence (T2-weighted for TZ lesions and DWI for PZ lesions) plus one point added to the overall score for DCE imaging results that were positive for cancer, but only if the addition of the one point converted the PI-RADS score from 3 to 4. (Table 2).
Table 2.
The Revised PI-RADS
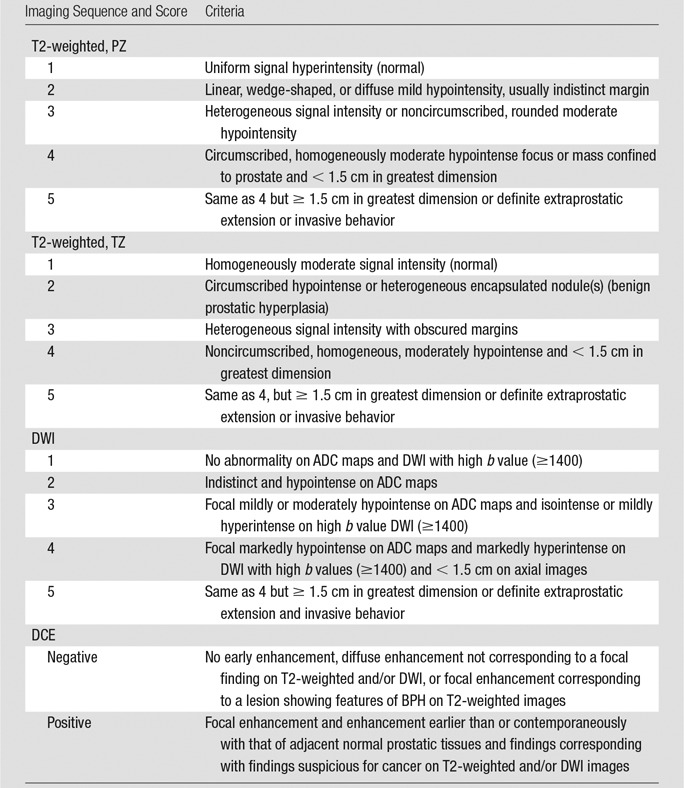
Note.—T2-weighted imaging and DWI were scored according to a five-point suspicion scale. DCE imaging results were scored as either negative or positive. The overall suspicion score consisted of the suspicion score for the dominant sequence (T2-weighted for TZ lesions and DWI for PZ lesions) and can be upgraded by one point with positive DCE imaging results when it increases the overall score substantially (ie, 3 to 4).
Scoring System Developed In-House
The lesions also were scored by using a previously validated in-house–developed multiparametric MR imaging scoring system (12–14). The number of positive pulse sequences at multiparametric MR imaging for each lesion allowed determination of the final suspicion score as low, moderate, or high suspicion for prostate cancer (Table 3).In this scoring system, images from the three sequences (T2 weighted, ADC mapping with DWI, and DCE imaging) were rated as positive (score 0) or negative (score 1), and the final score was determined by using the matrix displayed in Table 3, from low and moderate likelihood to high likelihood in patients suspected of having of extracapsular extension. For analysis purposes, all lesions were subsequently grouped by location as either PZ or TZ lesions. Lesions with moderate or high suspicion for cancer were those that required biopsy, and lesions with low suspicion were those in which targeted biopsy was not required.
Table 3.
Evaluation of Multiparametric MR Imaging Sequences with In-House System
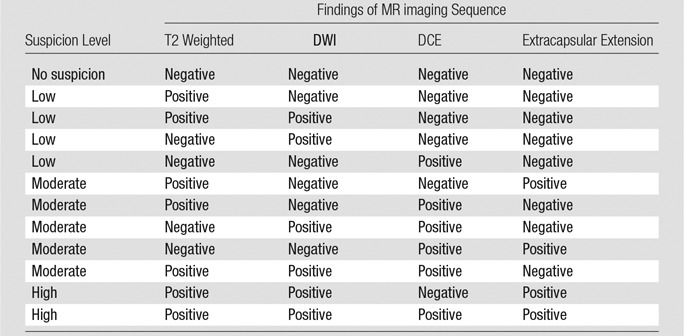
Note.—The presence of extracapsular extension was scored as either positive or negative. This matrix determines the overall likelihood for prostate cancer (no suspicion, low suspicion, moderate suspicion, high suspicion).
Statistical Analysis
Correlation among readers’ scores and pathologic results was estimated by using the Kendall τ, with scores of the five readers averaged. The Kendall τ is a rank correlation coefficient that allows measurement of the similarity of the ordering of two random variables (15). The values of the Kendall τ ranged from −1 to 1, with 1 corresponding to 100% positive correlation, −1 corresponding to 100% negative correlation, and 0 corresponding to independence. To account for within-patient correlation of multiple lesions, a within-cluster resampling technique was used to obtain the estimate and standard error of the Kendall τ (16,17). In each resampled data set consisting of one lesion randomly sampled with replacement from each patient, the Kendall τ and its standard error were calculated. The within-cluster resampling procedure was repeated 5000 times, each repeat generating a Kendall τ estimate and standard error. The final Kendall τ estimate was the average of these 5000 resampling-based estimates. The variance of the final Kendall τ estimate was the average of the resampling-based variances minus the variance of the resampling-based Kendall τ estimates. The Wald test was used to obtain the P value of the final Kendall τ estimate.
Generalized estimating equations with a logit link function and working independence correlation structure were used to estimate and compare the probability of cancer on the basis of reader scores for images from each imaging modality in different prostate zones. In each generalized estimating equation model, median reader score of the five readers and prostate zone were factors that allowed prediction, and pathologic scores were the response variable that was dichotomized in two ways: cancer versus no cancer and low-risk cancer and benign lesions (Gleason score ≤ 3+4) versus clinically relevant cancer (Gleason score ≥ 4+3). The Wald test with robust variance estimates was used for inference with the assumption of a working independence model. Predicted probability of cancer at each score level was calculated from the estimated model.
With a median reader score greater than 3 considered as positive and less than or equal to 3 as negative at multiparametric MR imaging, sensitivity and specificity were calculated. Sensitivity was defined as the proportion of lesions positive for cancer, and specificity was defined as the proportion of lesions negative for cancer at multiparametric MR imaging. The κ statistic was used to estimate pairwise and overall per-lesion interreader agreement. Because reader scores of multiple lesions from the same patient were likely correlated, conventional standard errors of κ estimates, which require independent observations, are not valid. The bootstrap resampling procedure (number of bootstrap samples, 1000) was used to calculate the standard errors of the κ estimates, where the bootstrap sampling unit was the number of patients.
To assess performance with combined T2-weighted, DWI, and DCE imaging for prediction of cancer, the sum of the median reader scores of these sequences was used in the receiver operating characteristic (ROC) analysis for PZ and TZ prostate lesions separately. Statistical analysis was performed by using software (R version 3.1.0; R Foundation for Statistical Computing, Vienna, Austria [18]). Function “kappam.fleiss” in the interrater reliability package (irr package, R version 3.1.0; R Foundation) was used to calculate the multirater κ statistics, and function “geese” in the generalized estimating equation package (geepack, R version 3.1.0; R Foundation) was used to formulate generalized estimating equation models and obtain the generalized estimating equation estimates.
Results
Lesion Characteristics
Seven patients were excluded from the analysis because of artifacts related to hip prosthesis. The final study population included 94 patients (Table 4). The total number of lesions sampled by means of transrectal US–MR imaging fusion–guided biopsy was 162. In 88 lesions (54%), biopsy results were positive for prostate cancer. Noncancerous lesions included 65 benign lesions and eight showing chronic inflammation (one prostatic intraepithelial neoplasia). The Gleason score distribution for cancerous lesions was as follows: 3+3 = 6 (n = 20), 3+4 = 7 (n = 34), 4+3 = 7 (n = 6), 4+4 = 8 (n = 17), 4+5 = 9 (n = 9), 5+4 = 9 (n = 1), and 5+5 = 10 (n = 1). Biopsy results revealed high-grade prostate cancer (Gleason score ≥ 4+3 = 7) in 33 (20%) lesions and lower grade prostate cancer (Gleason score ≤ 3+4 = 7) in 54 (33%) lesions.
Table 4.
Patient and Lesion Characteristics of the Study Population
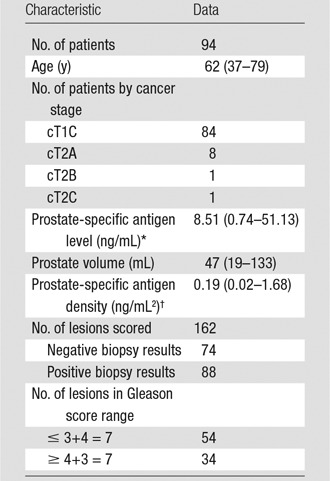
Note.–Data in parentheses are the range.
*To convert to Systéme International (SI) units (micrograms per liter), multiply by 1.
†To convert to SI units (micrograms per liter squared), multiply by 1.
Correlation of PI-RADS and In-House Scoring System with Pathologic Results
For each of the four multiparametric MR imaging sequences and the suspicion level, the correlation of pathologic results with PI-RADS and our in-house scoring system, respectively, was assessed by using the Kendall τ: T2-weighted imaging in the PZ (0.51, 0.17), T2-weighted imaging in the TZ (0.45, −0.11), DWI (0.42, 0.28), DCE MR imaging (0.23, 0.24), and suspicion (0.42, 0.49) (Table 5).
Table 5.
Kendall τ and P Values between Pathology Score and Mean In-House and PI-RADS Score
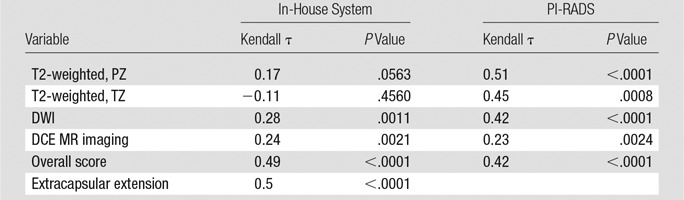
With the in-house scoring system, the correlation between reader score and pathologic scores was significant for DWI and DCE MR imaging (P < .05), but not significant for T2-weighted imaging. The correlation between the overall suspicion level and the pathologic score was significant (P < .0001). With the PI-RADS, the correlation between all scores and pathologic results was moderate and significant (P < .0001–.0024). These results are visually represented in Figure 2.
Figure 2:

Bar graph shows the Kendall τ for each scoring system. ADC = ADC mapping at DWI, T2W = T2-weighted imaging, * = significant value (P < .05).
PZ versus TZ Lesions
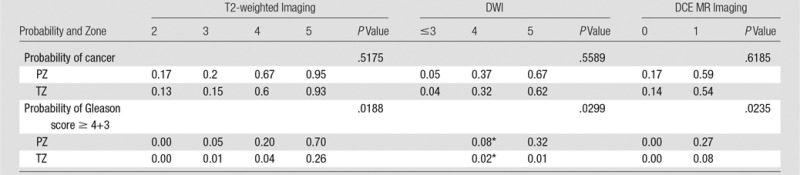
Median reader score of each modality, pathologic results score, and location in the prostate are shown in Tables E1 and E2 (online). Because few lesions had low DWI reader scores and high pathologic scores, lower DWI reader scores were grouped in the order in which the corresponding predicted probability of cancer was estimable with the use of a generalized estimating equation model. None of the interaction between median reader scores and location of prostate cancer was significant in each generalized estimating equation model. When the PI-RADS was used to help detect cancer, the predicted probability of cancer was not significantly different between lesions in the PZ and those in the TZ. In comparison, when the PI-RADS was used to detect high-risk prostate cancer (Gleason score ≥ 4+3), the probability of detecting clinically significant prostate cancer in the PZ was significantly higher than that in the TZ with all three modalities, as is demonstrated in Table 6. The predicted probability of cancer determined as T2-weighted imaging PI-RADS scores of 2, 3, 4, and 5, respectively, was 0.17, 0.2, 0.67, and 0.95 in the PZ, and 0.13, 0.15, 0.6, and 0.93 in the TZ. When a threshold was applied to the median reader score at 3 (ie, median reader score ≤ 3 vs > 3), sensitivity and specificity, respectively, were 88% (60 of 68) and 71% (40 of 56) for the PZ and 85% (17 of 20) and 55% (10 of 18) for the TZ. ROC analysis showed that a total score for T2-weighted, DWI, and DCE MR imaging results achieved an area under the ROC curve of 0.86 and 0.87 for the PZ and the TZ, respectively.
Table 6.
Probability of Cancer by Reader Score and Zone
*Data are for scores less than or equal to 4.
Interobserver Agreement
For the in-house scoring system, more than 80% (119–124 of 162) of the lesions received positive readings throughout all readers and imaging modalities (Tables E2 and E3 [online]). The suspicion level was rated 2 in approximately two-thirds of the lesions (104–112 of 162), and extracapsular extension was negative in the majority of the lesions (118–128 of 162). For the PI-RADS scoring system, the distribution of scores depended on the pulse sequence. For example, T2-weighted imaging showed more lesions rated as grades 2 or 3 than did DWI. For each scoring system in each of the four multiparametric MR imaging sequences and for suspicion level, interreader agreement was assessed by using κ statistics. Pairwise κ values and standard errors are shown in Table E4 (online). Overall multireader κ values are listed in Table 7. These results are visually represented in Figure 3.
Table 7.
Multireader κ Statistic and Standard Error for PI-RADS and In-House Scoring System
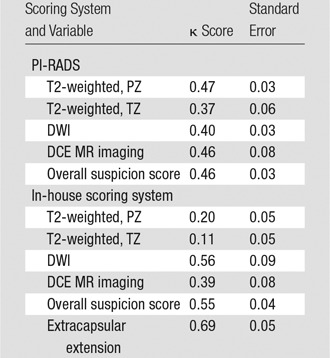
Figure 3:

Bar graph shows interobserver agreement between each sequence of the two scoring systems. The bars indicate interobserver agreement as mean κ score for each possible pair of readers. ADC = ADC mapping at DWI.
Discussion
The findings of our study revealed that the new version of PI-RADS (version 2.0) has a moderate level of interobserver agreement for readers of varying experience. Similar levels of interobserver agreement were reported for the original PI-RADS. Rosenkrantz et al (19) showed that the interobserver reproducibility for the original PI-RADS was moderate (concordance correlation coefficient, 0.47) in readers of varying experience, which is similar to the results of our study. In another study, Rosenkrantz et al (20) reported a mean κ of all possible combinations of three readers of 0.45. The authors of these studies applied a sector-based analysis and used radical prostatectomy as the reference standard. Schimmöller et al reported similar rates of interobserver agreement for the original PI-RADS (κ = 0.55 for T2-weighted, κ = 0.64 for DWI, and κ = 0.65 for DCE MR imaging) in three blinded readers of similar experience levels (21). Authors of the study applied a lesion-based analysis with in-bore MR imaging–guided biopsy as a reference standard.
The revised version of PI-RADS used for T2-weighted imaging revealed a positive relationship between the probability of cancer and PI-RADS score in the PZ (score of 2, 0.17; score of 3, 0.2; score of 4, 0.67; and score of 5, 0.95) and in the TZ (score of 2, 0.13; score of 3, 0.15; score of 4, 0.6; and score of 5, 0.93). A threshold median reader score of 3 revealed sensitivity and specificity values of 88% and 71%, respectively, in the PZ and of 85% and 55%, respectively in the TZ for cancer detection. Several studies in which authors evaluated the original PI-RADS from 2012 showed higher accuracy in the PZ than in the TZ (20,22). In our study, the results for the two zones were comparable. This might indicate better performance for detection of tumors in the TZ with the revised edition and generally increased awareness of anterior lesions in the TZ.
Authors of previous performance studies have relied on ROC curves. In our study, the total score of T2-weighted, DWI, and DCE MR imaging achieved an area under the ROC curve of 0.86 for the PZ and 0.87 for the TZ. Schimmöller et al (23) evaluated the original PI-RADS in 2014 in 566 lesions with confirmation at MR imaging in-bore biopsy as a reference standard. A combination of T2-weighted, DWI, and DCE MR imaging achieved an area under the ROC curve of 0.81. In another study of the same patient population, the authors (22) stated that the sensitivity and specificity for the detection of prostate cancer were 86.0% and 47.2%, respectively, when a cut-off PI-RADS summation value of 11 was used. This analysis is difficult to compare with the revised PI-RADS and its use of a five-point scale, and the comparison could have been influenced by the severity of disease in the study population. Baur et al (3) demonstrated an area under the ROC curve of 0.88 for T2-weighted, 0.93 for DWI, and 0.76 for DCE MR imaging for 113 lesions in 55 patients imaged with a 1.5-T imager, with MR imaging–guided biopsies as a reference standard (3). The main message of this study was that DCE MR imaging did not add significant value for the diagnosis. In a study of 64 patients with 95 regions suspected to be cancer, Roethke et al (24) demonstrated an area under the ROC curve of 0.817 for T2-weighted imaging, 0.768 for DWI, and 0.758 for DCE imaging, with US/MR imaging–fusion guided biopsy as a reference standard. For all sequences combined, Portalez et al (25) showed an area under the ROC curve of 0.86 for the PI-RADS in 129 patients who were referred for repeat biopsies with fusion-guided biopsy as the reference standard. Junker et al (4) found an area under the ROC curve of 0.97 for all sequences combined in the PZ in 50 patients, with whole-mount prostatectomy as a reference standard. In the TZ, however, DCE MR imaging showed very low diagnostic accuracy (area under the ROC curve, 0.60). In a recent meta-analysis, Hamoen et al (26) included 14 studies (1785 patients), and the pooled data showed sensitivity of 0.78 (95% confidence interval: 0.70, 0.84) and specificity of 0.79 (95% confidence interval: 0.68, 0.86) for detection of prostate cancer, with negative predictive values ranging from 0.58 to 0.95. Sensitivity analysis revealed pooled sensitivity of 0.82 (95% confidence interval: 0.72, 0.89) and specificity of 0.82 (95% confidence interval: 0.67, 0.92) in studies with correct use of PI-RADS (26). Thus, our results with PI-RADS version 2.0 are comparable to those of previous studies in which the original PI-RADS was used and suggest that there may be structural limits to the ability of PI-RADS or any scoring system based on MR imaging to allow detection of all prostate cancers with high specificity.
Our study had several limitations. First, the readers were trained with a three-point scoring system developed in-house. The initial test session with 20 cases showed very little agreement on PI-RADS scores, but when we added training sessions before the actual scoring session, we found that agreement improved dramatically (data not presented in this article). Therefore, the amount of training and familiarity with PI-RADS could have influenced the interreader variability. The data presented here represent the kind of variability one might expect early after the deployment of the second version of PI-RADS. We predict that interreader variability would decrease with increasing use. Another potential limitation is that the readers had different levels of experience. This might explain some of the variability seen. However, the variability we showed is comparable to that reported in other studies in which authors evaluated the previous version of PI-RADS. It is important that a broad range of experience be tested, because prostate MR imaging is likely to be used in both high– and low–patient volume settings. The hope is that PI-RADS will serve to equalize readings despite different levels of expertise. A third limitation is that only lesions suspected to be cancer were evaluated for this study. We only scored lesions that were previously determined to be sufficiently suspicious for cancer to warrant a fusion-guided biopsy according to parameters of the in-house scoring system used at the time of MR imaging. This was necessary because these were the only validated lesions. The in-house scoring system only allows identification of a lesion when there is a sufficient amount of suspicion to warrant biopsy (comparable to overall PI-RADS score ≥ 3) (12). This also explains the relatively low number of lesions that were scored as PI-RADS 1 or PI-RADS 2 by the panel. Because only targeted biopsies were taken from the areas that were suspicious for cancer at multiparametric MR imaging and not from each of the 27 sectors in each prostate (27), we did not have any data from sectors that did not show lesions suspicious for cancer on MR images. Therefore, we could not draw conclusions about the true- and false-negative results on MR images or the present results for sensitivity, specificity, positive predictive value, and negative predictive value. However, PI-RADS mainly will be used for evaluation of multiparametric MR imaging for a lesion that is suspicious for cancer, so it is important to know how it performs in the exact setting in which it was tested. Another limitation was the definition of clinically relevant prostate cancer. We have accepted lesions with Gleason scores greater than or equal to 4+3 to be clinically relevant; however, there is currently no universally accepted consensus on this topic. Finally, the reference standard we used was MR imaging–transrectal US fusion–guided biopsy. Although fusion–guided biopsy is a very accurate technology to sample lesions in the prostate, it is not as accurate as the use of specimens at prostatectomy (28). However, the requirement for surgical specimens had its own limitations, because it would have biased cases toward lesions moderately and highly suspected to be cancer and it would not have allowed testing of the characterized PI-RADS performance in a real-world population of patients undergoing biopsy. Therefore, we chose to work with a biopsy-naïve patient population with MR imaging–transrectal US fusion–guided biopsy results to study a diverse and representative patient population previously reported as a possible representative screening cohort (29).
In conclusion, PI-RADS is an important standardization tool for reporting multiparametric MR imaging results. However, the results of this study show that, like the first version of PI-RADS, the second version is only moderately reproducible. On average, it shows good correlation with histopathologic results and high sensitivity for clinically significant disease, but specificity is low. These data suggest that PI-RADS will continue to evolve as more experience is gained.
Advances in Knowledge
■ Scores derived from the use of the revised version of the Prostate Imaging Reporting and Data System (PI-RADS) are concordant with pathologic results for lesions in both the peripheral zone and the transitional zone of the prostate (Kendall τ for peripheral zone lesions, 0.51 [P < .0001] and for transitional zone lesions, 0.45 [P = .0008]).
■ None of the 12 lesions that were given a PI-RADS score of 2 were determined to show clinically relevant disease at transrectal US–MR imaging fusion–guided biopsy; in other words, no high-grade lesions were missed.
■ Moderate interreader agreement was shown (multireader κ for overall PI-RADS score, 0.46), which is similar to the results of studies to assess the previous versions of PI-RADS.
Implication for Patient Care
■ By implementing the new scoring system, clinicians can make better estimations of the risk of prostate cancer at multiparametric MR imaging.
APPENDIX
Received December 8, 2014; revision requested January 9, 2015; revision received February 16; accepted March 31; final version accepted April 17.
Funding: Multiple authors are employees of the National Institutes of Health.
Disclosures of Conflicts of Interest: B.G.M. disclosed no relevant relationships. J.H.S. disclosed no relevant relationships. S.S. disclosed no relevant relationships. J.M. disclosed no relevant relationships. S.R.B. disclosed no relevant relationships. A.G. disclosed no relevant relationships. J.J.M.C.H.d.l.R. disclosed no relevant relationships. M.M. disclosed no relevant relationships. B.J.W. disclosed no relevant relationships. P.P. disclosed no relevant relationships. P.L.C. disclosed no relevant relationships. B.T. disclosed no relevant relationships.
Abbreviations:
- ADC
- apparent diffusion coefficient
- DCE
- dynamic contrast material enhanced
- DWI
- diffusion-weighted imaging
- PI-RADS
- Prostate Imaging Reporting and Data System
- PZ
- peripheral zone
- ROC
- receiver operating characteristic
- TZ
- transitional zone
References
- 1.Barentsz JO, Richenberg J, Clements R, et al. ESUR prostate MR guidelines 2012. Eur Radiol 2012;22(4):746–757. [DOI] [PMC free article] [PubMed] [Google Scholar]
- 2.Obenauer S, Hermann KP, Grabbe E. Applications and literature review of the BI-RADS classification. Eur Radiol 2005;15(5):1027–1036. [DOI] [PubMed] [Google Scholar]
- 3.Baur AD, Maxeiner A, Franiel T, et al. Evaluation of the prostate imaging reporting and data system for the detection of prostate cancer by the results of targeted biopsy of the prostate. Invest Radiol 2014;49(6):411–420. [DOI] [PubMed] [Google Scholar]
- 4.Junker D, Schäfer G, Edlinger M, et al. Evaluation of the PI-RADS scoring system for classifying mpMRI findings in men with suspicion of prostate cancer. Biomed Res Int 2013;2013:252939. [DOI] [PMC free article] [PubMed] [Google Scholar]
- 5.American College of Radiology . PIRADS v2. Reston, Va: American College of Radiology, 2014. [Google Scholar]
- 6.Bomers JG, Barentsz JO. Standardization of multiparametric prostate MR imaging using PI-RADS. Biomed Res Int 2014;2014:431680. [DOI] [PMC free article] [PubMed] [Google Scholar]
- 7.Turkbey B, Mani H, Shah V, et al. Multiparametric 3T prostate magnetic resonance imaging to detect cancer: histopathological correlation using prostatectomy specimens processed in customized magnetic resonance imaging based molds. J Urol 2011;186(5):1818–1824. [DOI] [PMC free article] [PubMed] [Google Scholar]
- 8.Turkbey B, Pinto PA, Mani H, et al. Prostate cancer: value of multiparametric MR imaging at 3 T for detection—histopathologic correlation. Radiology 2010;255(1):89–99. [DOI] [PMC free article] [PubMed] [Google Scholar]
- 9.Pinto PA, Chung PH, Rastinehad AR, et al. Magnetic resonance imaging/ultrasound fusion guided prostate biopsy improves cancer detection following transrectal ultrasound biopsy and correlates with multiparametric magnetic resonance imaging. J Urol 2011;186(4):1281–1285. [DOI] [PMC free article] [PubMed] [Google Scholar]
- 10.Hong CW, Rais-Bahrami S, Walton-Diaz A, et al. Comparison of magnetic resonance imaging and ultrasound (MRI-US) fusion-guided prostate biopsies obtained from axial and sagittal approaches. BJU Int 2015;115(5):772–779. [DOI] [PMC free article] [PubMed] [Google Scholar]
- 11.Xu S, Kruecker J, Turkbey B, et al. Real-time MRI-TRUS fusion for guidance of targeted prostate biopsies. Comput Aided Surg 2008;13(5):255–264. [DOI] [PMC free article] [PubMed] [Google Scholar]
- 12.Rais-Bahrami S, Siddiqui MM, Turkbey B, et al. Utility of multiparametric magnetic resonance imaging suspicion levels for detecting prostate cancer. J Urol 2013;190(5):1721–1727. [DOI] [PMC free article] [PubMed] [Google Scholar]
- 13.Rastinehad AR, Turkbey B, Salami SS, et al. Improving detection of clinically significant prostate cancer: magnetic resonance imaging/transrectal ultrasound fusion guided prostate biopsy. J Urol 2014;191(6):1749–1754. [DOI] [PMC free article] [PubMed] [Google Scholar]
- 14.Turkbey B, Mani H, Aras O, et al. Prostate cancer: can multiparametric MR imaging help identify patients who are candidates for active surveillance? Radiology 2013;268(1):144–152. [DOI] [PMC free article] [PubMed] [Google Scholar]
- 15.Hollander M, Wolfe DA. Nonparametric statistical methods. 2nd ed. New York, NY: Wiley, 1999. [Google Scholar]
- 16.Hoffman EB, Sen PK, Weinberg CR. Within-cluster resampling. Biometrika 2001;88(4):1121–1134. [Google Scholar]
- 17.Williamson JM, Datta S, Satten GA. Marginal analyses of clustered data when cluster size is informative. Biometrics 2003;59(1):36–42. [DOI] [PubMed] [Google Scholar]
- 18.Team TRC. R: A language and environment for statistical computing. Vienna, Austria: R Foundation for Statistical Computing. http://www.R-project.org/. Published 2014. Accessed December 6, uk 2014. [Google Scholar]
- 19.Rosenkrantz AB, Lim RP, Haghighi M, Somberg MB, Babb JS, Taneja SS. Comparison of interreader reproducibility of the prostate imaging reporting and data system and likert scales for evaluation of multiparametric prostate MRI. AJR Am J Roentgenol 2013;201(4):W612–W618. [DOI] [PubMed] [Google Scholar]
- 20.Rosenkrantz AB, Kim S, Lim RP, et al. Prostate cancer localization using multiparametric MR imaging: comparison of Prostate Imaging Reporting and Data System (PI-RADS) and Likert scales. Radiology 2013;269(2):482–492. [DOI] [PubMed] [Google Scholar]
- 21.Schimmöller L, Quentin M, Arsov C, et al. Inter-reader agreement of the ESUR score for prostate MRI using in-bore MRI-guided biopsies as the reference standard. Eur Radiol 2013;23(11):3185–3190. [DOI] [PubMed] [Google Scholar]
- 22.Schimmöller L, Quentin M, Arsov C, et al. Predictive power of the ESUR scoring system for prostate cancer diagnosis verified with targeted MR-guided in-bore biopsy. Eur J Radiol 2014;83(12):2103–2108. [DOI] [PubMed] [Google Scholar]
- 23.Schimmöller L, Quentin M, Arsov C, et al. MR-sequences for prostate cancer diagnostics: validation based on the PI-RADS scoring system and targeted MR-guided in-bore biopsy. Eur Radiol 2014;24(10):2582–2589. [DOI] [PubMed] [Google Scholar]
- 24.Roethke MC, Kuru TH, Schultze S, et al. Evaluation of the ESUR PI-RADS scoring system for multiparametric MRI of the prostate with targeted MR/TRUS fusion-guided biopsy at 3.0 Tesla. Eur Radiol 2014;24(2):344–352. [DOI] [PubMed] [Google Scholar]
- 25.Portalez D, Mozer P, Cornud F, et al. Validation of the European Society of Urogenital Radiology scoring system for prostate cancer diagnosis on multiparametric magnetic resonance imaging in a cohort of repeat biopsy patients. Eur Urol 2012;62(6):986–996. [DOI] [PubMed] [Google Scholar]
- 26.Hamoen EH, de Rooij M, Witjes JA, Barentsz JO, Rovers MM. Use of the Prostate Imaging Reporting and Data System (PI-RADS) for prostate cancer detection with multiparametric magnetic resonance imaging: a diagnostic meta-analysis. Eur Urol 2015;67(6):1112–1121. [DOI] [PubMed] [Google Scholar]
- 27.Dickinson L, Ahmed HU, Allen C, et al. Magnetic resonance imaging for the detection, localisation, and characterisation of prostate cancer: recommendations from a European consensus meeting. Eur Urol 2011;59(4):477–494. [DOI] [PubMed] [Google Scholar]
- 28.Siddiqui MM, Rais-Bahrami S, Truong H, et al. Magnetic resonance imaging/ultrasound-fusion biopsy significantly upgrades prostate cancer versus systematic 12-core transrectal ultrasound biopsy. Eur Urol 2013;64(5):713–719. [DOI] [PMC free article] [PubMed] [Google Scholar]
- 29.Rais-Bahrami S, Siddiqui MM, Vourganti S, et al. Diagnostic value of biparametric magnetic resonance imaging (MRI) as an adjunct to prostate-specific antigen (PSA)-based detection of prostate cancer in men without prior biopsies. BJU Int 2015;115(3):381–388. [DOI] [PMC free article] [PubMed] [Google Scholar]
Associated Data
This section collects any data citations, data availability statements, or supplementary materials included in this article.