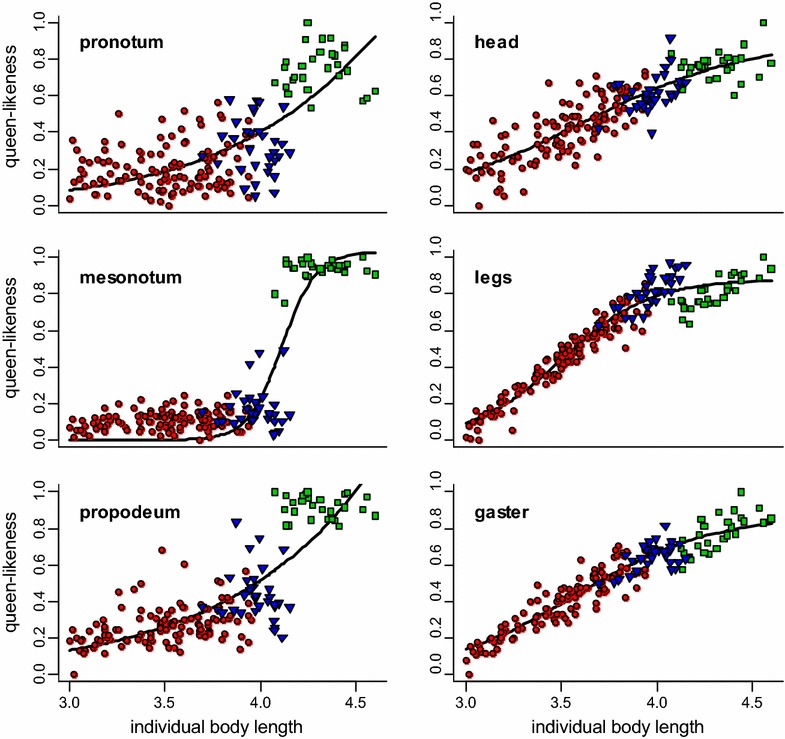
Fig. 5.

Profiles of variation for each module. Green squares queens; blue triangles intercastes; red circles workers. A sigmoid function was fitted to the data of each module. The three thoracic modules had a clear sigmoid relationship with body length, whereas head, legs, and gaster presented a more linear profile of variation when body length increased
