Abstract
The steady-state visual evoked potential (SSVEP), a neurophysiological marker of attentional resource allocation with its generators in early visual cortex, exhibits enhanced amplitude for emotional compared to neutral complex pictures. Emotional cue extraction for complex images is linked to the N1-EPN complex with a peak latency of ∼140–160 ms. We tested whether neural facilitation in early visual cortex with affective pictures requires emotional cue extraction of individual images, even when a stream of images of the same valence category is presented. Images were shown at either 6 Hz (167 ms, allowing for extraction) or 15 Hz (67 ms per image, causing disruption of processing by the following image). Results showed SSVEP amplitude enhancement for emotional compared to neutral images at a presentation rate of 6 Hz but no differences at 15 Hz. This was not due to featural differences between the two valence categories. Results strongly suggest that individual images need to be displayed for sufficient time allowing for emotional cue extraction to drive affective neural modulation in early visual cortex.
Keywords: SSVEP, attention, emotional cue extraction, human early visual cortex
Introduction
Emotionally salient visual cues of threat or reward are associated with heightened activity in visual cortex reflecting their facilitated processing (Lang et al., 1998; Vuilleumier et al., 2001; Bradley et al., 2003; Sabatinelli et al., 2009; Vuilleumier and Huang, 2009). Such an enhanced perceptual processing supports the account in which emotionally intense relative to neutral cues gain preferential access to attention resources due to their intrinsic motivational relevance (Lang et al., 1998; Bradley et al., 2003; Vuilleumier, 2005; Sabatinelli et al., 2009). It has been suggested that facilitation of visual perception to affective stimuli is conveyed via reentrant feedback signals from amygdala and/or higher cortical areas to early visual areas that may thus enhance sensory gain in the visual networks coding for significant features (Vuilleumier and Driver, 2007; Keil et al., 2009; Sabatinelli et al., 2009; Pourtois et al., 2013). Valuable insights into how neural mechanisms of affective picture processing are implemented in the human brain have been gained by examining two markers of electrophysiological activity—the steady-state visual evoked potential (SSVEP) and event-related potentials (ERPs).
ERP findings have indicated that viewing emotional relative to neutral pictures is related to amplitude differences that begin around 120 ms, peaking at a latency of ∼140–160 ms (N1). The N1 is followed by the so-called early posterior negativity (EPN) around 200–300 ms after stimulus onset (Junghöfer et al., 2001; Schupp et al., 2006; Olofsson et al., 2008; Schupp et al., 2008; Weinberg and Hajcak, 2010; Wiens and Syrjänen, 2013). These early negativities (Weinberg and Hajcak, 2010), or N1-EPN complex (Schönwald and Müller, 2014), are seen as a neural signature of emotional cue extraction in complex emotional pictures.
Further evidence for the modulation of visual cortex by emotional stimuli has come from research using SSVEPs. The SSVEP is a continuous oscillatory response to a flickering stimulus that has the same temporal frequency as the driving stimulus (Regan, 1989), with its main generators in early visual areas including primary visual cortex (Müller et al., 2006; Di Russo et al., 2007). Importantly, changes in the amplitude of the SSVEP reflect dynamic neural changes related to the driving stimulus (Müller et al., 1998 b; Andersen and Müller, 2010; Vialatte et al., 2010). Notably, SSVEP amplitude is reliably enhanced not only when a subject is selectively paying attention to a certain location or stimulus (Morgan, 1996; Andersen et al., 2009), but also when viewing emotional relative to neutral pictures (Keil et al., 2005; 2008). Thus, SSVEPs serve as a powerful tool to track the allocation of attentional resources toward stimuli over a long period of time.
In typical studies examining how emotional valence modulates SSVEP amplitude, participants view single images, usually taken from the International Affective Picture System (IAPS; Lang et al., 2005), flickering at around 10 Hz for several seconds (Keil et al., 2003; Keil et al., 2009). These images commonly either depict emotionally pleasant (i.e. erotic couples, babies), unpleasant (i.e. mutilated bodies, attack scenes) or neutral scenes (pictures of everyday events). As mentioned earlier, the emotional content of a single picture can be rapidly extracted at ∼140 ms after stimulus onset. However, it is unclear whether SSVEP amplitude modulations are driven by the repeated extraction of emotional content at each presentation cycle, or the integration of emotional picture valence across the entire trial.
One way to investigate that question would be to present a different image for each cycle in a rapid serial visual presentation (RSVP) at different rates. Similar to masking, RSVP allows investigation of neural competition for processing resources (Keysers and Perrett, 2002). Presenting a different image per cycle has the consequence that each image serves as a forward mask for the subsequent image and as a backward mask for the preceding one. Emotionally arousing pictures have been shown to ‘bias’ competition for neural representation with enhanced neural responses to the affective stimulus even under perceptually demanding RSVP conditions (Junghöfer et al., 2001; Smith et al., 2006; Flaisch et al., 2008; Peyk et al., 2009). For example, very rapidly changing sequences of emotional and neutral images allowed for affective discrimination as reflected in the EPN. This was demonstrated for RSVPs with 335 ms (Flaisch et al., 2008) or even 142 ms (Smith et al., 2006) display times per image, which is in the time range of the N1-EPN complex. Furthermore, the ability to distinguish between unpleasant and neutral contents of pictures presented as alternating ‘unpleasant-neutral’ image pairs was shown to be maintained up to a presentation rate of 12 Hz (83 ms) (Peyk et al., 2009). Interestingly, that presentation time was the upper limit for an observable EPN with such alternating sequences. The authors suggested that the strong superposition of negative and positive EPN components of the picture sequences (affective—neutral) eventually led to destructive interference effects for the frequencies above 12 Hz.
Recently, Alonso-Prieto et al. (2013) presented RSVPs at different frequencies with a different neutral face per cycle or the same face throughout the trial. The greatest SSVEP amplitudes differences between these two conditions were found at ∼6 Hz (i.e. ∼170 ms per cycle), with no differences between the two conditions at rates above 10 Hz. Interestingly, the 6 Hz cycle match the latency of the N170 component, seen as a neural marker of face discrimination (Bentin et al., 1996; Bentin and Deouell, 2000; Rossion and Jacques, 2008). Similar to Peyk et al. (2009), Alonso-Prieto et al. (2013) argued that at higher presentation rates (>10 Hz) the fine-grained processing of an individual face might be disrupted by the presentation of the subsequent face.
The findings discussed above raise the following question: Does neural facilitation of early visual cortex activity with emotional complex images require a presentation rate that allows for emotional cue extraction of each image? If this were the case, SSVEP amplitude would only be modulated as a function of valence with an RSVP rate that allows for emotional cue extraction for each individual image (around the N1-EPN complex latency). Consequently, no SSVEP amplitude modulation would be expected when the following image disrupts the processing of the preceding one, as suggested by some studies cited earlier. If, however, the rapid presentation of different images of the same valence category were instead integrated as either ‘emotional’ or ‘neutral’ across the stimulation period, shorter presentation times would suffice to drive differential SSVEP amplitude effects. Furthermore, we aimed to explore whether SSVEP amplitude is sensitive in response to the rapid switch in emotional content of the rapid picture stream: from unpleasant to neutral and vice versa. Here, trials with a change in emotional content i.e. a change from neutral to emotional or vice versa were introduced. These trials allowed us to infer that SSVEP amplitude modulation will follow emotional content extraction supporting the expected amplitude differences (or unchanged amplitudes) for the 6 or 15 Hz RSVP with just emotional or neutral images, respectively.
General methods in all three experiments
Participants
All participants had normal or corrected to normal vision. Prior to the recordings participants received information about the study goals and gave written informed consent. All subjects received either class credits or monetary compensation for their participation (6 € per hour). The study conformed to the Code of Ethics of the World Medical Association and the requirements for EEG studies of the local ethics committee of the University of Leipzig.
Stimuli and task
In all three experiments subjects performed a passive viewing task with the instruction to avoid blinks and eye-movements during stimulus presentation. Task-stimuli constituted unpleasant and neutral IAPS images, 10.36° × 8.22° of visual angle at a viewing distance of 80 cm. A centrally located yellow cross served as fixation on a 19 inch computer screen during the entire experiment. The screen was set at a resolution of 1024 × 768 pixels and 16 bits per pixel color mode.
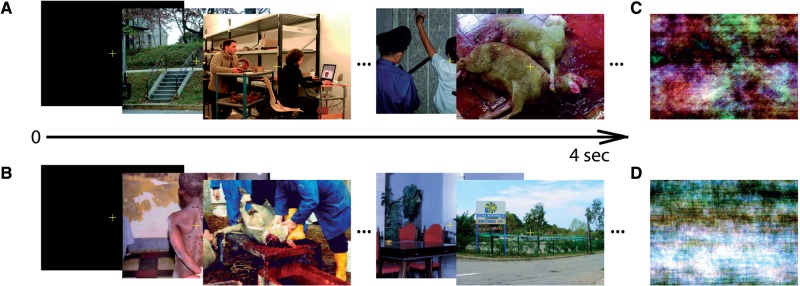
IAPS pictures were presented centrally against a black background and presentation frequency of the picture stream was synchronized to the 60 Hz refresh rate of the monitor. Each image had a size of 419 × 335 pixels and images were pre-processed with MATLAB and SHINE image toolboxes (Willenbockel et al., 2010). Images were presented as an RSVP stream at 15 Hz (∼67 ms, Experiment 1) or 6 Hz (∼167 ms Experiments 2 and 3, see specific Methods). At a certain time point during a trial the RSVP stream of neutral IAPS pictures changed to a stream of unpleasant ones, and vice versa (Figure 1A and B). Alternatively, only unpleasant or neutral images were presented throughout the entire trial. In order to exclude anticipation of the time of affective valence alternation, changes occurred randomly in a certain time window after trial onset (see specific Methods). After each trial a black screen with a white ‘x’ cross was presented for an interval varying randomly between 1150 and 1450 ms. Experiments consisted of 320 trials subdivided into 10 blocks, resulting in 80 trials per condition. Each image was presented in a randomized order (with the restriction that the presentation of two identical images in consecutive order never occurred). All conditions were presented fully randomized across trials and subjects were allowed to take a break between each block. The timing and order of image presentation was controlled using the Cogent toolbox for Matlab (Cogent, www.vislab.ucl.ac.uk/Cogent/; The Mathworks, Inc, Natick, MA).
Fig. 1.
Experimental design. Unpleasant and neutral picture scenes presented in a rapid visual serial presentation for ∼67 ms (15 Hz, Experiment 1) or ∼167 ms (6 Hz, Experiments 2 and 3). (A) Trial with a change in affective content of images: from neutral to unpleasant. (B) Trial with a change from unpleasant to neutral. (C) Example of spectrally equivalent, phase-scrambled image with an unpleasant content of the last unpleasant image in the sequence from 1A. (D) Example of spectrally equivalent, phase-scrambled image with a neutral content (corresponds to the last neutral image in the sequence from 1B). Note: Examples for unpleasant and neutral pictures are taken from GAPED database (Dan-Glauser and Scherer, 2011).
After the EEG session participants were asked to view the IAPS pictures used in the experiment in randomized order and to rate them on the dimension of affective arousal and valence on the 9-point Self-Asessment-Manikin (SAM) scale (Bradley and Lang, 1994).
Electrophysiological (EEG) recordings
Brain electrical activity was recorded from 64 Ag/AgCl scalp electrodes mounted in an elastic cap using a BioSemi ActiveTwo system (BioSemi, The Netherlands) with a sampling rate of 256 Hz. Lateral eye movements were monitored with a horizontal electroocculogram (EOG), while vertical eye movements and blinks were monitored with a bipolar montage positioned below and above the right eye (vertical EOG). Two additional electrodes were used as reference and ground (CMS—‘Common Mode Sense’ and DRL—‘Driven Right Leg’; see http://www.biosemi.com/faq/cms&drl.htm).
SSVEP analysis
For all three EEG experiments we extracted epochs between 1000 ms before and 2000 ms after the image change. For trials without an image change we set a time marker identically time jittered to the trials with changes allowing us to extract identical analysis epochs. Epochs were rejected manually when contaminated with muscle artifacts, blinks or eye movements exceeding about 2 degrees of visual angle (about 20 µV). Subsequently, an automatic artifact detection was performed using ‘Statistical Control of Artifacts in Dense Array EEG/MEG studies’ (Junghöfer et al., 2000). This procedure corrects artifacts such as noisy electrodes using a combination of channel approximation and epoch exclusion based on statistical parameters of the data. Epochs with more than 10 contaminated electrodes within a particular area of the electrode montage were excluded from further analysis. Data were re-referenced to the average reference, and linear trends were removed. Finally, all artifact free or corrected epochs were averaged for each individual and condition, respectively. Trial rejection rate on average was 20.2% (Experiment 1), 15% (Experiment 2) and 21% (Experiment 3), without differences between conditions. The time course of SSVEP amplitudes was extracted by means of a Gabor filter centered at either 15 Hz (Experiment 1) or 6 Hz (Experiments 2 and 3) with a frequency resolution of ±1.5 Hz full-width at half-maximum (FWHM), resulting in a temporal resolution of +/–147.1 ms. To identify electrodes with maximum SSVEP amplitudes for statistical analysis, we calculated iso-contour voltage maps based on the grand averages across all participants, experimental conditions and time, respectively. As depicted in Figures 2, 5 and 8, SSVEP amplitudes across experiments were maximal at nine parieto-occipital electrodes PO3, PO7, O1, Oz, Iz, POz, PO4, PO8 and O2. Given some variations in individual topographical SSVEP amplitude distributions, we selected one electrode with the greatest amplitude out of that cluster for each participant for further statistical analysis (individual best electrode approach). For statistical analysis, we calculated the mean SSVEP amplitudes in a time window from 850 to 150 ms before and 150 to 850 ms after the affective image content change (or set time marker for trials without a change). These time windows were chosen to avoid temporal overlap with the time point of a change due to the temporal resolution of the Gabor filter. From these mean values we calculated the difference between the mean amplitude of the first and second time window. Thus, a negative value indicates an increase in amplitude compared with the first window (what would be expected in trials with a change from neutral to emotional) and vice versa. These difference values were subjected to repeated-measures Analyses of Variances (ANOVAs) with the factors of Change in emotional content (Yes or No) and Emotion in the first time window of the trial (unpleasant or neutral content). Post hoc paired t-tests were conducted using the Bonferroni–Holm correction for multiple comparisons where necessary.
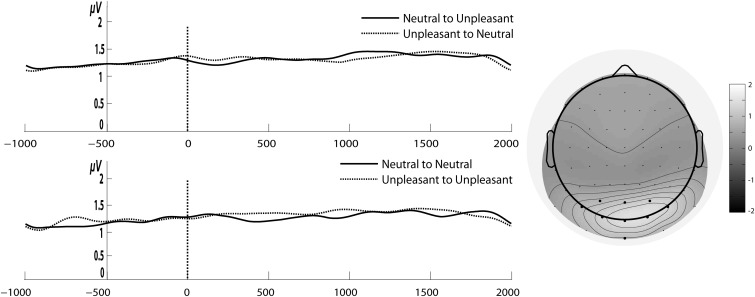
Fig. 2.
Left: Gabor filtered time course of 15 Hz SSVEP amplitudes for the stream of unpleasant and neutral pictures with a change in emotional content (upper panel) and without such a change (lower panel). Time point zero shows the onset of change in emotional content (or a corresponding time marker for conditions with no change). Right: Topographical distribution of grand average of 15 Hz SSVEP amplitude across all subjects and conditions for the entire epoch, i.e. 1 s before to 2 s after the change (or time marker).
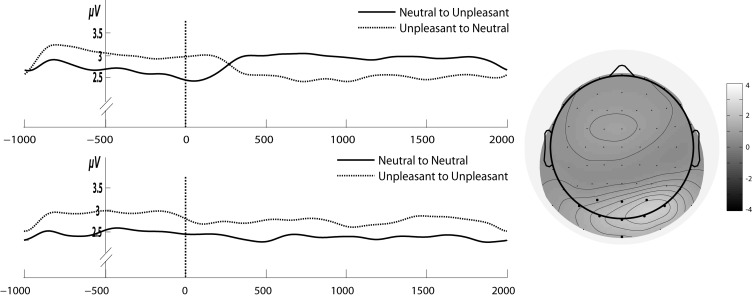
Fig. 5.
Left: Gabor filtered time course of 6 Hz SSVEP amplitudes for the stream of unpleasant and neutral pictures with a change in emotional content (upper panel) and without such a change (lower panel). Time point zero shows the onset of change in emotional content. Right: The grand average of 6 Hz SSVEP amplitude across all subjects and conditions for the time period of 1 s before and 2 after the change in emotional content.
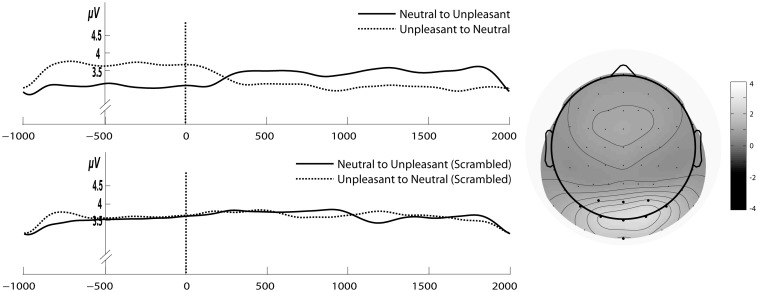
Fig. 8.
Left: Gabor filtered time course of SSVEP amplitudes for the stream of concrete (upper panel) and scrambled (lower panel) unpleasant and neutral pictures with change in emotional content. Time point zero shows the onset of change in emotional content. Right: The grand average of 6 Hz SSVEP amplitude across all subjects and conditions for the time period of 1 s before and 2 after the change in emotional content.
Extraction of epochs from the continuous recording, re-referencing and scalp voltage maps were made in EEGLAB (Delorme and Makeig, 2004) combined with in-house written scripts and running under the MATLAB (The Mathworks). All statistical analyses were conducted in R (R Core Team, 2012).
SAM ratings analyses
Mean arousal and valence SAM ratings for unpleasant and neutral IAPS pictures were subjected to paired t-tests. Generalized eta-squared (ηg2) or Cohen’s d are reported where appropriate as measures of effect size (Olejnik and Algina, 2003; Bakeman, 2005; Baguley, 2012).
Source analysis
To estimate the cortical sources of the SSVEP signal, we calculated statistical parametric maps (SPMs) of the cortical current–density distributions with Variable Resolution Electromagnetic Tomography (VARETA; Bosch-Bayard et al., 2001) for 15 Hz (Experiment 1) and 6 Hz (Experiment 2), respectively. In brief, VARETA estimates primary current densities in source space at predefined 3D grid locations (or voxels) that generate the measured EEG data. 3244 grid points (7.00-mm grid spacing) and the recording array of 64 electrodes are co-registered with the average probabilistic MRI atlas (average brain), produced by the Montreal Neurological Institute (MNI; Evans et al., 1993). Only voxels are included for regions in which the probability of gray matter is unequal to zero. Thus, VARETA places anatomical constraints upon the allowable solutions. SPMs were calculated on the basis of the grand average values across all conditions for 15 Hz (Experiment 1) and 6 Hz (Experiment 2) and tested with Hotelling t2-tests against zero. The same applied for a direct comparison between emotional and neutral images at 6 Hz. Significant voxels were set at threshold of P < 0.001 (Bonferroni corrected for multiple comparisons). Centers of gravity were converted from MNI coordinate space and given in Talairach coordinates (Talairach and Tournoux, 1987).
Experiment 1: RSVP with 15 Hz
Methods
Participants
Thirteen subjects (four male) with a mean age of 24 years [standard deviation (s.d.) = 3.8] participated in Experiment 1.
Stimuli
Each image was presented for four frames, or 66.67 ms, resulting in a frequency of 15 Hz. Total presentation period lasted 4002 ms, resulting in 60 cycles of 15 Hz and, hence, 60 pictures per trial. Eighty unpleasant and 80 neutral IAPS images (see Appendix) were selected (Lang et al., 2005). Thus, each image was presented 120 times throughout the experiment. All stimuli were matched across experimental conditions to have equal luminance (M = 0.47; s.d. = 1.6; t156 = 0.57, P = 0.56) and contrast (M = 0.27; s.d. = 0.58; t156 = −1.35, P = 0.17) composition. The mean (representative of the global luminance) and standard deviation (representative of RMS contrast) of the luminance distribution of every image was calculated on the intensity of pixels ranging from 0 to 1 (with minimum 0—black and maximum 1—white). Additionally, we calculated mean luminance against background that on average was 32.20 cd/m2. In Experiment 1, the change in valence (see Figure 1A and B) occurred randomly in a time window between 1533 and 1934 ms after trial onset.
Results
SAM ratings
As expected, unpleasant IAPS pictures were rated as less pleasant (Valence: M = 2.83, s.d. = 0.6, t12 = −12.05, P < 0.001, d = −3.34) and more arousing (Arousal: M = 6.00, s.d. = 1.06, t12 = 9.9, P < 0.001, d = 2.74) than neutral pictures (Valence: M = 5.63, s.d. = 0.45; Arousal: 3.06, s.d. = 1.11).
SSVEP amplitudes
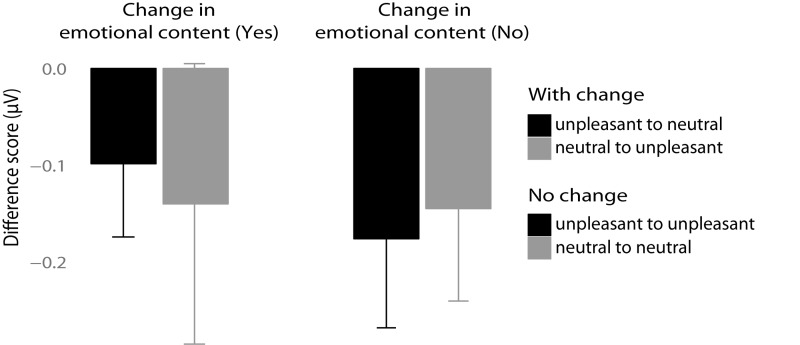
We neither found a significant main effect of Change (F1,12 = 2.41, P = 0.14, ηg2 = 0.01) nor Emotion in the first time window (F1,12 = 0.009, P = 0.92, ηg2 = 0.0002). Importantly, the interaction between both factors was also not significant (F1,12 = 0.96, P = 0.34, ηg2 = 0.01). Thus, there was no evidence that SSVEP amplitudes were modulated by emotional valence of images, with or without a change in emotional content (see Figures 2 and 3).
Fig. 3.
Mean amplitude difference values (first minus second time window) for 15 Hz SSVEP in microvolts. Left panel: Trials with a change in emotional content. Right panel: Trials without a change in emotional content. Error bars represent 95% CIs.
SSVEP source localization
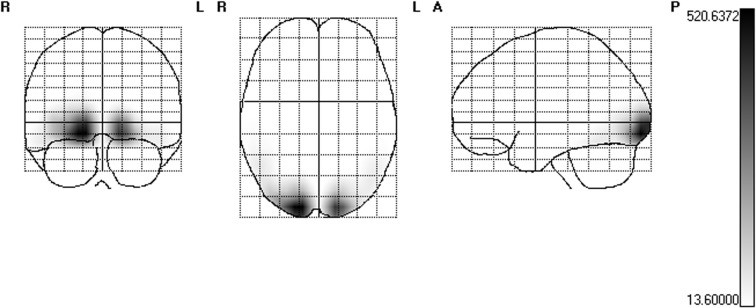
Figure 4 depicts cortical sources averaged across all conditions (unpleasant and neutral picture streams as well as for picture streams with a change in emotional content) for the 15 Hz SSVEP. Similar to previous studies with flickering emotional and neutral images (Keil et al., 2008; 2009), sources of the SSVEP were found in temporo-occipital areas of visual cortex. Here, the center of gravity was located in the right fusiform gyrus (Talairach coordinates: 18,−86, −13).
Fig. 4.
SPMs of the 15 Hz SSVEP estimated cortical current source-density distributions averaged across all conditions. The scale represent t-values, the threshold 13.6 corresponds to P < 0.001 and was Bonferroni corrected for multiple comparisons.
Summary
Presenting a distinct picture for as brief as 67 ms in an RSVP stream did not modulate SSVEP amplitude as a function of affective valence. The presentation of individual images of the same valence category, even for as long as 4 s, did not facilitate neural activity in early visual cortex for emotional compared with neutral images. Such a short presentation time for each individual picture may have led to destructive masking effects disrupting emotional cue extraction of the preceding image. In Experiment 2, presentation rate was increased to 167 ms (i.e. 6 Hz). Given the latency of the N1-EPN complex onset, peaking between 140 and 160 ms, an RSVP of 6 Hz should not lead to a significant disruption of emotional cue extraction by the following image, and thus would be expected to modulate SSVEP amplitude as a function of affective valence.
Experiment 2: RSVP with 6 Hz
Methods
Participants
We recruited 13 volunteers from 20 to 43 years (M = 24, s.d. = 6.34; 11 female) to participate in the study.
Stimuli
Each image was presented for 10 frames or 166.67 ms, resulting in a frequency of 6 Hz. Each trial presentation lasted for 4000 ms, resulting in 24 cycles of 6 Hz stimulation frequency and 24 pictures per trial. Forty-six unpleasant and 46 neutral IAPS images used in Experiment 1 as well as 14 unpleasant and 14 neutral pictures (see Appendix) were selected from Emotional Picture Set (EmoPicS; Wessa et al., 2010). Additional minor changes in the picture selection for Experiment 2 were made in order to ensure similar picture complexity between experimental conditions based on subjective IAPS picture ratings (obtained from Andreas Keil, University of Gainesville; Florida) as well as physical complexity as given by JPEG size. All stimuli were matched between experimental conditions to have equal luminance (unpleasant: M = 0.49; s.d. = 0.003; neutral: M = 0.49; s.d. = 0.002; t118 = 0.9, P = 0.37), contrast composition (unpleasant: M = 0.25; s.d. = 0.007; neutral: M = 0.25; s.d. = 0.005; t118 = 0.25, P = 0.8) as well as subjective complexity (unpleasant: M = 4.2; s.d. = 1.7; neutral: M = 4.4; s.d. = 1.6; t118 = − 0.85, P = 0.4) and JPEG complexity (unpleasant: M = 34.4; s.d. = 11.7; neutral: M = 33.7; s.d. = 10.4; t118 = 0.36, P = 0.71). Luminance against background was 31.47 cd/m2 on average. Given the different stimulation frequency, in Experiment 2 the change in valence occurred randomly between 1500 and 2000 ms after trial onset, and each image was presented 64 times throughout the experiment.
Results
SAM ratings
Unpleasant IAPS images were rated as less pleasant (M = 2.47, s.d. = 0.59, t12 = −15.3, P < 0.001, d = −4.24) and more arousing (M = 5.84, s.d. = 1.81, t12 = 9.09, P < 0.001, d = 2.52) than neutral pictures (Valence M = 5.52, s.d. = 0.62; Arousal M = 2.84, s.d. = 1.43).
SSVEP amplitudes
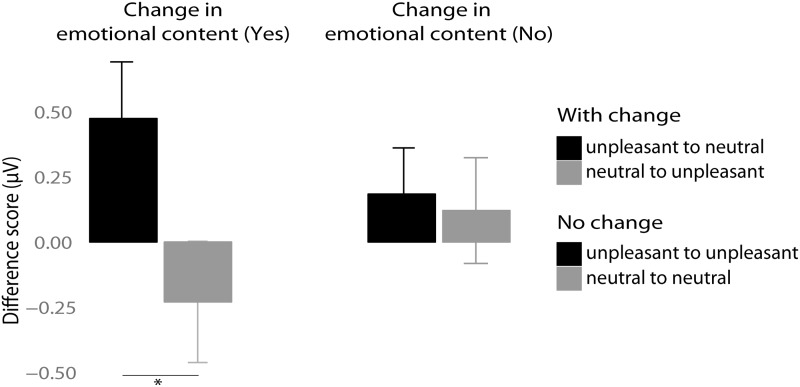
Analysis revealed no significant main effect of Change (F1,12 = 0.083, P = 0.77; ηg2 = 0.002) but there was a significant overall increase in SSVEP amplitude when unpleasant picture contents were presented compared with neutral ones (main effect of Emotion in the first time window (F1,12 = 21.43, P = 0.0005, ηg2 = 0.25). However, the interpretation of this main effect is qualified by the presence of significant interaction Change × Emotion (F1,12 = 9.03, P = 0.01, ηg2 = 0.19). Importantly, follow-up paired t-tests revealed that with the change in affective content from unpleasant to neutral and vice versa the SSVEP amplitude was respectively decreased or increased (P < 0.01) (see Figure 6). In contrast, in the conditions with the presentation of either only unpleasant or neutral pictures amplitudes did not change (P = 0.5).
Fig. 6.
Mean amplitude difference values (first minus second time window) for 6 Hz SSVEP in microvolts. Left panel: Trials with a change in emotional content. Right panel: Trials without a change in emotional content. Error bars represent 95% CIs. Significant change corresponding to P-value < 0.01 is marked with *.
SSVEP source localization
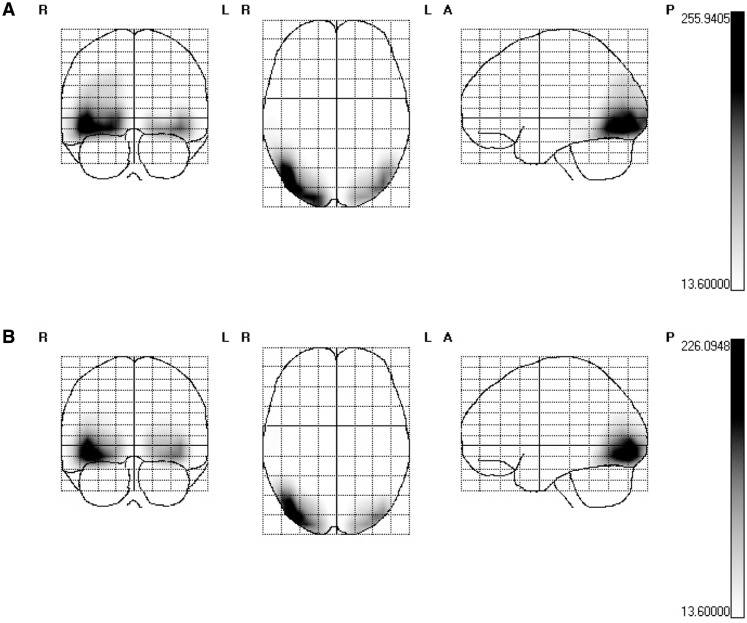
Figure 7A depicts the cortical sources averaged across all conditions for the 6 Hz SSVEP. As expected, images that flickered at 6 Hz activated almost identical early visual areas compared with 15 Hz RSVP. Again, the center of gravity was found in the right fusiform gyrus (Talairach coordinates: 39, −73, −11). Figure 7B presents SPMs of the contrast between unpleasant and neural pictures. The center of gravity was identical to that of the 6 Hz SSVEP averaged across all conditions (right fusiform gyrus; Talairach coordinates: 39, −73, −11).
Fig. 7.
SPMs of the 6 Hz SSVEP estimated cortical current source-density distributions. The scale represent t-values, the threshold 13.6 corresponds to P < 0.001 and was Bonferroni corrected for multiple comparisons. (A) SPMs of the 6 Hz averaged across all conditions (B) SPMs of the contrast between unpleasant and neutral time windows (all unpleasant time windows tested against neutral time windows in the experiment).
Cross-experiment comparison
A mixed ANOVA was conducted comprising a between-subjects factor Frequency (6 Hz/15 Hz) and within-subjects factors Change in emotion (yes/no) and Emotion (unpleasant/neutral). The three-way interaction Frequency × Change × Emotion was significant (F1,24 = 6.33, P < 0.05, ηg2 = 0.06). Follow-up ANOVAs revealed that at 6 Hz the interaction Change × Emotion was significant (F1,12 = 9.03, P < 0.01, ηg2 = 0.18), that is, with the change in affective content SSVEP amplitude decreased or increased (P < 0.01). In contrast, no significant main effects or interactions were found at 15 Hz (all Fs < 1.45, ps > 0.46, ηg2s < 0.006).
Summary
In line with our expectations, increasing the presentation time to 167 ms per image resulted in SSVEP amplitude modulation as a function of valence. Source localization revealed two important results: there are no obvious differences in the cortical areas that were activated by 15 compared with 6 Hz RSVP rate and greater activation with emotional images occurred basically in these areas, indicative of a sensory gain in early visual cortex. However, one possible confound is that unpleasant relative to neutral IAPS pictures often have a particularly salient featural composition (i.e. red blood for mutilated bodies, dark shape of objects etc.). These features may have made the unpleasant images more salient, and thus, attracted more attention. Although such an alternative explanation appears unlikely, because these low-level differences were also present in Experiment 1, in Experiment 3 we additionally presented phase-scrambled versions of the respective images in which any content-related information was distorted but low-level physical parameters (luminance, contrast, spatial frequency, color) were preserved (see Methods and Figure 1C and D). If any differences in low-level featural composition between emotional and neutral pictures had contributed significantly to the observed affective SSVEP amplitude modulations in Experiment 2, we would expect similar SSVEP effects with scrambled images.
Experiment 3: RSVP with scrambled and intact pictures at 6 Hz
Methods
Participants
Thirteen volunteers (12 female) from 21 to 48 years (M = 27, s.d. = 6.77) were recruited.
Stimuli and task
The same pictures, experimental design and procedure were used as in Experiment 2. In addition to the intact images we presented their phase-scrambled version (see Figure 1C and D). Scrambling of images was performed by a Fourier transform, randomizing phase-components of each picture to distort any content-related information but preserving its amplitude spectrum to have the same global physical properties as their non-scrambled originals [previously implemented in Hindi Attar et al. (2010); Müller et al. (2011); Schönwald and Müller (2014)]. Additionally, scrambled images were pre-processed to ensure equal luminance (M = 0.5; s.d. = 0.0001; F3,236 = 0.059, P = 0.98) and contrast composition (M = 0.25; s.d. = 0.0002; F3,236 = 0.18, P = 0.91) between experimental conditions. As with intact images, 6 Hz streams of scrambled neutral IAPS images could change to a stream of scrambled negative ones, and vice versa. Across the experiment, each picture was repeated 64 times as in Experiment 2 (32 times as intact and 32 times as scrambled).
Results
SAM ratings
Only intact versions of IAPS pictures were subjected to the rating procedure. As expected, unpleasant IAPS pictures were rated as less pleasant (M = 2.04, s.d. = 0.36, t12 = –17.9, P < 0.001, d = −4.97) and more arousing (M = 6.65, s.d. = 1.27, t12 = 11.17, P < 0.001, d = 3.09) than neutral pictures (Valence mean rating 5.7, s.d. = 0.57; Arousal mean rating 3.25, s.d. = 1.09).
SSVEP amplitudes
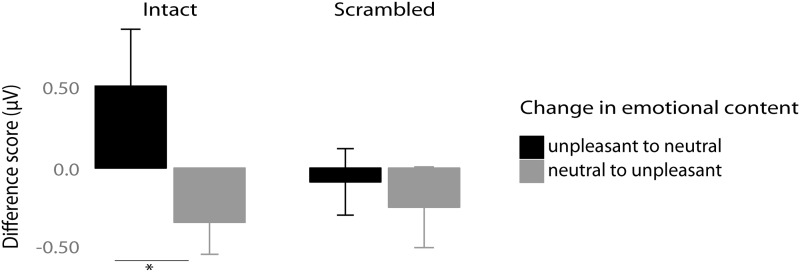
For statistical analysis the ANOVA factor of Change from Experiments 1 and 2 was changed to the factor of Scrambled (Yes or No). Analysis revealed a significant main effect of Scrambled (F1,12 = 9.42, P < 0.01; ηg2 = 0.08) showing greater amplitudes towards intact pictures relative to scrambled ones and a main effect of Emotion in the first time window (F1,12 = 9.36, P < 0.01, ηg2 = 0.27) signifying an overall increase in SSVEP amplitude with unpleasant compared with neutral pictures. The interpretation of this main effect was qualified by the presence of significant interaction Scrambled × Emotion (F1,12 = 12.9, P < 0.01, ηg2 = 0.08). Follow-up paired t-tests revealed that with the change in affective content from unpleasant to neutral intact and vice versa SSVEP amplitude decreased or increased, respectively (P < 0.05) (see Figure 9). In contrast, in conditions with scrambled pictures the change in emotional content did not modulate SSVEP amplitudes (P = 0.6).
Fig. 9.
Mean amplitude difference values (first minus second time window) in microvolts for intact (left panel) and scrambled (right panel) trials. Error bars represent 95% CIs. Significant change corresponding to P-value < 0.05 is marked with *.
Summary
We replicated the main finding of Experiment 2: SSVEP amplitude was modulated as a function of valence for intact images. Importantly, we found no differences in SSVEP amplitude for scrambled versions of neutral compared with unpleasant picture streams. Results strongly suggest that neural facilitation of early visual cortex with unpleasant images was not driven by their low-level featural composition (i.e. color, spatial frequencies).
General discussion
In a series of three experiments, we investigated SSVEP amplitude modulation as a function of emotional valence by presenting complex neutral or unpleasant images as RSVP streams at either 6 or 15 Hz. Previous studies showed that SSVEP amplitude enhancement is related to neural facilitation, or sensory gain (Müller et al., 1998 a,b), in early visual cortex (Müller and Hillyard, 2000; Andersen et al., 2008). We found enhanced SSVEP amplitudes for unpleasant compared with neutral RSVP streams at 6 Hz (167 ms per image). In contrast, we found no such effect at 15 Hz, suggesting that sufficient time to extract the emotional content of each image is required for SSVEP effects to arise. We also investigated several possible confounds, such as low-level image properties and differences in the cortical generators of 6 and 15 Hz SSVEPs. We found that these confounds were unlikely to influence our results.
Perceptual masking that presumably interrupted processing stages at which emotional content of an image can be extracted ( ∼ 140–160 ms, N1-EPN complex latency) was most likely to account for the absence of SSVEP affective modulations at 15 Hz (Keysers and Perrett, 2002). Although images of the same valence category were presented for several seconds, clearly that information was not integrated and seems to require a presentation time allowing for emotional cue extraction. In line with our results, Codispoti et al. (2009) showed little to no reliable affective modulation in skin conductance or ERP response for emotional pictures displayed for < 80 ms followed by a visual mask that was also confirmed in studies of natural scene identification that reported significantly reduced correct identification for masked scenes presented for < 80 ms (Bacon-Macé et al., 2005; Grill-Spector and Kanwisher, 2005; Rieger et al., 2005).
Conversely, the 6 Hz rate was likely to be sufficient for emotional content identification of each picture. One way to explain our SSVEP amplitude effects might be that neural facilitation of early visual cortex relies on re-entrant mechanisms from higher cortical areas (Keil et al., 2009). The following processing steps might therefore provide a likely explanation for our results. A first feed-forward sweep of information (Lamme and Roelfsema, 2000) must reach cortical areas that are related to emotional cue extraction. Previously, for complex images we found sources of the EPN in occipito-temporal and parietal areas (Schönwald and Müller, 2014). Importantly, from these higher order structures feedback or re-entrant projections are shown to modulate visual cortex activity (Keil et al., 2009), and hence, result in enhanced SSVEP amplitudes for flickering emotional compared with neutral images. Such a somewhat longer processing loop is also supported by the relatively slow change in amplitude in trials with an emotional change lasting ∼ 350–400 ms. Junghöfer et al. (2001) argued that an RSVP presentation time of 150–200 ms suffices for re-entrant projection to visual cortex. In a follow-up fMRI study these authors reported of increased activity in medial parietal, inferior temporal and extrastriate occipital areas for emotional compared with neutral IAPS images presented at 6 Hz (Junghöfer et al., 2006). That activation pattern agrees well with the activation loop suggested above.
As noted earlier, we also investigated a few possible confounds. First, the emotional effect was not driven by low-level image features (i.e. color, spatial frequencies). If stimulus affect had been conveyed by these low-level image characteristics without access to global picture motifs, SSVEP affective modulations would have been observed also with phase-scrambled pictures. On the contrary, the presentation of distorted unpleasant and neutral images did not exert any influence on the SSVEP as a function of valence. Another possibility might be that in the 15 Hz RSVP the ‘null-effect’ is due to habituation, because an individual image was presented 120 times here but only 64 times in the 6 Hz RSVP throughout the experiment. In order to control for that, we calculated split-half SSVEP amplitudes for the 15 Hz stream in trials with a change and tested them by a repeated measures ANOVA comprising within-subject factors Emotional content (unpleasant/neutral) and Half (first/second). We found no differences between the first and second half of the experiment (all Fs < 1). Finally, the cortical generators for 15 and 6 Hz SSVEPs were both located in early visual cortex, and hence, unlikely to account for the differential SSVEP effects observed across studies. As depicted in Figure 7B, emotional compared to neutral images results in a sensory gain in these areas.
However, the present experiments included only unpleasant IAPS images, therefore we cannot generalize our findings to all emotional images. Therefore, in a future study the design should be extended to pleasant IAPS images to get a direct comparison between unpleasant und pleasant pictures. Based on one of our previous studies in which we found no differences between pleasant and unpleasant IAPS images in a distraction paradigm, we would not expect statistically significant differences here as well (Hindi Attar et al., 2010).
To summarize, in concert with some other studies, our results support the idea that presentation duration for emotional pictures is critical for neural facilitation of early visual cortex activity that resulted in increased SSVEP amplitudes for emotional compared to neutral images at a presentation rate of 6 Hz (i.e. 167 ms per image). If re-entrant projection from areas related to content extraction plays an important role in early visual cortex activation, for complex images the critical time required defines the latency of the N1-EPN complex. Interrupting content extraction by a new image, even if the image is of the same valence category, seems to disrupt individual content extraction. Our results clearly demonstrate that emotional cue extraction of each individual image, rather than an integration process of emotional valence, seems to be required to drive SSVEP affective modulations in early visual areas. Thus, our findings provide further insights into the speed of affective stimulus processing and highlight the SSVEP as a powerful tool in investigating changes in visual cortex activity during emotional stimulus perception.
Acknowledgements
We thank Renate Zahn for help in data recording.
Appendix
IAPS numbers of neutral pictures (Experiment 1):
1122,1350,1645,1908,1945,2036,2038,2039,2191,2206,2235,2272,2273,2357,2377,2381,2400,2410,2445,2485,2525,2580,2593,2594,2597,2745,5120,5130,5201,5395,5455,5500,5530,5535,5635,7001,7010,7011,7026,7030,7033,7036,7037,7038,7041,7044,7050,7057,7059,7061,7062,7081,7130,7136,7140,7160,7161,7165,7175,7179,7180,7188,7217,7300,7491,7495,7504,7512,7513,7546,7547,7550,7560,7595,7632,7700,8162,8250,8325,9260.
IAPS numbers of unpleasant pictures (Experiment 1):
1050,1111,1113,1120,1202,1220,1270,1275,1300,1304,2717,2730,2981,3001,3015,3019,3064,3103,3110,3140,3150,3190,3191,3195,3212,3213,3250,3261,3400,6021,6190,6210,6230,6263,6415,6570,7360,8480,9000,9001,9002,9008,9031,9075,9140,9163,9180,9181,9183,9185,9187,9300,9301,9302,9320,9322,9342,9400,9405,9420,9471,9495,9500,9560,9561,9570,9571,9590,9594,9596,9600,9623,9635,9810,9901,9902,9911,9920,9930,9940.
IAPS numbers of neutral pictures (Experiments 2,3):
1122,1350,1645,1945,2036,2038,2191,2206,2273,2357,2377,2445,2525,2745,5120,5130,5201,5500,5530,5535,7001,7010,7011,7026,7030,7038,7041,7062,7081,7130,7136,7160,7161,7165,7300,7491,7495,7512,7513,7546,7547,7560,7595,7632,8250,8325.
EmoPicS numbers of neutral pictures (Experiments 2,3):
119,121,123,127,128,139,141,148,161,162,176,191,352,375.
IAPS numbers of unpleasant pictures (Experiments 2,3):
1111,1113,1202,1220,2730,2981,3001,3019,3064,3103,3110,3150,3190,3195,3212,3213,3250,3261,6021,6210,9002,9008,9031,9075,9140,9163,9181,9342,9420,9471,9495,9570,9571,9590,9594,9596,9600,9623,9635,9810,9901,9902,9911,9920,9930,9940.
EmoPicS numbers of unpleasant pictures (Experiments 2,3):
216,232,233,234,235,236,240,241,243,248,327,321,325,326.
Funding
This work was supported by the Deutsche Forschungsgemeinschaft [Graduate school ‘Function of attention in cognition’ GRK 1182 and MU972/22-1].
References
- Alonso-Prieto E., Belle G.V., Liu-Shuang J., Norcia A.M., Rossion B. (2013). The 6 Hz fundamental stimulation frequency rate for individual face discrimination in the right occipito-temporal cortex. Neuropsychologia, 51(13), 2863–75. [DOI] [PubMed] [Google Scholar]
- Andersen S.K., Fuchs S., Müller M.M. (2009). Effects of feature-selective and spatial attention at different stages of visual processing. Journal of Cognitive Neuroscience, 23(1), 238–46. [DOI] [PubMed] [Google Scholar]
- Andersen S.K., Hillyard S.A., Müller M.M. (2008). Attention facilitates multiple stimulus features in parallel in human visual cortex. Current Biology, 18(13), 1006–9. [DOI] [PubMed] [Google Scholar]
- Andersen S.K., Müller M.M. (2010). Behavioral performance follows the time course of neural facilitation and suppression during cued shifts of feature-selective attention. Proceedings of the National Academy of Sciences of the United States of America, 107(31), 13878–82. [DOI] [PMC free article] [PubMed] [Google Scholar]
- Bacon-Macé N., Macé M.J.M., Fabre-Thorpe M., Thorpe S.J. (2005). The time course of visual processing: backward masking and natural scene categorisation. Vision Research, 45(11), 1459–69. [DOI] [PubMed] [Google Scholar]
- Baguley T. (2012). Serious Stats: A Guide to Advanced Statistics for the Behavioral Sciences. Hampshire (UK); Palgrave Macmillan. [Google Scholar]
- Bakeman R. (2005). Recommended effect size statistics for repeated measures designs. Behavior Research Methods, 37(3), 379–84. [DOI] [PubMed] [Google Scholar]
- Bentin S., Allison T., Puce A., Perez E., McCarthy G. (1996). Electrophysiological studies of face perception in humans. Journal of Cognitive Neuroscience, 8(6), 551–65. [DOI] [PMC free article] [PubMed] [Google Scholar]
- Bentin S., Deouell L. (2000). Structural encoding and identification in face processing: ERP evidence for separate mechanisms. Cognitive Neuropsychology, 17(1–3), 35–55. [DOI] [PubMed] [Google Scholar]
- Bosch-Bayard J., Valdes-Sosa P., Virues-Alba T., et al. (2001). 3D statistical parametric mapping of EEG source spectra by means of variable resolution electromagnetic tomography (VARETA). Clinical Electroencephalography, 32(2), 47–61. [DOI] [PubMed] [Google Scholar]
- Bradley M.M., Lang P.J. (1994). Measuring emotion: the self-assessment Manikin and the semantic differential. Journal of Behavior Therapy and Experimental Psychiatry, 25(1), 49–59. [DOI] [PubMed] [Google Scholar]
- Bradley M.M., Sabatinelli D., Lang P.J., Fitzsimmons J.R., King W., Desai P. (2003). Activation of the visual cortex in motivated attention. Behavioral Neuroscience, 117(2), 369–80. [DOI] [PubMed] [Google Scholar]
- Codispoti M., Mazzetti M., Bradley M.M. (2009). Unmasking emotion: exposure duration and emotional engagement. Psychophysiology, 46(4), 731–8. [DOI] [PubMed] [Google Scholar]
- Dan-Glauser E., Scherer K. (2011). The Geneva affective picture database (GAPED): a new 730-picture database focusing on valence and normative significance. Behavior Research Methods, 43(2), 468–77. [DOI] [PubMed] [Google Scholar]
- Delorme A., Makeig S. (2004). EEGLAB: an open source toolbox for analysis of single-trial EEG dynamics including independent component analysis. Journal of Neuroscience Methods, 134(1), 9–21. [DOI] [PubMed] [Google Scholar]
- Di Russo F., Pitzalis S., Aprile T., et al. (2007). Spatiotemporal analysis of the cortical sources of the steady-state visual evoked potential. Human Brain Mapping, 28(4), 323–34. [DOI] [PMC free article] [PubMed] [Google Scholar]
- Evans A.C., Collins D.L., Mills S.R., Brown E.D., Kelly R.L., Peters T.M. (1993). 3D statistical neuroanatomical models from 305 MRI volumes, 1993. In: IEEE Conference Record Nuclear Science Symposium and Medical Imaging Conference, San Francisco, CA, USA, IEEE. [Google Scholar]
- Flaisch T., Junghöfer M., Bradley M.M., Schupp H.T., Lang P.J. (2008). Rapid picture processing: affective primes and targets. Psychophysiology, 45(1), 1–10. [DOI] [PubMed] [Google Scholar]
- Grill-Spector K., Kanwisher N. (2005). Visual recognition: as soon as you know it is there, you know what it is. Psychological Science, 16(2), 152–60. [DOI] [PubMed] [Google Scholar]
- Hindi Attar C., Andersen S.K., Müller M.M. (2010). Time course of affective bias in visual attention: convergent evidence from steady-state visual evoked potentials and behavioral data. Neuroimage, 53(4), 1326–33. [DOI] [PubMed] [Google Scholar]
- Junghöfer M., Bradley M.M., Elbert T.R., Lang P.J. (2001). Fleeting images: a new look at early emotion discrimination. Psychophysiology, 38(2), 175–8. [PubMed] [Google Scholar]
- Junghöfer M., Elbert T., Tucker D.M., Rockstroh B. (2000). Statistical control of artifacts in dense array EEG/MEG studies. Psychophysiology, 37(4), 523–32. [PubMed] [Google Scholar]
- Junghöfer M., Sabatinelli D., Bradley M.M., Schupp H.T., Elbert T.R., Lang P.J. (2006). Fleeting images: rapid affect discrimination in the visual cortex. Neuroreport, 17(2), 225–9. [DOI] [PubMed] [Google Scholar]
- Keil A., Gruber T., Müller M.M., et al. (2003). Early modulation of visual perception by emotional arousal: evidence from steady-state visual evoked brain potentials. Cognitive, Affective and Behavioral Neuroscience, 3(3), 195–206. [DOI] [PubMed] [Google Scholar]
- Keil A., Moratti S., Sabatinelli D., Bradley M.M., Lang P.J. (2005). Additive effects of emotional content and spatial selective attention on electrocortical facilitation. Cerebral Cortex, 15(8), 1187–97. [DOI] [PubMed] [Google Scholar]
- Keil A., Sabatinelli D., Ding M., Lang P.J., Ihssen N., Heim S. (2009). Re-entrant projections modulate visual cortex in affective perception: evidence from Granger causality analysis. Human Brain Mapping, 30(2), 532–40. [DOI] [PMC free article] [PubMed] [Google Scholar]
- Keil A., Smith J.C., Wangelin B.C., Sabatinelli D., Bradley M.M., Lang P.J. (2008). Electrocortical and electrodermal responses covary as a function of emotional arousal: a single-trial analysis. Psychophysiology, 45(4), 516–23. [DOI] [PubMed] [Google Scholar]
- Keysers C., Perrett D.I. (2002). Visual masking and RSVP reveal neural competition. Trends in Cognitive Sciences, 6(3), 120–5. [DOI] [PubMed] [Google Scholar]
- Lamme V.A.F., Roelfsema P.R. (2000). The distinct modes of vision offered by feedforward and recurrent processing. Trends in Neurosciences, 23(11), 571–9. [DOI] [PubMed] [Google Scholar]
- Lang P., Bradley M., Cuthbert B.N. (2005). International Affective Picture System (IAPS): Affective Ratings of Pictures and Instruction Manual. Technical Report A-6, Gainesville (FL), University of Florida. [Google Scholar]
- Lang P.J., Bradley M.M., Fitzsimmons J.R., Cuthbert B.N., Scott J.D., Moulder B., Nangia V. (1998). Emotional arousal and activation of the visual cortex: an fMRI analysis. Psychophysiology, 35(02), 199–210. [PubMed] [Google Scholar]
- Morgan S.T. (1996). Selective attention to stimulus location modulates the steady-state visual evoked potential. Proceedings of the National Academy of Sciences of the United States of America, 93(10), 4770–4. [DOI] [PMC free article] [PubMed] [Google Scholar]
- Müller M.M., Andersen S., Trujillo N.J., Valdes-Sosa P., Malinowski P., Hillyard S.A. (2006). Feature-selective attention enhances color signals in early visual areas of the human brain. Proceedings of the National Academy of Sciences of the United States of America, 103(38), 14250–4. [DOI] [PMC free article] [PubMed] [Google Scholar]
- Müller M.M., Andersen S.K., Hindi Attar C. (2011). Attentional bias to briefly presented emotional distractors follows a slow time course in visual cortex. Journal of Neuroscience, 31(44), 15914–8. [DOI] [PMC free article] [PubMed] [Google Scholar]
- Müller M.M., Hillyard S. (2000). Concurrent recording of steady-state and transient event-related potentials as indices of visual-spatial selective attention. Clinical Neurophysiology, 111(9), 1544–52. [DOI] [PubMed] [Google Scholar]
- Müller M.M., Picton T.W., Valdes-Sosa P., Riera J., Teder-Sälejärvi W.A., Hillyard S.A. (1998a). Effects of spatial selective attention on the steady-state visual evoked potential in the 20–28 Hz range. Brain Research. Cognitive Brain Research, 6(4), 249–61. [DOI] [PubMed] [Google Scholar]
- Müller M.M., Teder-Salejarvi W., Hillyard S.A. (1998b). The time course of cortical facilitation during cued shifts of spatial attention. Nature Neuroscience, 1(7), 631–4. [DOI] [PubMed] [Google Scholar]
- Olejnik S., Algina J. (2003). Generalized eta and omega squared statistics: measures of effect size for some common research designs. Psychological Methods, 8(4), 434–47. [DOI] [PubMed] [Google Scholar]
- Olofsson J.K., Nordin S., Sequeira H., Polich J. (2008). Affective picture processing: an integrative review of ERP findings. Biological Psychology, 77(3), 247–65. [DOI] [PMC free article] [PubMed] [Google Scholar]
- Peyk P., Schupp H.T., Keil A., Elbert T., Junghöfer M. (2009). Parallel processing of affective visual stimuli. Psychophysiology, 46(1), 200–8. [DOI] [PMC free article] [PubMed] [Google Scholar]
- Pourtois G., Schettino A., Vuilleumier P. (2013). Brain mechanisms for emotional influences on perception and attention: what is magic and what is not. Biological Psychology, 92(3), 492–512. [DOI] [PubMed] [Google Scholar]
- R Core Team. (2012). R: A Language and Environment for Statistical Computing. Vienna (Austria): R Foundation for Statistical Computing. [Google Scholar]
- Regan D.(1989). Human Brain Electrophysiology: Evoked Potentials and Evoked Magnetic Fields in Science and Medicine. New York (NY): Elsevier. [Google Scholar]
- Rieger J.W., Braun C., Bülthoff H.H., Gegenfurtner K.R. (2005). The dynamics of visual pattern masking in natural scene processing: a magnetoencephalography study. Journal of Vision, 5(3), 275–86. [DOI] [PubMed] [Google Scholar]
- Rossion B., Jacques C. (2008). Does physical interstimulus variance account for early electrophysiological face sensitive responses in the human brain? Ten lessons on the N170. Neuroimage, 39(4), 1959–79. [DOI] [PubMed] [Google Scholar]
- Sabatinelli D., Lang P.J., Bradley M.M., Costa V.D., Keil A. (2009). The timing of emotional discrimination in human amygdala and ventral visual cortex. Journal of Neuroscience, 29(47), 14864–8. [DOI] [PMC free article] [PubMed] [Google Scholar]
- Schönwald L.I., Müller M.M. (2014). Slow biasing of processing resources in early visual cortex is preceded by emotional cue extraction in emotion–attention competition. Human Brain Mapping, 35(4), 1477–90. [DOI] [PMC free article] [PubMed] [Google Scholar]
- Schupp H.T., Flaisch T., Stockburger J., Junghöfer M. (2006). Emotion and attention: event-related brain potential studies. Progress in Brain Research, 156, 31–51. [DOI] [PubMed] [Google Scholar]
- Schupp H.T., Stockburger J., Bublatzky F., Junghöfer M., Weike A.I., Hamm A.O. (2008). The selective processing of emotional visual stimuli while detecting auditory targets: an ERP analysis. Brain Research, 1230, 168–76. [DOI] [PubMed] [Google Scholar]
- Smith J.C., Löw A., Bradley M.M., Lang P.J. (2006). Rapid picture presentation and affective engagement. Emotion, 6(2), 208–14. [DOI] [PubMed] [Google Scholar]
- Talairach J., Tournoux P. (1987). Co-Planar Stereotaxic Atlas of the Human Brain. Stuttgart: Thieme. [Google Scholar]
- Vialatte F.-B., Maurice M., Dauwels J., Cichocki A. (2010). Steady-state visually evoked potentials: focus on essential paradigms and future perspectives. Progress in Neurobiology, 90(4), 418–38. [DOI] [PubMed] [Google Scholar]
- Vuilleumier P. (2005). How brains beware: neural mechanisms of emotional attention. Trends in Cognitive Sciences, 9(12), 585–94. [DOI] [PubMed] [Google Scholar]
- Vuilleumier P., Armony J.L., Driver J., Dolan R.J. (2001). Effects of attention and emotion on face processing in the human brain: an event-related fMRI study. Neuron, 30(3), 829–41. [DOI] [PubMed] [Google Scholar]
- Vuilleumier P., Driver J. (2007). Modulation of visual processing by attention and emotion: windows on causal interactions between human brain regions. Philosophical Transactions of the Royal Society of London. Series B, Biological Sciences, 362(1481), 837–55. [DOI] [PMC free article] [PubMed] [Google Scholar]
- Vuilleumier P., Huang Y.-M. (2009). Emotional attention: uncovering the mechanisms of affective biases in perception. Current Directions in Psychological Science, 18(3), 148–52. [Google Scholar]
- Weinberg A., Hajcak G. (2010). Beyond good and evil: the time-course of neural activity elicited by specific picture content. Emotion, 10(6), 767–82. [DOI] [PubMed] [Google Scholar]
- Wessa M., Kanske P., Neumeister P., Bode K., Heissler J., Schönfelder S. (2010). EmoPicS: subjective and psychophysiological evaluation of new imagery for clinical biopsychological research. Zeitschrift für Klinische Psychologie und Psychotherapie. Suppl., 1/11, 77 pp. (available from Michele Wessa, e-mail:wessa@uni-mainz.de). [Google Scholar]
- Wiens S., Syrjänen E. (2013). Directed attention reduces processing of emotional distracters irrespective of valence and arousal level. Biological Psychology, 94(1), 44–54. [DOI] [PubMed] [Google Scholar]
- Willenbockel V., Sadr J., Fiset D., Horne G., Gosselin F., Tanaka J. (2010). The SHINE toolbox for controlling low-level image properties. Behavior Research Methods, 42(3), 671–84. [DOI] [PubMed] [Google Scholar]


