

Comprehensive biochemical, biophysical, genetic, and electron microscopic analyses of claudin-16 and -19 interactions show how claudin interaction can influence tight junction permeability and tight junction architecture.
Abstract
The molecular nature of tight junction architecture and permeability is a long-standing mystery. Here, by comprehensive biochemical, biophysical, genetic, and electron microscopic analyses of claudin-16 and -19 interactions—two claudins that play key polygenic roles in fatal human renal disease, FHHNC—we found that 1) claudin-16 and -19 form a stable dimer through cis association of transmembrane domains 3 and 4; 2) mutations disrupting the claudin-16 and -19 cis interaction increase tight junction ultrastructural complexity but reduce tight junction permeability; and 3) no claudin hemichannel or heterotypic channel made of claudin-16 and -19 trans interaction can exist. These principles can be used to artificially alter tight junction permeabilities in various epithelia by manipulating selective claudin interactions. Our study also emphasizes the use of a novel recording approach based on scanning ion conductance microscopy to resolve tight junction permeabilities with submicrometer precision.
INTRODUCTION
A fundamental question in cell biology is how cells transport solutes and ions through highly complex tissue structures such as the kidney tubule, the gastrointestinal tract, the lung alveolus, the organ of Corti of the inner ear, and the highly specialized cerebral vasculature—the blood–brain barrier. The cells lining these ductal structures coordinate with each other to acquire apicobasal polarity through the formation of a key extracellular organelle—the tight junction (TJ)—which separates the extracellular space into different compartments (Farquhar and Palade, 1963). The tight junction is responsible for the barrier to movement of solutes and ions between these compartments. Freeze-fracture electron microscopy reveals membrane protein interactions at the tight junction as an anastomosing reticulum of “fibrils” or “strands” on the fracture faces (Goodenough and Revel, 1970). Claudins are the key integral membrane proteins of the tight junction and are capable of forming these “fibrils” or “strands” in several in vitro (Furuse et al., 1999; Hou et al., 2008) and in vivo (Gow et al., 1999; Ben-Yosef et al., 2003) models. Therefore determining how claudins interact is pivotally important for understanding the architecture of tight junction. Claudins associate by cis interactions within the plasma membrane of the same cell into oligomers, followed by trans interactions between claudins in adjacent cells (Furuse et al., 1999; Piontek et al., 2008). Additional cis interactions or tethering through peripheral proteins such as ZO-1 (Stevenson and Goodenough, 1984) may assemble claudin oligomers into the tight junction strand. Claudin-16 and -19, owing to their bona fide physical interaction (Hou et al., 2008, 2009) and polygenic role in causing the syndrome familial hypomagnesaemia with hypercalciuria and nephrocalcinosis (FHHNC) (Online Mendelian Inheritance in Man #248250; Simon et al., 1999; Konrad et al., 2006), can be seen as a prototypical claudin oligomer to model tight junction architecture. Here, using sucrose centrifugation and chemical cross-linking approaches, we find that claudin-16 and -19 form a stable dimer complex through cis interaction in several model cell membranes.
Claudins consist of four transmembrane (TM) domains, two extracellular loops (ECL1 and 2), amino- and carboxyl-terminal cytoplasmic domains, and a short cytoplasmic turn (Hou et al., 2013). A recent breakthrough by Suzuki et al. (2014) revealed the three-dimensional crystal structure of claudin-15 at a resolution of 2.4 Å. The TM domains of claudin-15 are α-helical bundles; the ECL domains contain prominent β-sheet structures. However, the loosely packed claudin monomers in crystal offer limited insight into the claudin polymerization process due to the lack of cis or trans interaction (Suzuki et al., 2014). The claudin-related molecule IP39 formed a two-dimensional crystal that adopted an antiparallel arrangement in a longitudinally polymerized protein array (Suzuki et al., 2013). Such a spatial arrangement suggests potentially important intermolecular interactions at the TM domains. To address this key question, we used the alanine-insertion mutagenesis (AIM) approach to identify the TM loci important for claudin cis interactions. On the basis of the mutations that selectively disrupt the claudin interaction but not its transport function, we were able to obtain critical insights into how claudins are assembled into tight junction strands.
In polarized epithelia, claudins confer ion selectivity to the paracellular pathway, which results in differences in transepithelial resistance (TER) and paracellular permeability (Van Itallie and Anderson, 2006). Measurement of paracellular permeability using cell membrane–impermeable tracers indicates that there are 4- to 7-Å channels in the tight junction (Van Itallie et al., 2008), termed the paracellular channel. Functionally, claudin-16 permeates cations, whereas claudin-19 acts as a barrier to anions when integrated into the tight junction individually (Hou et al., 2005, 2008). Coexpression of claudin-16 and -19 confers cation selectivity to the tight junction as a collective result of their singular functions (Hou et al., 2008). Despite these early efforts to elucidate the macroscopic transport function for claudin, the nature of tight junction permeability is unresolved due to lack of a recording approach that can analyze paracellular conductance with submicrometer resolution. Here, using a newly developed recording approach based on scanning ion conductance microscopy (SICM; Chen et al., 2013), we find that 1) TJ permeability is a product of claudin protein density and its unitary permeability, 2) no claudin hemichannel or heterotypic channel made of claudin trans interaction can exist, and 3) claudin permeation pores can be arranged in a linear or parallel way to modulate overall TJ conductance.
RESULTS
Claudin-16 and -19 form a heterodimer in HEK293 and Sf9 cell membranes
The tight junction is a remarkably complex protein structure that appears as particles (each ∼10 nm in diameter as revealed by freeze-fracture replica) intercalated within anastomosing lipid bilayers (Goodenough and Revel, 1970). Because of this complexity in TJ architecture and in the interactome, native TJs in polarized epithelia are not ideal models for delineating any selected claudin–claudin interaction; instead, simple cell systems such as the yeast cell, the insect Sf9 cell, or nonepithelial HEK293 cells, which neither form TJs nor express endogenous TJ proteins, will allow an unambiguous study of claudin oligomeric nature. Knowing that claudin-16 cis interacts with claudin-19 from both the membrane yeast two-hybrid (Y2H) assay and the coimmunoprecipitation experiments in HEK293 cells (Hou et al., 2008), we asked how claudin-16 and -19 oligomerize in the cell membrane. We previously showed that claudin-16 and -19, when coexpressed in HEK293 cells, were correctly targeted to the plasma membrane and could be solubilized in 1% Triton X-100 detergent, which also preserved their interaction well (Hou et al., 2008). To separate claudin-16/-19 oligomers from their monomers, we subjected the Triton-solubilized HEK293 cell plasma membrane to linear sucrose gradient (5–20%) sedimentation. Because the sedimentation rate in a linear sucrose gradient is largely based on molecular mass and shape (Musil and Goodenough, 1993), the claudin oligomer would be expected to migrate to the higher sucrose density due to its larger sedimentation coefficient than that of the monomers. In claudin-16 or -19 singly transfected HEK293 cells, both claudins were recovered predominantly in the 8% fraction (fraction 3; Figure 1, A and B), indicating unassembled monomers, despite the fact that claudin-19 but not claudin-16 showed significant homomeric interaction in the yeast membrane (Hou et al., 2008). In doubly transfected cells at a molecular ratio of one claudin-16 to one claudin-19, the claudin sedimentation pattern changed significantly. Both claudin-16 (Figure 1A) and -19 (Figure 1B) were now enriched in the 14% fraction (fraction 6), indicating assembled oligomer. To prove that the claudin assembly process is universal and independent of different lipid composition, we performed the same sucrose sedimentation analysis on insect Sf9 cells from Spodoptera frugiperda singly or doubly expressing claudin-16 and -19. Both claudins were delivered to the Sf9 cell using a baculovirus expression system (see Materials and Methods) and found to be correctly localized in the plasma membrane. Similar to the HEK293 cell, singly expressed claudin-16 (Supplemental Figure S1A) or -19 (Supplemental Figure S1B) was concentrated in the 8% fraction, whereas doubly expressed claudins migrated to the 14% fraction (Supplemental Figure S1, A and B). The composition of claudin-16/-19 oligomer was examined by chemical cross-linking experiments. HEK293 cell membrane proteins from the 14% fraction containing the claudin oligomer population were incubated in presence or absence of 0.5% glutaraldehyde (Glu; spacer arm, 5.0 Å), 2.5 mM Bis (NHS) PEG9 (BS(PEG)9; spacer arm, 35.8 Å), 50 μg/ml Bis (sulfosuccinimidyl) suberate (BS3; spacer arm, 11.4 Å), or 2.5 mM dimethyl suberimidate (DMS; spacer arm, 11.0 Å) for 30 min at 4°C. Except for BS(PEG)9 due to its long spacer arm, all of the other cross-linkers—Glu, BS3, and DMS—efficiently cross-linked claudin-16 and -19 into an ∼40-kDa oligomer (Figure 1C). In contrast, no oligomer can be found in the 8% fraction. To report the molecular weight accurately, we subjected the claudin-16 and -19 monomer or oligomer to a linear SDS–polyacrylamide gel (4–20%) in which the migration distance of a protein is proportional to its molecular weight. The claudin-19 monomer runs at 21 kDa, the claudin-16 monomer at 26 kDa, and the oligomer at 41 kDa, compatible with a dimerized arrangement (Figure 1D). The oligomer can be recognized by both anti-claudin-19 and -16 antibodies (Figure 1D), which rules out the possibility of a homodimer, with the only available stoichiometry a heterodimer: one molecule of claudin-16 to one molecule of claudin-19. The same claudin heterodimer can be recapitulated in Sf9 cell membranes (Supplemental Figure S1C). Together these results reveal the fundamental oligomeric unit of claudins, which can then be polymerized into the tight junction strand.
FIGURE 1:

Biochemical analyses of claudin-16 and -19 assembly in HEK293 cells. Triton-soluble cell lysate from singly or doubly transfected claudin-expressing cells was fractionated on 5–20% linear sucrose gradients and blotted with anti–claudin-16 (A) or anti–claudin-19 (B) antibody. (C) Various cross-linkers used to cross-link the claudin oligomer from sucrose fraction 6. (D) Linear SDS–PAGE gel electrophoresis to determine the molecular weight of claudin oligomer and monomer.
The third and fourth transmembrane domains are required for claudin-16 and -19 interaction
Knowing that claudin-16 and -19 form a cis heterodimer on the cell membrane, the next key issue is the deciphering of the interacting domains. AIM is based on the rationale that insertion of an alanine (a residue with high helical propensity but small steric hindrance from its side chain) into a transmembrane helix will displace the residue on the N-terminal side of the insertion by 100° relative to those on the C-terminal side of the insertion, effectively disrupting the helical interaction interface involving residues on both sides of the insertion. If insertion is outside of the critical interface, there will be no detrimental effect. The best examples of using AIM to elucidate dimeric protein structures are the study of glycophorin A (GpA) dimer (Lemmon et al., 1994; MacKenzie et al., 1997) and of permease dimer (Sahin-Toth et al., 1994).
To screen for amino acid loci in transmembrane domains important for claudin-16 and -19 interaction, we generated alanine insertion mutations (+A) along the four transmembrane helices of claudin-16 (Figure 2) and -19 (Figure 3) based on the published crystal structures of claudin-15 (Suzuki et al., 2014) and claudin-19 (Saitoh et al., 2015). The positions of alanine insertion were chosen periodically along each helix at two–amino acid intervals and marked with arrows for each amino acid locus, where insertion was placed to its C-terminal side (Figures 2 and 3A). We then subjected these mutant claudins to a previously established membrane Y2H assay with their wild-type claudin counterpart—for example, claudin-16 mutant with claudin-19 wild type (WT) or vice versa (Hou et al., 2008, 2009). None of the alanine insertion positions in TM1 or TM2 of claudin-16 affected its interaction with claudin-19 (Figure 2B), nor was any position found in TM1 or TM2 of claudin-19 important for its interaction with claudin-16 (Figure 3B). On the other hand, a number of loci in TM3 and TM4 of both claudins were critical for their interaction; insertions at these loci invariably abolished claudin interaction with β-gal reporter activity at only 20% or less of the wild-type interaction level (Figures 2 and 3C; positions labeled with asterisks). These positions appeared periodically at four–amino acid intervals (i → (i + 4)n) for claudin-16 and seven–amino acid intervals (i → (i + 7)n) for claudin-19; both arrangements aligned toward one side of the helix. Such structural arrangement was very similar to the interaction surface found in the GpA dimer, (i → (i + 4)n; MacKenzie et al., 1997) and in the leucine zipper coiled-coil protein interaction, (i → (i + 7)n; Zhou, 2011). From these loss-of-interaction loci, we were able to draw a favorable interaction surface for TM3 and TM4 in claudin-16 and -19. In claudin-16 TM3, the interfacial loci were 193, 200, and 204 (Figure 2A), because insertions at the 192 or 194 locus may both displaced the 193 residue, resulting in similar loss of interaction (Figure 2C). Of note, the 193-200-204 transition is mixed with i → (i + 7) and i → (i + 4). In claudin-16 TM4, the interfacial loci included 236, 240, and 244 in a typical i → (i + 4) format (Figure 2A). Insertion at the 246 locus also abolished interaction (Figure 2C), indicating an additional interfacial residue, 247 with i → (i + 7) transition from 240 (Figure 2A). In claudin-19 TM3, the interfacial loci were 128, 132, and 139 with i → (i + 4) followed by i → (i + 7) transition (Figure 3A), keeping in mind that 139 is the most likely locus because insertions at both 138 and 140 caused loss of interaction (Figure 3C). Two additional residues aligned in parallel—117 and 135—were also included at the interaction face (Figure 3A), based on the observation that insertion at a nearby locus, 118 or 134, abolished interaction (Figure 3C). In claudin-19 TM4, the interfacial loci were 164, 171, and 178 in a typical i → (i + 7) transition (Figure 3A). The 171 locus was deduced from the interaction data of insertion at 170 (Figure 3C). Because insertion at 174 or 176 either diminished or abolished interaction (Figure 3C), we included the 175 residue at the interaction face due to its proximity to these affected loci and continuity with other interfacial loci on the helical wheel (Figure 3A).
FIGURE 2:

Identifying loci in the claudin-16 transmembrane domain important for its interaction with claudin-19. (A) Helical-wheel view of the four TM domains in claudin-16. The positions of alanine insertion are labeled with arrows. (B, C) Effects of alanine insertion into claudin-16 TM domains on the claudin-16 and -19 interaction assayed with the Y2H β-gal reporter gene. The loci with β-gal reporter activity <20% of wild-type interaction level are labeled with asterisks.
FIGURE 3:

Identifying loci in the claudin-19 transmembrane domain important for its interaction with claudin-16. (A) Helical-wheel view of the four TM domains in claudin-19. The positions of alanine insertion are labeled with arrows. (B, C) Effects of alanine insertion into claudin-19 TM domains on the claudin-16 and -19 interaction assayed with the Y2H β-gal reporter gene. The loci with β-gal reporter activity <20% of the wild-type interaction level are labeled with asterisks.
Because the structural arrangement of transmembrane helices may play roles not only in claudin dimerization but also in protein folding and quality control of the endoplasmic reticulum (ER), we verified correct expression of the alanine insertion mutants using the Y2H system (Hou et al., 2008). Each alanine insertion mutant was coexpressed with the yeast ER protein Alg5 in the bait–prey format (see Materials and Methods). If the mutant claudin protein passes ER quality control and is properly inserted into the plasma membrane, coexpression with Alg5 will result in activation of reporter genes due to direct binding of Alg5 with ubiquitin that is fused to the mutant protein. All mutant proteins tested so far showed interaction with Alg5, indicating correct folding and trafficking to the yeast cell membrane (Supplemental Figure S2). Taken together, these data suggest an antiparallel dimerization structure involving transmembrane domains 3 and 4 of claudin-16 and -19.
Loss-of-interaction mutations in claudin-16 and -19 increase the gross junctional resistance
The LLC-PK1 cell expresses claudin-1, -3, -4, and -7, and its background permeability is anion selective (Supplemental Tables S1 and S2), suggesting that its tight junction is aligned with an anion-permeable claudin such as claudin-4 or -7 (Figure 4Ai; Hou et al., 2006). Claudin-19 replaces the background claudin with the less-permeable claudin-19 channel (Figure 4Aii). Claudin-16 creates a cation channel that can be intercalated into the background strand, generating a tight junction that is highly permeable to both cation and anion (Figure 4Aiii). Because of the strong cis interaction, claudin-16, when coexpressed with claudin-19, forms a preferred TJ strand with claudin-19 that now becomes highly permeable to cation but less permeable to anion (Figure 4Aiv). If interaction is required for function, then breakdown of claudin-16 and -19 interaction will abolish the permeability profile in model iv and generate a novel phenotype deriving from additive effects of models ii and iii (Figure 4Av). To test model v directly, we took advantage of the loss-of-interaction mutations in claudin-16 and -19 described elsewhere in this study (Figures 2 and 3).
FIGURE 4:

Effect of claudin interaction on transport function. (A) Cartoon showing models of claudin-16 and -19 polymerization into tight junction strands. (B, C) Dilution potential values (B) and TER values (C) across LLC-PK1 cell monolayers expressing claudin-16 with claudin-19 loss-of-interaction mutations. (D, E) Dilution potential values (D) and TER values (E) across LLC-PK1 cell monolayers expressing claudin-19 with claudin-16 loss-of-interaction mutations.
The loss-of-interaction mutations in claudin-19 were first compared with wild-type claudin-19 to determine whether any mutation affected its endogenous function. Among the 10 mutations, claudin-19-170A showed a complete loss of function (Supplemental Figure S3A and Supplemental Table S1) owing to its trafficking defect to the lysosome (Supplemental Figure S4). Claudin-19-118A, -132A, -138A, -164A, -176A, and -178A caused partial loss of function to variable extents (Supplemental Figure S3A and Supplemental Table S1). Because these mutations were localized normally to the tight junction (Supplemental Figure S4) and did not participate in the extracellular ionic permeation pore, their reduced function can be attributed to their reduced ability to polymerize into a homomeric TJ strand (Figure 4Aii). If the third and fourth TM domains are important for claudin-16 and -19 interaction, it will be rational to extend such antiparallel arrangement to all claudin interactions, both homomeric and heteromeric. The remaining three mutations—claudin-19-128A, -134A, and -140A—retained normal function and localization (Supplemental Figure S3A and Supplemental Table S1). Knowing that claudin-19 and -16 worked together to generate maximal cation selectivity (Figure 4Aiv), we asked whether disruption of their interaction would abolish such cation selectivity. Except for the 170A mutation with trafficking defect, the nine loss-of-interaction mutations in claudin-19 were coexpressed with wild-type claudin-16 in LLC-PK1 cells. The dilution potential (PD) in cells coexpressing mutant claudin-19 and wild-type claudin-16 was significantly lower than that in wild-type claudin-19 and -16 coexpression (Figure 4B and Supplemental Table S1). Of note, the TER was significantly higher in all of the mutants tested (Figure 4C and Supplemental Table S1). The increase in TER was caused by a profound decrease in the absolute permeability of Na+ (PNa; Supplemental Table S1), which was somewhat surprising because of the presence of the wild-type form of claudin-16. These data suggest that claudin-16 is not aligned with claudin-19 in parallel as in Figure 4Aiv, due to the lack of cis interaction. Instead, claudin-16 and -19 must be separated into two different strands and arranged in serial (Figure 4Av). Because claudin-16 is impermeable to anions, whereas claudin-19 impermeable to cations, sequential alignment will impede the passage of both cations and anions, increasing the gross junctional resistance.
The loss-of-interaction mutations in claudin-16 were also studied individually (Supplemental Figure S3B) or when coexpressed with wild-type claudin-19 (Figure 4, D and E). Among the eight mutations, claudin-16-194A, -236A, and -240A were complete loss-of-function mutations (Supplemental Figure S3B and Supplemental Table S2), owing to their trafficking defect to the ER (Supplemental Figure S4). The remaining five mutations—claudin-16-192A, -200A, -204A, -244A, and -246A—retained normal localization (Supplemental Figure S4) and partial transport function of claudin-16 (Supplemental Figure S3B and Supplemental Table S2). Coexpressing these claudin-16 mutants with claudin-19 not only reduced the PD and cation selectivity (Figure 4D and Supplemental Table S2), but it also increased TER (Figure 4E and Supplemental Table S2). Of note, the PNa in coexpressing cells was significantly lower than that in cells expressing the same claudin-16 mutant alone (Supplemental Table S2), further supporting model v in Figure 4A. Taken together, these results suggest that the overall tight junction permeabilities are determined not only by individual claudin permeability, but also by claudin cis interaction.
Loss-of-interaction mutations in claudin-16 and -19 increase TJ strand number and complexity
To reveal the underlying ultrastructural changes in tight junctions, we performed freeze-fracture electron microscopy (FF-EM) on LLC-PK1 cells expressing claudin-16 or -19 or their mutants, individually or in combination. The LLC-PK1 cell background TJ was seen as continuous parallel strands preferably associated with the P face of the replica (Figure 5A). Adding claudin-16 did not change the overall morphology of the TJ strands but clearly increased the complexity of the TJ by developing not only parallel strands but also vertical strands (Figure 5B). Adding claudin-19 dramatically altered TJ morphology and strand number (Figure 5C), compatible with the model in which claudin-19 replaces the background claudin (Figure 4Aii). Moreover, complementary claudin-19 fibrils and grooves were continuous on the replica (Figure 5C), indicating that claudin-19 makes a strong trans interaction between neighboring cells. In LLC-PK1 cells coexpressing claudin-16 and -19, the TJ strands were morphologically similar to those in cells expressing claudin-19 alone (Figure 5D), which is compatible with our previous observation that claudin-16 cis interacts and copolymerizes with claudin-19 into the tight junction (Hou et al., 2008). The most telling discovery was in LLC-PK1 cells coexpressing the interaction-incompetent claudin-16 and -19 pair. Coexpression of wild-type claudin-19 with the loss-of-interaction mutant in claudin-16 (246A; Figure 5E) or wild-type claudin-16 with the loss-of-interaction mutant in claudin-19 (178A; Figure 5F) invariably increased TJ strand number and complexity compared with either the LLC-PK1 cell background (Figure 5A) or coexpression of wild-type claudin-16 and -19 (Figure 5D), whereas singly expressed mutant claudin-16 (246A) or claudin-19 (178A) generated a TJ pattern similar to that of its wild-type species (Figure 5, B and C). To quantitatively document the TJ ultrastructural changes, we defined two criteria, the strand number index (SNI) and the strand complexity index (SCI), as follows. 1) The linear TJ strands in each replica were divided into 100-nm strand units longitudinally; 2) the strands (both parallel and vertical) in each unit were counted; 3) the strand intersections in each unit were counted—0 for two parallel strands, 1 for intersection once, 2 for intersection twice, and so on; 4) the SNI was defined as the sum of strand numbers in all units divided by the number of units; and 5) the SCI was defined as the sum of strand intersections in all units divided by the number of units. On the basis of these criteria, we calculated the SNI (Figure 5G) and the SCI (Figure 5H) for tight junctions made of claudin-16 or -19 or their mutants. Adding claudin-16 to LLC-PK1 cells increased SCI (p < 0.05, n = 7–9 replicas; Figure 5H) but not SNI (Figure 5G), whereas adding claudin-19 significantly increased SNI but not SCI (Figure 5, G and H). Because of the strong cis interaction, SNI and SCI of TJ strands made of claudin-16 and -19 coexpression were not different from those of claudin-19 strands (Figure 5, G and H). Disruption of the claudin-16/-19 interaction profoundly increased the SCI and to a lesser extent the SNI (p < 0.05, n = 7–9 replicas; Figure 5, G and H) compared with the wild-type claudin-16/-19 tight junction. Biochemical experiments using sucrose gradient centrifugation and chemical cross-linking approaches further confirmed that neither the claudin-16 mutant (246A) nor the claudin-19 mutant (178A) retained the ability to form a stable heterodimer with its wild-type counterpart (Supplemental Figure S5). This finding was compatible with the model in Figure 4Av in which claudin-16 and -19 are separated into two different ultrastructures, leading to significant increases in TER (Figure 4, C and E). Taken together, these results indicate that the tight junction ultrastructures were determined not only by claudin species but also by claudin interactions.
FIGURE 5:

Freeze-fracture images of claudin-transfected LLC-PK1 cells. Freeze-fracture electron microscopy revealed TJ ultrastructures in LLC-PK1 cells with no transfection (A) or LLC-PK1 cells transfected with claudin-16 (B), claudin-19 (C), claudin-16 and -19 (D), claudin-16-246A mutant with claudin-19 (E), or claudin-16 with claudin-19-178A mutant (F). Bar, 100 nm. Quantitative image analyses revealed TJ strand difference (G) and TJ complexity difference (H) among these LLC-PK1 cells transfected with claudin-16, -19, or their mutants. *p < 0.05, n = 7–9.
High-resolution recording of claudin-16 and -19 conductance with SICM
Previous macroscopic recordings of tight junction conductance reflect aggregates of thousands, or even millions, of channel conductance, with current density reaching microamperes per square centimeter. Clearly, these measurements lack resolution on the molecular level. Unlike the transcellular channel, which can be recorded in a patch of membrane with a patch clamp, the paracellular channel is located across the cell–cell boundary, precluding the formation of a gigaohm seal between the pipette and the membrane. To overcome this technical hurdle, we developed a novel tool based on SICM (Hansma et al., 1989) to record the claudin-2 channel in Madin–Darby canine kidney (MDCK) cells with conductance resolution reaching picoamperes and spatial resolution reaching nanometers (Chen et al., 2013; Zhou et al., 2013). We term this tool potentiometric-scanning ion conductance microscopy (P-SICM). P-SICM uses a “virtual seal” to monitor the access resistance (Raccess) of the gap between the nanopipette and surface (Dps; Figure 6A) to draw a topographic image of the apical surface of a cell monolayer, which can then be used to locate the position of the tight junction (Figure 6B). The circuit from pipette electrode (PE) to reference electrode (RE) based upon monitoring Raccess can also be used to position the pipette at a fixed distance above the surface (maintaining constant Dps; Figure 6C, PE-RE circuit). A second circuit from potential electrode (UE) to reference electrode (RE) analyzes the conductance of a permeating pore (Rpore) within the tight junction driven by transepithelial potential differences from −50 to +50 mV at the frequency of 5 Hz (Figure 6C, UE-WE circuit). To study selective interaction between different claudin species, we generated LLC-PK1 cells expressing claudin-16 or -19 with concomitant expression of a fluorescent marker protein by using an internal ribosome entry site (Figure 6D). Under the coculture condition (CC) with individually expressed claudin-16 or -19, three types of tight junction can be differentiated according to live-cell fluorescence microscopy (coupled with the SICM module to allow simultaneous imaging and recording): claudin-16/-16 (between green cells), claudin-19/-19 (between red cells), and claudin-16/-19 (between green and red cells; Figure 6D). Under the coexpression condition (CE) with doubly expressed claudin-16 and -19, only one type of tight junction made from doubly expressed cells was recorded (between yellow cells; Figure 6D). When expressed in vitro individually or in combination, claudin-16 and -19 proteins were found in the tight junction of transfected cells (Hou et al., 2005, 2008).
FIGURE 6:

SICM recording of claudin-16 and -19 conductance. (A) Schematic of P-SICM. A dual-barrel pipette is used to obtain topographic information and measure local changes in transepithelial conductance related to transcellular or paracellular pathways. CE, counterelectrode; Dps, probe–substrate distance; PE, pipette electrode; RE, reference electrode; UE, potential electrode; WE, working electrode. (B) Topographic image (40 × 40 μm) of the apical surface of the LLC-PK1 cell monolayer was imaged to locate the positions of cell bodies (CBs) and cell junctions (CJs). The black dot in the center of the larger white circle at these positions approximates the size of the pipette tip used. (C) Electric circuit used to monitor and access resistance (PE-RE) and analyze pore resistance (UE-WE). (D) Fluorescence images of LLC-PK1 claudin-16 and -19 coculture and coexpression cells. Bar, 15 μm. (E) Histograms of conductance measurements obtained over CBs (hatched) and CJs (solid) on claudin-16 cell monolayers (left) and claudin-19 cell monolayers (right). These distributions indicate a much higher conductance on cells with claudin-16 expression than claudin-19 expression. (F) Statistical graph of tight junction conductance in claudin-16, -19, coculture, and coexpression cells compared with wild-type cells measured in Ringer’s solution and ion replacement solutions. Mean ± SD. N > 30. (G) Statistical graph of tight junction ion selectivity in claudin-16, -19, coculture, and coexpression cells compared with wild-type cells. Mean ± SD. N > 30. (H) Summary of tight junction ion selectivity and absolute permeability to Na+ (PNa) and Cl− (PCl) in claudin-16, -19, coculture, coexpression, and wild-type cells. Mean ± SD. N > 30.
The conductance over cell junctions (CJs; paracellular) and cell bodies (CBs, transcellular) of claudin-16–expressing cells displayed Gaussian distributions and had averages of 44.5 ± 2.4 mS/cm2 (n = 55, mean ± SD, p = 0.11) and 19.8 ± 1.0 mS/cm2 (n = 52, p = 0.83), respectively (Figure 6E). The conductance over claudin-19 TJs and CBs was also normally distributed, with averages of 4.2 ± 0.18 mS/cm2 (n = 59, p = 0.59) and 2.4 ± 0.13 mS/cm2 (n = 44, p = 0.18), respectively (Figure 6E). The TJ conductance of heterotypic claudin-16 and -19 junction in CC cells was similar to that of heteromeric junction in CE cells (Figure 6F), but the ion selectivity (PNa/PCl) was vastly different between CC and CE (Figure 6G). In fact, the absolute permeabilities for Na+ (PNa) and Cl− (PCl) in CC cells remained unchanged from those in wild-type LLC-PK1 cells (Figure 6H), suggesting that no channel can be made between claudin-16 and -19 through trans interaction. Claudin-16 alone increased the TJ conductance, whereas claudin-19 itself decreased the TJ conductance (Figure 6F), compatible with previous macroscopic recordings. Both claudin-16 and -19 favored cation selectivity (Figure 6G), consistent with the concept that claudin-16 created a cation channel, whereas claudin-19 limited anion permeation. Of note, PNa in the claudin-16/-16 junction was around twofold higher than that in the CE junction; PCl in claudin-19/-19 function was about twofold lower than in CE (Figure 6H). These data suggest that the channel density in the claudin-16 or -19 homogeneous junction is twofold higher than that in the CE heterogeneous junction, consistent with model iv in Figure 4A in which claudin-16 and -19 is linearly arranged along the TJ strand in CE cells through cis association. The ion selectivity estimated with SICM (Figure 6H) is markedly higher for claudin-16 but lower for claudin-19 than with the traditional Ussing chamber approach (Supplemental Table S1). The difference could be due to signal gain in the recording of claudin-16 but signal loss in the recording of claudin-19, because our SICM configuration is more sensitive toward increases in conductance. Despite the fact that claudin-16 primarily handled cations, whereas while claudin-19 handled anions, the counterion conductance in claudin-16 and -19 channels was also markedly affected (Figure 6H). Such effects were more pronounced in SICM recording than with the macroscopic approach (see earlier discussion). The difference could be caused by the contaminating transcellular conductance, which was not easy to exclude through the use of ouabain in Ussing chambers but was well separated by SICM from the paracellular conductance. Such claudin-induced transcellular conductance was noticed by Gunzel et al. (2009) in the discovery of the claudin-16–stimulated membrane Cl− channel. Taken together, these results show the bona fide paracellular conductance made up of selective claudin–claudin interactions.
DISCUSSION
Many previous attempts had been made to elucidate the oligomeric nature of claudins. Mitic et al. (2003) first revealed a claudin-4 hexamer from Sf9 cell membranes solubilized with perfluoro-octanoic acid (PFO) detergent and separated using a native gel system (PFO-PAGE). This claudin hexamer was later found to be an artifact when a different detergent, dodecyl maltoside (DDM), was used (Van Itallie et al., 2011). With the native gel system based on Coomassie blue G250 (blue native PAGE), Van Itallie et al. (2011) demonstrated that claudin-2 instead of claudin-4 (rather as a monomer) adopted a dimeric form from several cell membranes dissolved with DDM. Nevertheless, the use of mild neutral detergents and the native gel system cast doubt on the stability of such a claudin-2 dimer. The claudin-16 and -19 dimer is much more stable than the claudin-2 counterpart; its purification can be achieved with Triton X-100 solubilization and a linear sucrose gradient. Of note, the claudin-16/-19 monomer and dimer were recovered from the 8 and 14% sucrose fractions, which was consistent with the sedimentation pattern of claudin-4 in the Sf9 cell (Mitic et al., 2003) but different from that of occludin in the polarized intestinal epithelial cell T84 (Nusrat et al., 2000). In native T84 epithelia, the occludin sedimentation rate appeared to be higher for the 22% fraction, keeping in mind that the tight junction interactome may influence this assay and complicate its interpretation. The dimerization of claudin-16 and -19 relied on their cis but not trans interaction. Disruption of the claudin-16 and -19 cis interaction will break their coassembly into tight junction strands. Because the homotypic trans interaction of claudin-16 or -19 still exists, they will assemble into different strands by themselves or through preferable cis interactions with other claudins present in the cell. Clearly, the more incompatible claudins there are in the tight junction, the more complex the TJ strands will become and the higher will be the transepithelial resistance, as evidenced by freeze-fracture EM and electrophysiological recordings. This principle also relates to many previous observations that adding an ectopic claudin into different epithelia can generate different phenotypes, largely owing to the unknown background of endogenous claudins and their interaction ability with the added claudin. From a therapeutic point of view, this principle can be used to create unique paracellular permeabilities in various epithelia based on existing knowledge of claudin cis and trans interactions. The claudin trans interaction was previously considered to play a structural role through ECL2 to bring neighboring cells into contact (Piontek et al., 2008). Because ECL2 was not involved in claudin transport function, it was assumed that trans interaction only anchored claudins into the tight junction. Our functional study indicates otherwise. The heterotypic channel made up of claudin-16 and -19 in cocultured cells had no conductance despite the fact that both claudins are stably integrated into the tight junction. These data also suggest that claudins cannot function as a hemichannel; normal function requires intercellular compatibility, which likely involves both extracellular loops.
Because of the spatial orientation of the paracellular channels, traditional techniques such as patch-clamp studies are not effective to achieve high-resolution recording due to the leaky currents through cell–cell boundaries. The concept of “ion scanning” is ideal for studying paracellular conductance based on the following rationale: 1) SICM is an improvement over “loose patch clamp” in that it provides precise control of pipettete-to-surface distance (Dps), which causes primary system error in signal gain or loss; 2) by controlling the pipette diameter and Dps, the spatial resolution of SICM can be predefined using nanopores (Chen and Baker, 2011; Zhou et al., 2012); and 3) the precise location of apical cellular structures such as tight junctions and microvilli can be acquired and pinpointed during recording with the SICM topology mode (Chen et al., 2012). We demonstrated the feasibility of using SICM to record the paracellular conductance of the claudin-2 channel with submicrometer resolution (nominal radius of 265 nm) in MDCK cells (Chen et al., 2013). Because of the high spatial resolution, SICM makes it possible to isolate conductance signals from a discrete number of paracellular channels. This feature has made it possible for the first time to resolve the relationship of channel conductance to density in claudin-16 or -19 homomeric versus heteromeric junctions. A major limitation of our approach is the lack of quantitative data on claudin molecular density along the tight junction strand. Using conventional fluorescence microscopy, Kaufmann et al. (2012) estimated the on-strand claudin-3 and -5 molecular density to be ∼4000/μm2. If claudin-16 and -19 on-strand molecular density is similar to that of claudin-3 and -5, then each SICM signal represents a sum of ∼800 channel conductances. The claudin molecular density in tight junctions is primarily regulated by two processes: insertion of newly synthesized protein, and endocytosis of existing protein. By studying claudin interaction with the ER protein Alg5 and its subcellular localization, we found that the majority of the alanine insertion mutations passed ER quality control and trafficked to the tight junction. Only one mutation in claudin-19 (170A) was found in the lysosome, suggesting increased endocytosis. Because each claudin mutant protein was delivered to cells using an overexpression method, variation in transgene transcription or translation would less likely cause differences in tight junction function, keeping in mind that ectopically expressed claudin became highly abundant intracellularly. The intracellular pool of claudin molecules serves as reservoir to maintain their constant density within the TJ strands (Shen et al., 2008).
On the basis of the results in this study, we propose a novel model for claudin polymerization (Supplemental Figure S6A). Claudin-16 and -19 cis associate as antiparallel dimers on neighboring cell membranes; trans association occurs between ECL1 and ECL2 contributed by the claudin molecules of the same identity on two neighboring cells. Further trans association concatenates claudin dimers on opposing cell membranes into linear polymers. In this model, no additional interaction involving molecules such as ZO-1 is required. With the published claudin-15 crystal structure (Suzuki et al., 2014), we modeled the claudin ion permeation pore based on the aforementioned polymerization rule. In Supplemental Figure S6B, claudin molecules 1 and 2 form the antiparallel cis dimer, and claudin molecules 3 and 4 trans associate with 2 and 1, respectively. Of note, there is no cis interaction between claudin molecules 3 and 4. Ion permeation pores are arranged between opposing claudin pair 1 and 4 and pair 2 and 3. According to mutagenic studies of claudin-2 (Yu et al., 2009), claudin-16 (Hou et al., 2005), and claudin-19 (Hou et al., 2008), the residues important for ion permeability are located in the fourth β-sheet of ECL1 (Supplemental Figure S6B, arrow). In this model, the ECL1 β4 domains of each channel-making claudin pair face the same direction. This arrangement establishes the symmetry of charges within the channel pore that are important for Brownian dynamics modeling of claudin-2 (Yu et al., 2009). Because the ion permeation pores are arranged independently and in parallel, this model explains the observation that different ions can be handled by the tight junction simultaneously—for example, Na+ and Cl− in the case of claudin-16 and -19. Of note, our model of claudin assembly is similar to that proposed by Rossa et al. (2014) for claudin-5, which showed cis dimeric arrangements through the third transmembrane domain, and is compatible with the model proposed by Suzuki et al. (2015) for claudin-15, which supported a cis dimeric structure through interactions of the ECL1 β4 domain. Suzuki et al. (2015) mutated several amino acid residues in the ECL1 β4 domain to cysteine and demonstrated that these cysteine mutants formed dimers under oxidative conditions. Nevertheless, these data only confirmed the close proximity of the two ECL1 β4 domains but not their direct interaction. In fact, our model not only predicts an identical ECL1 β4 arrangement (Supplemental Figure S6B, arrows for molecules 3 and 4) to that of Suzuki and colleagues, but it also states that the two ECL1 β4 domains are brought into close proximity through the underlying transmembrane domain interactions.
MATERIALS AND METHODS
Reagents, antibodies, and cell lines
The following antibodies were used in this study: rabbit polyclonal anti-CLDN16 (against SYSAPRTETAKMYAVDTRV); rabbit polyclonal anti-CLDN19 (against NSIPQPYRSGPSTAAREYV); fluorescein isothiocyanate–labeled goat anti-rabbit immunoglobulin G (IgG) and rhodamine-labeled goat anti-mouse IgG (Millipore, Billerica, MA); and horseradish peroxidase (HRP)–labeled donkey anti-rabbit and anti-mouse IgG (GE Life Sciences, Pittsburgh, PA). Mouse L cells (from the American Type Culture Collection [ATCC], Manassas, VA), canine MDCK cells (from ATCC), porcine LLC-PK1 cells (from ATCC), and human HEK293 cells (from Joan Brugge, Harvard Medical School, Boston, MA) were cultured in DMEM (Invitrogen, Carlsbad, CA) supplemented with 10% fetal bovine serum (FBS), penicillin/streptomycin, and 1 mM sodium pyruvate. Insect Sf9 cells (from Invitrogen) were cultured in Grace’s Insect Medium supplemented with TC Yeastolate, lactalbumin hydrolysate, l-glutamine, 10% FBS, and penicillin/streptomycin (Invitrogen).
Molecular cloning and retrovirus production
The following full-length mammalian claudins were cloned into the retroviral vector pQCXIN (gift from Joan Brugge): human CLDN16 (GenBank accession no. AF152101) and human CLDN19 (GenBank accession no. BC030524). The site-directed mutagenesis was performed with a PCR-based mutagenesis method (Agilent Technologies, Santa Clara, CA). Molecular clones for each of the mutants were verified by DNA sequencing. Vesicular stomatitis virus-G–pseudotyped retroviruses were produced in HEK293 cells and used to infect LLC-PK1 cells at a titer of 1 × 10⁶ cfu/ml, as described previously (Hou et al., 2008). Doubly expressed cells were made through sequential infections with single claudin retrovirus.
Baculovirus production
The full-length human CLDN16 and CLDN19 were cloned into the baculoviral vectors pFastBac and pFastBac dual for single and double expression, respectively. The transgene was integrated into the baculovirus backbone through homologous recombination according to the Bac-to-Bac Baculovirus Expression Manual (Invitrogen). P1 and P2 baculoviruses were harvested in Sf9 cell supernatant, purified with centrifugation, and used to infect Sf9 cells at the titer of 1 × 10⁸ pfu/ml. Correct claudin expression and localization were verified with Western blot and immunofluorescence imaging, respectively.
Protein solubilization, electrophoresis, and immunoblotting
Subconfluent cells (to minimize claudin trans interaction) were dissolved in lysis buffer (50 mM Tris-HCl, pH 7.5, 150 mM NaCl, 1% Triton X-100, and protease inhibitor cocktail [ThermoFisher Scientific, Waltham, MA]). After shearing with a 23-gauge needle, lysates (containing 20 μg of total protein) were subjected to 5–20% linear sucrose gradient sedimentation at 100,000 × g overnight, followed by SDS–PAGE of each fraction under denaturing conditions and transference to nitrocellulose membrane, blocking with 3% nonfat milk, incubation with primary antibodies (diluted 1:1000) and HRP-labeled secondary antibody (diluted 1:5000), and exposure to an ECL Hyperfilm (GE Life Sciences). Molecular mass was determined relative to protein markers (Bio-Rad, Hercules, CA).
Immunolabeling and confocal microscopy
Cells grown on coverslips were fixed with 4% paraformaldehyde in 0.1 M phosphate-buffered saline (PBS); cells grown on Transwell inserts (Corning, Corning, NY) were fixed with cold methanol at −20°C, followed by blocking with PBS containing 10% FBS and incubation with primary antibodies (diluted 1:300) and fluorescein isothiocyanate– or rhodamine-labeled secondary antibodies (diluted 1:200). After being washed with PBS, slides were mounted with Mowiol (Millipore). Confocal analyses were performed using the Nikon TE2000 confocal microscopy system equipped with Plan-Neofluar ×40 (numerical aperture [NA] 1.3 oil) and ×63 (NA 1.4 oil) objectives and krypton-argon laser (488- and 543-nm lines). Epifluorescence images were taken with a Nikon 80i photomicroscope equipped with a DS-Qi1Mc digital camera. All images were converted to TIFF format and arranged using Photoshop CS4 (Adobe, San Jose, CA).
Freeze-fracture electron microscopy
Confluent monolayers of LLC-PK1 cells individually expressing or coexpressing CLDN16, CLDN19, or their mutants were cultured on Sapphire disks, fixed in 2% glutaraldehyde in Dulbecco PBS (DPBS) for 20 min at 4°C, rinsed twice in DPBS, infiltrated with 10, 20, and 25% glycerol in 0.1 M cacodylate buffer, pH 7.3, over 1 h at 4°C, rapidly frozen in liquid helium, and freeze fractured at −115°C in a Balzers 400 freeze-fracture unit. After cleaning with sodium hypochlorite, replicas were examined by electron microscopy at a magnification of ×62,500.
Y2H membrane protein interaction assay
A Y2H membrane protein interaction assay (MoBiTec Molecular Biotechnology, Goettingen, Germany) was used for analyzing the specific interactions among CLDN16, CLDN19, and their mutants. The DNA fragments were amplified using PCR and cloned into the vectors pBT3-C and pBT3-N, such that they were in-frame with the Cub-TF cassette placed downstream and upstream, respectively (for bait vectors with Cub fusion), and similarly into the vectors pPR3-C and pPR3-N (for prey vectors with Nub fusion). The assay was performed by transforming the yeast strain NMY51. The correct expression of the bait and prey vectors for CLDN16, CLDN19, and their mutants was verified by Western blot using LexA mouse monoclonal antibody (Santa Cruz Biotechnology, Dallas, TX). Verification of correct topology of all the baits was performed using pAI-Alg5 and pDL2-Alg5 control preys, and the upper limit of selection stringency of the baits was determined using selective triple-dropout medium lacking leucine, tryptophan, histidine, and adenine (SD-LWHA). Transformed yeast cells were plated on selective dropout media lacking leucine and tryptophan and incubated for growth of positive transformants. Three to six independent positive transformants were selected and resuspended in 50 ml of 0.9% NaCl buffer and spotted on SD-LWHA medium. Growth of colonies on the selective medium was scored as positive for interaction. To further verify the positive interactions, β-galactosidase activity was performed following the manufacturer’s protocols (MoBiTec). Quantitative measurements of β-galactosidase activity was performed by lysing 1 ml of 2 OD units each of the overnight culture with 0.05 M Tris, 1% SDS (pH 8.8), and ∼100 μl of acid-washed glass beads (Sigma-Aldrich, St. Louis, MO), followed by three freeze–thaw cycles in liquid nitrogen. The lysate was incubated for 30 min with 10 μl of 10% X-Gal (Carl Roth, Karlsruhe, Germany). Color development was measured using a spectrophotometer and scored as an indicator of the strength of the interaction. Blank measurements were performed with untransformed yeast cells.
Electrophysiological measurements
Electrophysiological recordings were performed on epithelial monolayers in an Ussing chamber (U9926/T; Harvard Apparatus, Holliston, MA) that had been modified to adapt Transwells (Hou et al., 2005, 2008). Voltage and current clamps were performed using the EC-800 epithelial amplifier (Warner Instruments, Hamden, CT) with Ag/AgCl electrodes and an Agarose bridge containing 3 M KCl. The TER was measured under the Resistance mode by passing a constant bipolar current pulse (Io) of 10 μA (<2 kΩ) or 1 μA (> 2 kΩ) through the epithelium and recording voltage deflection (Vo). Ohm’s law was used to calculate TER from Vo and Io. The series resistance (Rs) was measured in absence of the epithelium and subtracted from TER. Dilution potentials (PDs) were measured under the Current Clamp mode by clamping the transepithelial current to zero and recording the equilibrium voltage generated by NaCl diffusion. All experiments were conducted at 37°C. Electrical potentials obtained from blank inserts were subtracted from those obtained from inserts with epithelial monolayers. Ouabain at 1 mM was included in the basolateral perfusant to inhibit transcellular ion conductance. The ion permeability ratio (η) for the monolayer was calculated from the dilution potential using the Goldman–Hodgkin–Katz equation:
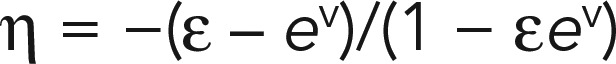 |
where η is the ratio of the permeability of the monolayer to Na+ over the permeability to Cl− (η = PNa/PCl), e is the dilution factor (e = Cbasal/Capical), ν = eV/kT (V is the dilution potential, k is the Boltzmann constant, e is the elementary charge, and T is the Kelvin temperature). The absolute permeabilities of Na+ (PNa) and Cl− (PCl) were calculated by using the Kimizuka–Koketsu equation:
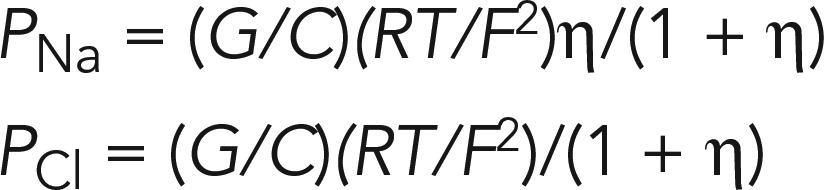 |
where C is the concentration, R is the gas constant, and F is the Faraday constant.
Scanning ion conductance microscopy measurements
A modified ScanIC scanning ion conductance microscope (Ionscope, London, United Kingdom) was used as described before (Chen et al., 2013), with specimens of interest mounted between two chambers of a conductivity cell and a double-barreled theta pipette used as the scanning probe (Figure 6A). One barrel of the pipette contained the pipette electrode (PE), which served to position the probe; the second barrel contained the potential electrode (UE) connected to a differential amplifier (a high-impedance operational amplifier considered to have zero current) to detect localized potential changes with respect to the reference electrode (RE) placed in the bath solution. A Pt counterelectrode (CE) placed in the apical chamber was connected to a CE driver for generating transmembrane countercurrent to prevent fluctuations in the potential of the RE. Potential variations across a permeable membrane were induced by the application of transmembrane potentials (VTM) at the working electrode (WE) that swept from −50 to +50 mV at the frequency of 1 Hz in the form of a triangle wave. To record conductance, potential deflections recorded at the UE were measured at a fixed probe-to-surface distance (Dps) of 0.2 μm and then referenced to the background response measured far from the surface (Dps = 12.5 μm). The local conductance (G) was calculated from the equation (Cereijido et al., 1980; Gitter et al., 1997)
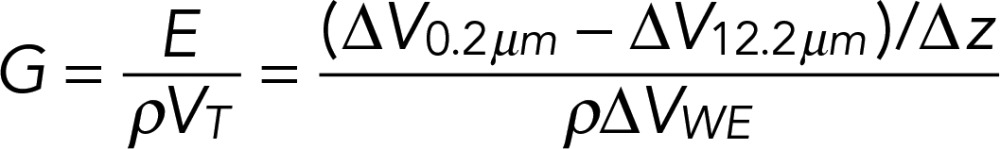 |
in which the electric field (E) was determined by dividing the potential difference (ΔV0.2μm − ΔV12.5μm) recorded at two distinct pipette distances (Dps) by the vertical displacement of the pipette (Δz); ρ is the specific resistance of the recording solution, and VT is the potential range applied at the WE to induce potential deflections (VT = 100 mV, swept from − 50 to +50 mV).
Localized conductance was first measured for cell monolayers with both apical and basolateral sides filled with Ringer’s buffer, buffer A (137 mM NaCl, 5 mM KCl, 1 mM MgCl2, 2 mM CaCl2, 8 mM mannitol, and 10 mM 4-(2-hydroxyethyl)-1-piperazineethanesulfonic acid [HEPES], pH 7.0). Cation-selective conductance was measured with buffer A on the basolateral side replaced with buffer B (5 mM NaCl, 132 mM N-methyl-d-glucamine chloride [NMDG⋅Cl], 5 mM KCl, 1 mM MgCl2, 2 mM CaCl2, 8 mM mannitol, and 10 mM HEPES, pH 7.0). In buffer B, Na+ was reduced to 5 mM by isomolar replacement of 132 mM NaCl with NMDG⋅Cl). Anion-selective conductance was measured with buffer A on the basolateral side replaced with buffer C (137 mM NaGlu, 5 mM KCl, 1 mM MgGlu, 2 mM CaGlu, 8 mM mannitol, and 10 mM HEPES, pH 7.0), in which the Cl− concentration was reduced to 5 mM via replacement with gluconate (Glu−). Both NMDG+ and Glu− are considered as impermeable ions to both transcellular and paracellular pathways (Papini et al., 1998; Broughman et al., 2004). Ion-selective permeability (P) was calculated from its conductance (G) from the equation (Hille, 2001)
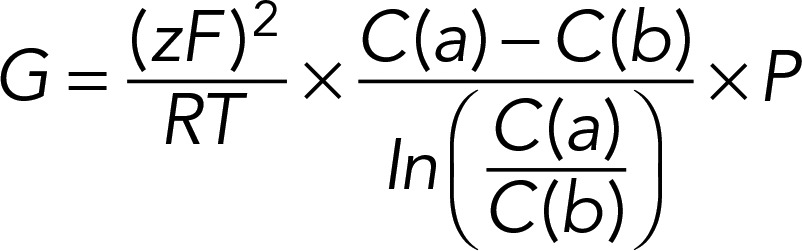 |
in which R is the gas constant, F is the Faraday constant, T is the Kelvin temperature, z is the charge valence, C(a) is the apical concentration, and C(b) is the basal concentration.
Statistical analyses
The significance of differences between groups was tested by analysis of variance (Statistica 6.0; Statsoft, Tulsa, OK). When the all-effects F value was significant (p < 0.05), post hoc analysis of differences between individual groups was made with the Newman–Keuls test. Values were expressed as mean ± SEM, unless otherwise stated. The Shapiro–Wilk test was performed for normal distributions, p > 0.05.
Supplementary Material
Acknowledgments
We thank Joan Brugge for kindly sharing reagents and cells. We also thank the Hope Imaging Centre of Washington University Medical School for its excellent assistance with confocal microscopy. This work was supported by National Institutes of Health Grants RO1DK084059 and P30 DK079333 (to J.H.), American Heart Association Grant 0930050N (to J.H.), and National Institutes of Health Grant R21DK082990 (to L.A.B.).
Abbreviations used:
- AIM
alanine-insertion mutagenesis
- DDM
dodecyl maltoside
- ECL
extracellular loop
- ER
endoplasmic reticulum
- FF-EM
freeze-fracture electron microscopy
- FHHNC
familial hypomagnesemia with hypercalciuria and nephrocalcinosis
- MDCK
Madin-Darby canine kidney cell
- PD
dilution potential
- PFO
perfluoro-octanoic acid
- SCI
strand complexity index
- SICM
scanning ion conductance microscopy
- SNI
strand number index
- TER
transepithelial resistance
- TJ
tight junction
- TM
transmembrane domain
- WT
wild type
- Y2H
yeast two-hybrid assay
Footnotes
This article was published online ahead of print in MBoC in Press (http://www.molbiolcell.org/cgi/doi/10.1091/mbc.E15-06-0422) on October 7, 2015.
REFERENCES
- Ben-Yosef T, Belyantseva IA, Saunders TL, Hughes ED, Kawamoto K, Van Itallie CM, Beyer LA, Halsey K, Gardner DJ, Wilcox ER, et al. Claudin 14 knockout mice, a model for autosomal recessive deafness DFNB29, are deaf due to cochlear hair cell degeneration. Hum Mol Genet. 2003;12:2049–2061. doi: 10.1093/hmg/ddg210. [DOI] [PubMed] [Google Scholar]
- Broughman JR, Brandt RM, Hastings C, Iwamoto T, Tomich JM, Schultz BD. Channel-forming peptide modulates transepithelial electrical conductance and solute permeability. Am J Physiol Cell Physiol. 2004;286:C1312–C1323. doi: 10.1152/ajpcell.00426.2002. [DOI] [PubMed] [Google Scholar]
- Cereijido M, Stefani E, Palomo AM. Occluding junctions in a cultured transporting epithelium: structural and functional heterogeneity. J Membrane Biol. 1980;53:19–32. doi: 10.1007/BF01871169. [DOI] [PubMed] [Google Scholar]
- Chen CC, Baker LA. Effects of pipette modulation and imaging distances on ion currents measured with scanning ion conductance microscopy (SICM) Analyst. 2011;136:90–97. doi: 10.1039/c0an00604a. [DOI] [PubMed] [Google Scholar]
- Chen CC, Zhou Y, Baker LA. Scanning ion conductance microscopy. Annu Rev Anal Chem. 2012;5:207–228. doi: 10.1146/annurev-anchem-062011-143203. [DOI] [PubMed] [Google Scholar]
- Chen CC, Zhou Y, Morris CA, Hou J, Baker LA. Scanning ion conductance microscopy measurement of paracellular channel conductance in tight junctions. Anal Chem. 2013;85:3621–3628. doi: 10.1021/ac303441n. [DOI] [PMC free article] [PubMed] [Google Scholar]
- Farquhar MG, Palade GE. Junctional complexes in various epithelia. J Cell Biol. 1963;17:375–412. doi: 10.1083/jcb.17.2.375. [DOI] [PMC free article] [PubMed] [Google Scholar]
- Furuse M, Sasaki H, Tsukita S. Manner of interaction of heterogeneous claudin species within and between tight junction strands. J Cell Biol. 1999;147:891–903. doi: 10.1083/jcb.147.4.891. [DOI] [PMC free article] [PubMed] [Google Scholar]
- Gitter AH, Bertog M, Schulzke J, Fromm M. Measurement of paracellular epithelial conductivity by conductance scanning. Pflugers Arch. 1997;434:830–840. doi: 10.1007/s004240050472. [DOI] [PubMed] [Google Scholar]
- Goodenough DA, Revel JP. A fine structural analysis of intercellular junctions in the mouse liver. J Cell Biol. 1970;45:272–290. doi: 10.1083/jcb.45.2.272. [DOI] [PMC free article] [PubMed] [Google Scholar]
- Gow A, Southwood CM, Li JS, Pariali M, Riordan GP, Brodie SE, Danias J, Bronstein JM, Kachar B, Lazzarini RA. CNS myelin and sertoli cell tight junction strands are absent in Osp/claudin-11 null mice. Cell. 1999;99:649–659. doi: 10.1016/s0092-8674(00)81553-6. [DOI] [PubMed] [Google Scholar]
- Gunzel D, Amasheh S, Pfaffenbach S, Richter JF, Kausalya PJ, Hunziker W, Fromm M. Claudin-16 affects transcellular Cl- secretion in MDCK cells. J Physiol. 2009;587:3777–3793. doi: 10.1113/jphysiol.2009.173401. [DOI] [PMC free article] [PubMed] [Google Scholar]
- Hansma PK, Drake B, Marti O, Gould SA, Prater CB. The scanning ion-conductance microscope. Science. 1989;243:641–643. doi: 10.1126/science.2464851. [DOI] [PubMed] [Google Scholar]
- Hille B. Ion Channels of Excitable Membranes. Sunderland, MA: Sinauer. 2001 [Google Scholar]
- Hou J, Gomes AS, Paul DL, Goodenough DA. Study of claudin function by RNA interference. J Biol Chem. 2006;281:36117–36123. doi: 10.1074/jbc.M608853200. [DOI] [PubMed] [Google Scholar]
- Hou J, Paul DL, Goodenough DA. Paracellin-1 and the modulation of ion selectivity of tight junctions. J Cell Sci. 2005;118:5109–5118. doi: 10.1242/jcs.02631. [DOI] [PubMed] [Google Scholar]
- Hou J, Rajagopal M, Yu AS. Claudins and the kidney. Annu Rev Physiol. 2013;75:479–501. doi: 10.1146/annurev-physiol-030212-183705. [DOI] [PMC free article] [PubMed] [Google Scholar]
- Hou J, Renigunta A, Gomes AS, Hou M, Paul DL, Waldegger S, Goodenough DA. Claudin-16 and claudin-19 interaction is required for their assembly into tight junctions and for renal reabsorption of magnesium. Proc Natl Acad Sci USA. 2009;106:15350–15355. doi: 10.1073/pnas.0907724106. [DOI] [PMC free article] [PubMed] [Google Scholar]
- Hou J, Renigunta A, Konrad M, Gomes AS, Schneeberger EE, Paul DL, Waldegger S, Goodenough DA. Claudin-16 and claudin-19 interact and form a cation-selective tight junction complex. J Clin Invest. 2008;118:619–628. doi: 10.1172/JCI33970. [DOI] [PMC free article] [PubMed] [Google Scholar]
- Kaufmann R, Piontek J, Grull F, Kirchgessner M, Rossa J, Wolburg H, Blasig IE, Cremer C. Visualization and quantitative analysis of reconstituted tight junctions using localization microscopy. PLoS One. 2012;7:e31128. doi: 10.1371/journal.pone.0031128. [DOI] [PMC free article] [PubMed] [Google Scholar]
- Konrad M, Schaller A, Seelow D, Pandey AV, Waldegger S, Lesslauer A, Vitzthum H, Suzuki Y, Luk JM, Becker C, et al. Mutations in the tight-junction gene claudin 19 (CLDN19) are associated with renal magnesium wasting, renal failure, and severe ocular involvement. Am J Hum Genet. 2006;79:949–957. doi: 10.1086/508617. [DOI] [PMC free article] [PubMed] [Google Scholar]
- Lemmon MA, Treutlein HR, Adams PD, Brunger AT, Engelman DM. A dimerization motif for transmembrane alpha-helices. Nat Struct Biol. 1994;1:157–163. doi: 10.1038/nsb0394-157. [DOI] [PubMed] [Google Scholar]
- MacKenzie KR, Prestegard JH, Engelman DM. A transmembrane helix dimer: structure and implications. Science. 1997;276:131–133. doi: 10.1126/science.276.5309.131. [DOI] [PubMed] [Google Scholar]
- Mitic LL, Unger VM, Anderson JM. Expression, solubilization, and biochemical characterization of the tight junction transmembrane protein claudin-4. Protein Sci. 2003;12:218–227. doi: 10.1110/ps.0233903. [DOI] [PMC free article] [PubMed] [Google Scholar]
- Musil LS, Goodenough DA. Multisubunit assembly of an integral plasma membrane channel protein, gap junction connexin43, occurs after exit from the ER. Cell. 1993;74:1065–1077. doi: 10.1016/0092-8674(93)90728-9. [DOI] [PubMed] [Google Scholar]
- Nusrat A, Parkos CA, Verkade P, Foley CS, Liang TW, Innis-Whitehouse W, Eastburn KK, Madara JL. Tight junctions are membrane microdomains. J Cell Sci. 2000;113:1771–1781. doi: 10.1242/jcs.113.10.1771. [DOI] [PubMed] [Google Scholar]
- Papini E, Satin B, Norais N, de Bernard M, Telford JL, Rappuoli R, Montecucco C. Selective increase of the permeability of polarized epithelial cell monolayers by Helicobacter pylori vacuolating toxin. J Clin Invest. 1998;102:813–820. doi: 10.1172/JCI2764. [DOI] [PMC free article] [PubMed] [Google Scholar]
- Piontek J, Winkler L, Wolburg H, Muller SL, Zuleger N, Piehl C, Wiesner B, Krause G, Blasig IE. Formation of tight junction: determinants of homophilic interaction between classic claudins. FASEB J. 2008;22:146–158. doi: 10.1096/fj.07-8319com. [DOI] [PubMed] [Google Scholar]
- Rossa J, Ploeger C, Vorreiter F, Saleh T, Protze J, Gunzel D, Wolburg H, Krause G, Piontek J. Claudin-3 and claudin-5 protein folding and assembly into the tight junction are controlled by non-conserved residues in the transmembrane 3 (TM3) and extracellular loop 2 (ECL2) segments. J Biol Chem. 2014;289:7641–7653. doi: 10.1074/jbc.M113.531012. [DOI] [PMC free article] [PubMed] [Google Scholar]
- Sahin-Toth M, Lawrence MC, Kaback HR. Properties of permease dimer, a fusion protein containing two lactose permease molecules from Escherichia coli. Proc Natl Acad Sci USA. 1994;91:5421–5425. doi: 10.1073/pnas.91.12.5421. [DOI] [PMC free article] [PubMed] [Google Scholar]
- Saitoh Y, Suzuki H, Tani K, Nishikawa K, Irie K, Ogura Y, Tamura A, Tsukita S, Fujiyoshi Y. Tight junctions. Structural insight into tight junction disassembly by Clostridium perfringens enterotoxin. Science. 2015;347:775–778. doi: 10.1126/science.1261833. [DOI] [PubMed] [Google Scholar]
- Shen L, Weber CR, Turner JR. The tight junction protein complex undergoes rapid and continuous molecular remodeling at steady state. J Cell Biol. 2008;181:683–695. doi: 10.1083/jcb.200711165. [DOI] [PMC free article] [PubMed] [Google Scholar]
- Simon DB, Lu Y, Choate KA, Velazquez H, Al-Sabban E, Praga M, Casari G, Bettinelli A, Colussi G, Rodriguez-Soriano J, et al. Paracellin-1, a renal tight junction protein required for paracellular Mg2+ resorption. Science. 1999;285:103–106. doi: 10.1126/science.285.5424.103. [DOI] [PubMed] [Google Scholar]
- Stevenson BR, Goodenough DA. Zonulae occludentes in junctional complex-enriched fractions from mouse liver: preliminary morphological and biochemical characterization. J Cell Biol. 1984;98:1209–1221. doi: 10.1083/jcb.98.4.1209. [DOI] [PMC free article] [PubMed] [Google Scholar]
- Suzuki H, Ito Y, Yamazaki Y, Mineta K, Uji M, Abe K, Tani K, Fujiyoshi Y, Tsukita S. The four-transmembrane protein IP39 of Euglena forms strands by a trimeric unit repeat. Nat Commun. 2013;4:1766. doi: 10.1038/ncomms2731. [DOI] [PMC free article] [PubMed] [Google Scholar]
- Suzuki H, Nishizawa T, Tani K, Yamazaki Y, Tamura A, Ishitani R, Dohmae N, Tsukita S, Nureki O, Fujiyoshi Y. Crystal structure of a claudin provides insight into the architecture of tight junctions. Science. 2014;344:304–307. doi: 10.1126/science.1248571. [DOI] [PubMed] [Google Scholar]
- Suzuki H, Tani K, Tamura A, Tsukita S, Fujiyoshi Y. Model for the architecture of claudin-based paracellular ion channels through tight junctions. J Mol Biol. 2015;427:291–297. doi: 10.1016/j.jmb.2014.10.020. [DOI] [PubMed] [Google Scholar]
- Van Itallie CM, Anderson JM. Claudins and epithelial paracellular transport. Annu Rev Physiol. 2006;68:403–429. doi: 10.1146/annurev.physiol.68.040104.131404. [DOI] [PubMed] [Google Scholar]
- Van Itallie CM, Holmes J, Bridges A, Gookin JL, Coccaro MR, Proctor W, Colegio OR, Anderson JM. The density of small tight junction pores varies among cell types and is increased by expression of claudin-2. J Cell Sci. 2008;121:298–305. doi: 10.1242/jcs.021485. [DOI] [PubMed] [Google Scholar]
- Van Itallie CM, Mitic LL, Anderson JM. Claudin-2 forms homodimers and is a component of a high molecular weight protein complex. J Biol Chem. 2011;286:3442–3450. doi: 10.1074/jbc.M110.195578. [DOI] [PMC free article] [PubMed] [Google Scholar]
- Yu AS, Cheng MH, Angelow S, Gunzel D, Kanzawa SA, Schneeberger EE, Fromm M, Coalson RD. Molecular basis for cation selectivity in claudin-2-based paracellular pores: identification of an electrostatic interaction site. J Gen Physiol. 2009;133:111–127. doi: 10.1085/jgp.200810154. [DOI] [PMC free article] [PubMed] [Google Scholar]
- Zhou GP. The disposition of the LZCC protein residues in wenxiang diagram provides new insights into the protein-protein interaction mechanism. J Theor Biol. 2011;284:142–148. doi: 10.1016/j.jtbi.2011.06.006. [DOI] [PMC free article] [PubMed] [Google Scholar]
- Zhou Y, Chen CC, Baker LA. Heterogeneity of multiple-pore membranes investigated with ion conductance microscopy. Anal Chem. 2012;84:3003–3009. doi: 10.1021/ac300257q. [DOI] [PMC free article] [PubMed] [Google Scholar]
- Zhou Y, Chen CC, Weber AE, Zhou L, Baker LA, Hou J. Potentiometric-scanning ion conductance microscopy for measurement at tight junctions. Tissue Barriers. 2013;1:e25585. doi: 10.4161/tisb.25585. [DOI] [PMC free article] [PubMed] [Google Scholar]
Associated Data
This section collects any data citations, data availability statements, or supplementary materials included in this article.