

Abstract
Supercritical fluid technology offers several advantages in preparation of microparticles. These include uniformity in particle size, morphology, and drug distribution without degradation of the product. One of the recent advantages is preparation of porous aerogel carrier with proper aerodynamic properties. In this study, we aimed to prepare chitosan aerogel microparticles using supercritical fluid (SCF) technology and compare that with microparticles produced by freeze drying (FD). Loading the prepared carriers with a model drug (salbutamol) was also performed. Comparisons of the particle properties and physicochemical characterizations were undertaken by evaluating particle size, density, specific surface area, and porosity. In vitro drug release studies were also investigated. The effect of many variables, such as molecular weight of chitosan oligomers, concentrations of chitosan, and concentrations of tripolyphosphate on the release, were also investigated. Chitosan aerogels were efficiently produced by SCF technology with an average particle size of 10 μm with a tapped density values around 0.12 g/mL, specific surface area (73–103) m2/g, and porosity (0.20–0.29) cc/g. Whereas, microparticles produced by FD method were characterized as cryogels with larger particle size (64 microns) with clear cracking at the surface. Sustained release profile was achieved for all prepared microparticles of salbutamol produced by the aforementioned methods as compared with pure drug. The results also demonstrates that chitosan molecular weight, polymer concentration, and tripolyphosphate concentration affected the release profile of salbutamol from the prepared microparticles. In conclusion, SCF technology was able to produce chitosan aerogel microparticles loaded with salbutamol that could be suitable for pulmonary drug delivery system.
KEY WORDS: aerodynamic, aerogels, chitosan, salbutamol, supercritical fluid technology
INTRODUCTION
The major problem in pulmonary drug delivery lies in the very small particle size requirement (1–3 μm), together with the high tapped density (about 1 g/mL) [1–3]. Therefore, large doses are required as a result of the loss of a major portion of these drugs through aggregation. The aggregates are subsequently phagocytosed by macrophages [4, 5]. A novel approach has been proposed for efficient pulmonary drug delivery, and this comprises the development of aerodynamically light, porous particles (aerogels) with an average particle size of about 10 μm and a tapped density of less than 0.45 g/mL [6].
Aerogels are highly porous, open cell materials with a very high surface area and a very low tapped density. They are mostly amorphous and are usually prepared using sol–gel technology. The solvent is eliminated using a special drying technique such as supercritical fluid (SCF) technology to maintain the structure of the gel and to prevent the pore collapse phenomenon by protecting the dried product against cracking and shrinkage [7–10]. SCF has been used as a drying system to prepare chitin aerogels from chitin alcogels [11]. It has also been used to prepare silica aerogels from rice hull ash [7]. Aerogels can be loaded efficiently with amorphous drugs [9] during the sol–gel process, with solvent exchange [10], or after drying using SCF technology by diffusion [12, 13].
SCF technology improves the efficiency of many pharmaceutical industrial processes such as extraction, drying, particle generation and coprecipitation, crystallization, aerogel preparation, inclusion complex formation, and chemical reactions that require high speed [14–18]. SCF offers advantages of being safe (clean technology), time and process efficiency [18, 19]. The most popular material used in SCF technology is carbon dioxide (CO2), which has the advantages of mild critical conditions (31.1°C and 73.8 bar), availability, low cost, non-flammability, and low toxicity compared with other substances.
Chitosan is a natural, linear polyamino saccharide usually obtained from chitin by alkaline deacetylation [4]. Chitin is the second most abundant polysaccharide after cellulose. It has been reported that chitosan nanoparticles exhibit in vitro biocompatibility with respiratory epithelial cells, making them an excellent candidate for use as a carrier for pulmonary drug delivery [20]. Chitosan microparticles were successfully prepared using SCF-assisted atomization in a 1% acetic acid solution, resulting in spherical microparticles with narrow particle size distributions [20]. The ionic gelation of chitosan with sodium tripolyphosphate (STPP) has also been used to prepare nanoparticles loaded with thiocolchicoside for oral drug delivery, and drying was accomplished by freeze drying (FD) [21]. The spray drying technique has also been used to prepare chitosan microspheres loaded with salbutamol for pulmonary drug delivery [22, 23].
The main objective of this work was to prepare chitosan porous carriers (aerogels) with proper aerodynamic properties using SCF technology and compare that with microparticles produced by FD method. Proper aerodynamic properties were indicated by preparation of particles with average size of about 10 μm and a tapped density of less than 0.45 g/mL [6]. Salbutamol was selected as a model drug to be loaded in the prepared carriers. The prepared particles were characterized using particle size analysis, density measurements, surface area analysis, and porosity measurements. In addition, in vitro release studies of salbutamol from the prepared carriers was also performed. The effects of changing chitosan molecular weight and the amount of tripolyphosphateas crosslinking agent on the release profiles were studied.
MATERIALS AND METHODS
Materials
Raw chitosan polymer (250 kDa) and lactose monohydrate were kindly donated by the Jordanian Pharmaceutical Manufacturing Company (Naour, Jordan). Salbutamol sulfate was kindly donated by the Pharmaceutical Research Unit (Amman, Jordan). Hydrochloric acid 37% AR was purchased from Biosolvechemie, Dieuze, France. Absolute ethanol was supplied by SOLVOCHEM, Netherlands. STPP and dialysis tubing cellulose membrane (average flat width of 25 mm) were supplied by Sigma-Aldrich, USA. Glacial acetic acid was supplied by Medex, UK. Methanol (HPLC grade) was supplied by Fisher Chemical, UK. Potassium bromide (IR spectroscopy grade), sodium hydroxide (granulated, synthesis grade), and potassium dihydrogen phosphate (extra pure) were supplied by Scharlau Chemie, Spain. CO2 (purity 99.9%) were supplied by the Jordanian Gas Co., Amman, Jordan. The water used in all the experiments was double-distilled deionized water. All chemicals were used as supplied without further modification except for chitosan.
Methods
Preparation of Chitosan Microparticles Using SFC Technology and FD Technology
Low molecular weight chitosan oligomers were prepared as reported by Obaidat et al. [24]. The reaction time was either 2 or 6 h to obtain either 16 or 8 kDa oligomers, respectively [23]. The preparation method was validated in terms of reproducibility and accuracy to obtain the required molecular weights, which was assessed by viscosity measurements with a sine-wave Vibro SV-10/SV-100 viscometer (KSV Instruments, Helsinki, Finland). The obtained oligomer powders were stored in glass vials at room temperature.
Raw chitosan (250 kDa) was dissolved in dilute acetic acid solution (2% v/v) while the chitosan oligomers (16 and 8 kDa) were dissolved in water. The pH was adjusted to 5 by measuring with a Schott pH meter (model CG 843, Germany). The solution was then added dropwise from a burette to a solution of STTP (0.2, 0.5, and 5% w/v in water). The resulting chitosan microparticles were then dehydrated by immersion into a series of ethanol baths of increasing alcohol concentration (20–100% v/v). The microparticles were then either dried by SCF at 1450 psi and 40°C for 2 h using an SFT-110 (Supercritical Fluid Extractor, Supercritical Fluid Technologies, Inc., USA) or dried at −40°C for (48–72) h using freeze drying apparatus (LYOOLEST-85, Telstar, Spain). Preliminary experiments were performed to select temperature, pressure, and time. The loading of salbutamol into the particles was performed in the final step of the preparation after soaking in ethanol and before drying. Salbutamol (100 mg) was added to the chitosan dispersion using a stirrer for 15 min. After 1 h (equilibrium), the microparticles loaded with salbutamol were dried. Lactose was added to some microparticles. The prepared microparticles are shown in Table I.
Table I.
Composition of the Prepared Chitosan Microparticles
| Drying method | Formula | Conc. of polymer (w/v) | Conc. of STPP |
|---|---|---|---|
| SCF | S1 | 1% raw chitosan | 0.5% w/v |
| S2 | 1% 16 kDa oligomers | ||
| S3 | 1% (50% 16 kDa oligomer, 50% lactose) | ||
| S4 | 1% (50% raw chitosan, 50% lactose) | ||
| S5 | 1% (70% 16 kDa oligomer, 30% lactose) | ||
| S6 | 1% (70% raw chitosan, 30% lactose) | ||
| S7 | 2% raw chitosan | ||
| S8 | 3% raw chitosan | ||
| FD | FD1 | 1% (70% raw chitosan, 30% lactose) | |
| FD2 | 1% raw chitosan | ||
| FD3 | 1% 16 kDa oligomers | ||
| Drug-loaded microparticles: (100 mg) | |||
| SCF | F1 | 1% raw chitosan | 0.5% w/v |
| F2 | 1% 8 kDa oligomers | ||
| F3 | 1% 16 kDa oligomers | ||
| F4 | 1% raw chitosan | 0.2% w/v | |
| F5 | 1% 8 kDa oligomers | ||
| F6 | 1% 16 kDa oligomers | ||
| F7 | 1% raw chitosan | 5% w/v | |
| F8 | 1% 8 kDa oligomers | ||
| F9 | 1% 16 kDa oligomers | ||
| FD | FD4 | 1% 8 kDa oligomers | 0.5% w/v |
| FD5 | 1% raw chitosan | ||
| FD6 | 1% 16 kDa oligomers | ||
Characterization Procedures
FTIR Spectroscopy
Fourier transform infrared (FTIR) spectra of the prepared chitosan microparticles, the raw materials, and their physical mixtures were obtained with an IRAffinity-1 spectrophotometer (Shimadzu, Japan). The particles were mixed with grinded potassium bromide powder using a small mortar and pestle until a well-dispersed sample was obtained. A small amount of the powder was analyzed using FTIR spectroscopy over a frequency range of 4750–250 cm−1 and with 0.04 cm−1 resolution.
DSC Analysis
Differential scanning calorimetry (DSC) thermograms of the prepared chitosan microparticles, the raw materials, and physical mixtures of the raw materials were obtained by DSC (DSC-50, Shimadzu, Japan). Approximately 5 mg of each sample were sealed and heated in aluminum pans under nitrogen through a range of 25–250°C, at a rate of 10°C/min. An empty, sealed aluminum pan was used as a reference.
TGA
Thermograms of the prepared chitosan microparticles, the raw materials, and physical mixtures of the raw materials were obtained under nitrogen through a range of 25–350°C, at a rate of 10°C/min by thermal gravimetric analysis (TGA; TGA-50, Shimadzu, Japan).
Powder XRD
An X-ray powder diffractometer (Ultima IV X-ray diffractometer, Rigaku, Japan) was used to record X-ray diffraction (XRD) patterns of the prepared chitosan microparticles, the raw materials, and physical mixtures of the raw materials using cobalt radiation at a voltage of 40 kV and a current of 30 mA.
Tapped Density Measurements
The bulk densities of the prepared chitosan microparticles were determined using a powder integrative characterization apparatus (BT-1000, Better size Instrument Ltd, China). A known weight of each sample was placed in a 10 mL cylinder and tapped until a constant volume was reached. The volume was recorded and used to calculate the tapped density according to the following equation:
Each measurement was repeated three times, and the average and standard deviation were reported.
Particle Size Analysis
The particle size of the prepared chitosan microparticles was determined using a laser particle size analyzer (S3500, Microtrac Inc., USA). The average particle size was expressed as the mean volume in micrometer units. Each measurement was repeated three times, and the average and standard deviation were calculated.
Specific Surface Area and Porosity Determination
The specific surface area and porosity of the prepared chitosan microparticles were determined using a surface area analyzer (NOVA 2000, Quantachrome, USA).
SEM
SEM images of the prepared chitosan microparticles and the raw materials were obtained at different magnifications by SEM (Inspect F50, Netherlands). After placing the microparticles on stubs, they were coated with platinum using an Emitech K550X sputter coater under vacuum to form a conductive film.
In Vitro Drug Release Studies
The in vitro release of salbutamol from the prepared microparticles was evaluated using a modified Heelan and Corrigan method [25, 26] wherein a dialysis membrane was used. Fifty milligrams of the microparticles was placed inside 2 cm2, and both ends were tied. The dialysis bag was suspended in 20 mL isotonic phosphate buffer solution (pH 7.4). The flask was closed and placed in a shaking water bath that was maintained at 37°C and stirred at 100 cycles per minute. At predetermined time intervals, 3 mL aliquots were withdrawn and replaced with fresh, aqueous media. The withdrawn samples were filtered and analyzed using ultraviolet spectroscopy (Spectroscan 80 D, Biotech Engineering Management Co Ltd., UK) at 276 nm. To ensure that the sustained release effect did not come from the cellulose dialysis bag pores, the release of the drug alone from the dialysis bag was conducted under the same conditions. A calibration curve was plotted and the method was fully validated.
Stability
Several samples of prepared microparticles were stored at room temperature (25 ± 2°C) for 180 days. The samples were analyzed in terms of solid state stability as characterized by their physical appearance, X-ray diffraction, FTIR, and thermal analysis.
RESULTS
Characterization of the Prepared Particles
FTIR
Figure 1a–d shows FTIR spectra of raw chitosan, chitosan oligomers, salbutamol (F1–F3), and (FD4–FD6). Characteristic peaks for chitosan were present in all the preparations without significant changes. Shifts were observed for the amide I and amide II peaks at 1650 and 1600 cm−1, respectively, with the appearance of new peak around 1160 cm−1.
Fig. 1.
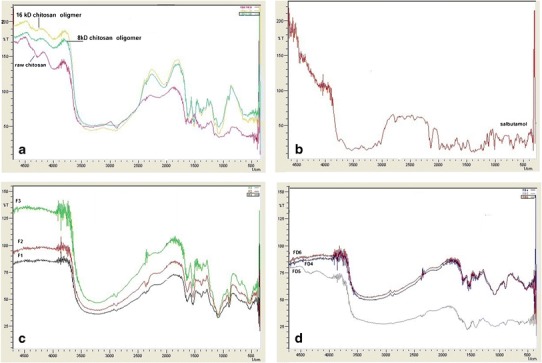
a, b Fourier transform infrared spectra of a raw chitosan, chitosan oligomers, and b salbutamol. c, d Fourier transform infrared spectra of prepared microparticles c F1, F2, F3, and d FD3, FD4, FD5
DSC Analysis
The DSC thermograms (Fig. 2a, b) for raw chitosan, chitosan oligomers, salbutamol, microparticles (F1–F3), and microparticles (FD4–FD6) show a wide endothermic peak presented between 90 and 110°C. The position and area of the endothermic peak were different for the prepared microparticles from the raw materials. A third endothermic peak appeared in the chitosan oligomer thermogram between 187 and 189°C. Thermograms also show disappearance of the second and third peaks in all FD and SCF prepared samples except for FD5 sample at which a new peak appeared at 211°C. The DSC thermogram of salbutamol is also shown with appearance of single endothermic peak at 200°C.
Fig. 2.
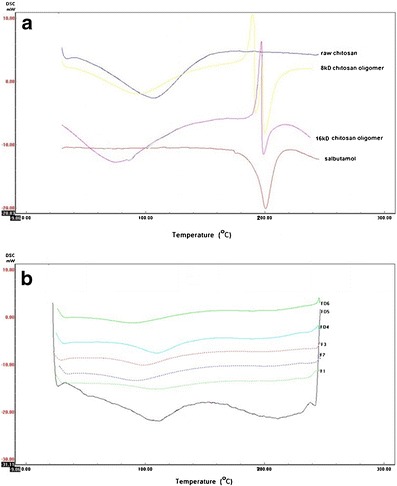
a DSC thermograms of raw chitosan, chitosan oligomers, and salbutamol. b DSC thermograms of prepared microparticles (F1, F2, F3, FD4, FD5, and FD6)
TGA
TGA curves of raw chitosan, chitosan oligomers, salbutamol, and microparticles (F1–F3), and microparticles (FD4–FD6) as shown in Fig. 3 show two weight loss stages. The first starts at about 25°C and ends at about 147°C, with weight loss that ranged from 3.5% for raw chitosan to 6.3% for chitosan oligomers. The average weight loss was less than 1% for the microparticles produced by SCF and 1.8% for the microparticles produced by FD, except for FD5, which had around 3% weight loss.
Fig. 3.
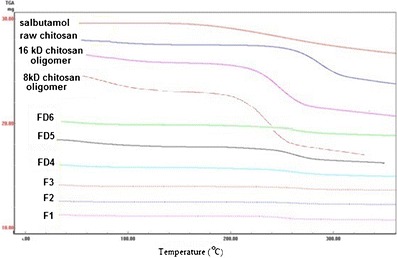
TGA thermograms of raw chitosan, chitosan oligomers, salbutamol, and prepared microparticles (F1, F2, F3, FD4, FD5, and FD6)
The second stage started at ≥160°C in the microparticles produced by SCF and FD with an average weight loss of 2% for SCF microparticles, 5.5% for FD microparticles, and 6.6% was for FD5.
The TGA curve of salbutamol shows around 14% weight loss at about 350°C starting from 166°C.
Powder XRD
The XRD pattern (Fig. 4a–c) of raw chitosan, oligomers, salbutamol, microparticles (F1–F3), and microparticles (FD4–FD6) contained characteristic peaks at a 2θ value of 21° whereas the second characteristic peak at 10.4° increased in size for chitosan oligomers, while strong diffraction peaks appeared in the powder XRD pattern of salbutamol.
Fig. 4.

a X-ray diffraction spectra of raw chitosan, chitosan oligomers, and salbutamol. b, c X-ray diffraction spectra of prepared microparticles b F1, F2, F3 and c FD4, FD5, and FD6
Characteristic broad chitosan peaks are present in the XRD patterns of the microparticles produced by SCF and FD with new peak appeared at a 2θ of 18.54° for SCF preparations and at 32°, 45.5°, and 57° for FD preparations. Also, FD5 showed different XRD pattern with new peaks at 8.7°,14°, 23°, 31°, and 35°. On the other hand, the characteristic peaks of salbutamol disappeared for all microparticles produced by SCF and FD techniques.
Tapped Density and Particle Size Measurements
The microparticles (S1–S6) produced by supercritical drying had tapped densities that ranged from 0.07 to 0.32 g/mL and particle size that ranged from 8.15 to 238.95 μm. The polymer (1%) produced average tapped density of 0.12 g/mL and average particle size of 10.40 μm, as listed in Table II. Increasing the concentration of raw chitosan polymer (S1, S7, S8) from 1 to 3% resulted in significant increase in tapped density from 0.12 to 0.28 as well as sharp increase in particle size from 8.31 to 231.97 μm. Conversely, the microparticles (FD1–FD3) produced by FD had bulk densities that ranged from 0.19 to 0.27 g/mL and particle size that ranged from 58.49 to 69.05 μm (average value 64 μm).
Table II.
Tapped Density and Particle Size Measurements for the Chitosan Microparticles Dried Using Supercritical Fluid Technology and the Freeze-Dried Method
| Drying method | Formula | Tapped density (g/mL) | Particle size (μm) |
|---|---|---|---|
| SCF | S1 | 0.12 ± 0.05 | 8.31 ± 0.16 |
| S2 | 0.14 ± 0.02 | 11.68 ± 0.13 | |
| S3 | 0.11 ± 0.05 | 10.65 ± 0.16 | |
| S4 | 0.13 ± 0.02 | 12.18 ± 0.45 | |
| S5 | 0.12 ± 0.03 | 7.33 ± 0.21 | |
| S6 | 0.10 ± 0.04 | 12.25 ± 0.46 | |
| S7 | 0.18 ± 0.02 | 50.08 ± 0.68 | |
| S8 | 0.28 ± 0.05 | 231.97 ± 6.98 | |
| FD | FD1 | 0.22 ± 0.03 | 59.24 ± 0.75 |
| FD2 | 0.22 ± 0.02 | 64.62 ± 1.23 | |
| FD3 | 0.25 ± 0.02 | 68.17 ± 0.88 |
Specific Surface Area and Porosity Determination
The specific surface area and porosity were determined for S1, S2, S4, FD2, and FD3. The specific surface area and the total pore volume for S1 were 102.5 m2/g and 0.29 cc/g, respectively, and values for S4 were 103.2 m2/g and 0.3 cc/g. These values were higher than those of S2 (73.1 m2/g and 0.20 cc/g, respectively). For the FD-produced carriers (FD2 and FD3), a Brunauer–Emmett–Teller (BET) isotherm could not be applied to calculate the surface area of these microparticles. This was because of the detection limit, which was 0.5–1 m2/g when using nitrogen gas. For low surface area materials, the number of unadsorbed nitrogen gas molecules in the void volume can exceed the number of adsorbed gas molecules, and this will lead to a larger uncertainty in measurements. The BET method cannot be used to determine the complete surface area of materials with outer as well as inner surfaces such as sheet silicates (54).
SEM
SEM analyses are shown in Fig. 5a, b. The particles size for the microparticles produced by SCF (F1, F2. and F3) appeared smaller than microparticles produced by FD with uniformity of pore size. This can be compared to clear fusion between polymeric chains for the FD microparticles with appearance of clear large cracks.
Fig. 5.
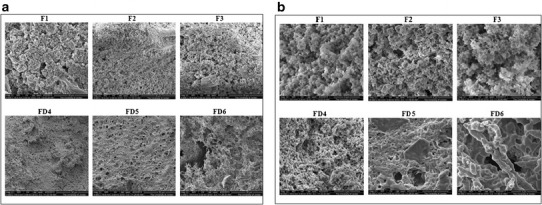
a, b Scanning electron microscopy images of the prepared microparticles (F1, F2, F3, FD4, FD5, and FD6) at a 4000× and b 30,000× magnifications
In Vitro Drug Release Studies
For all the chitosan microparticles, prolonged release was obtained (Fig. 6a, b) by comparison with unformulated salbutamol. Increasing the concentration of STPP decreased the rate of chitosan oligomer release as shown by the dissolution profiles of the 0.2, 0.5, and 5% microparticles.
Fig. 6.
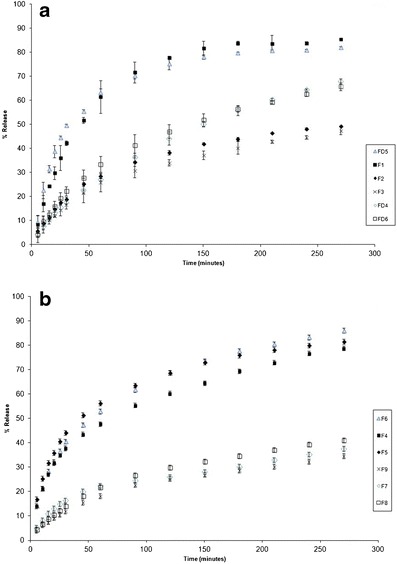
a Release profiles of salbutamol from the prepared microparticles (F1, F2, F3, FD4, FD5, and FD6). b Release profiles of salbutamol from the prepared microparticles (F4–F9). AAPSPT Editorial Office Re: Manuscript AAPSPT-D-14-00580
The type of chitosan used affects the release profile of salbutamol from the microparticles produced by SCF containing 5% STPP. None of the microparticles prepared using 0.2% STPP showed any significant differences in their release profiles. The highest rate of release was obtained for raw chitosan (Fig. 6a). For the 5% STPP microparticles, the higher molecular weight chitosan oligomer (16 kDa) had a lower rate of release than the lower molecular weight oligomer (8 kDa), but this was not the case for 0.5% STPP.
Figure 6b shows that the microparticles produced by FD prepared using 0.5% w/v STPP did not show different release profile from microparticles prepared using different molecular weight chitosan oligomers (8 and 16 kDa). However, a higher rate of release was obtained when using chitosan (250 kDa).
Stability Testing
Chitosan microparticles were shown to be very stable in all microparticles produced by SCF in terms of physical appearance in the solid state (amorphous structure). While the microparticles produced by FD were less stable than those produced by SCF with FD5 being the least stable showing a color change to brown.
DISCUSSION
Physicochemical Characterization of Chitosan
The shifts in the FTIR peaks at 1650 and 1600 cm−1 for raw chitosan were related to the free amine and amine salt as previously reported [20, 23]. FTIR of chitosan oligomers matched with reported results of Obaidat et al. [24]. Free amine vibrations occurred in the 1650–1590 cm−1 region while amine salt vibrations occur in the 1600–1400 cm−1 region. The appearance of new peak around 1160 cm−1 came from P–O stretching, implying complex formation via an electrostatic interaction between the phosphate groups from TPP and the ammonium ions from chitosan. There was no difference between FTIR spectra of chitosan for microparticles produced by either SCF and FD methods.
The thermograms of chitosan are usually characterized by two thermal events. The first endothermic peak represents water evaporation [20–23], and the second exothermic peak is related to the decomposition temperature, which was 311°C for raw chitosan and was around 202.8°C for the oligomers [24]. This indicates that raw chitosan is more stable than the chitosan oligomers. A third endothermic peak sometimes appeared in the chitosan oligomer thermograms which was attributed to the glass transition temperature (Tg) of the semicrystalline polymer because chitosan is composed of a considerable amorphous fraction [22, 27–29]. This peak appeared in oligomer thermograms between 187 and 198°C. The first peak is related to the hydrophilic character of chitosan. Many studies have shown the ability of chitosan to absorb water [28, 29]. The position and area of this peak were different for the prepared microparticles from the raw materials. This implies a difference in water content and shows the strength of the water–polymer interactions (absorption degree). The area of this peak decreased dramatically for microparticles produced by SCF and FD, with the lowest values obtained for SCF preparations, which indicates lower water content. Disappearance of the second and third peaks for the prepared microparticles indicates stabilization of chitosan’s conformation by crosslinking. The results for FD5 showed larger area of the first peak than other FD samples, with the appearance of a second endothermic peak at 211°C that can be explained as glass transition temperature (Tg). This phenomenon can be related to the presence of acetic acid which affected crystallinity of the sample since this peak only appeared in the FD sample that involved the solubilization of raw chitosan in acetic acid. Acetic acid reacts with amines and is known to be difficult to remove from samples [27].
The TGA results also showed better stability for the microparticles produced by SCF compared to the microparticles produced by FD. TGA curves showed two weight loss stages. The first stage which usually ranges from 25 to 147°C is related to water evaporation, as previously reported [20–22, 30]. It has been reported that the delay in the loss of water to above 100°C is due to the hydrogen bonds between chitosan and the water molecules [31], while the second stage (≥175°C) comes from polymer decomposition [24].
The weight loss was the least (<1%) for the microparticles produced by SCF. Better stability for the microparticles produced by SCF was obtained with the presence of second stage at about 223°C and 2% weight loss at 350°C compared to 5.5% that started at 160°C for microparticles produced by FD. FD5 showed exceptional behavior, where it started around 186°C and resulted in around 6.6% weight loss. This may be caused by the presence of traces of acetic acid in this formula [25, 27, 31–34].
The XRD pattern of the oligomers is characteristic of the “tendon hydrate polymorph” as reported previously [33]. The presence of characteristic chitosan peaks at 2θ values of 10.4° and 20.4° in XRD confirms presence of L-2 polymorph as reported previously [33]. The appearance of new peaks in the microparticles produced by SCF can be attributed to changes in the arrangement of molecules in the crystal lattice [25]. This rearrangement comes from a crosslinking effect that decreases the elasticity and decreases the chance of bending in the polymer as shown by thermal analysis. However, the microparticles produced by FD (except FD5) showed the same XRD pattern with new peaks appearing that indicate higher rigidity in the conformation of the molecules. FD5 had a different XRD pattern suggesting the presence of different polymorph that can be related to solvent-mediated crystallization due to the presence of acetic acid in the sample.
Salbutamol Characterization
Salbutamol powder thermal characterization showed an endothermic peak at 200°C which is related to salbutamol melting. Also, powder XRD analysis showed sharp peaks indicating the crytallinity of the drug. Salbutamol characterization showed agreement with published data [35–37]. On the other hand, lack of the salbutamol characteristic XRD peaks in the prepared microparticles indicated that the drug is precipitated in the carrier as an amorphous form.
Tapped Density and Particle Size Measurements
The oligomer microparticles produced by SCF (S1–S6) had a tapped density around 0.12 g/mL and particle size around 10.4 μm. This suggests acceptable aerodynamic properties for the prepared particles according to Jebra et al. [5, 6]. While microparticles produced by FD had higher bulk with average value 0.22 g/mL and larger particle size (around 64 μm). The concentration of the polymer is shown to affect microparticle properties (tapped density and particle size) in which increasing the concentration of the polymer caused an increase in tapped density as well as an increase in particle size. These results indicates that oligomer microparticles prepared from 1% polymeric solution produced by SCF are theoretically more suitable for pulmonary drug delivery than microparticles produced by FD. To study the effect of the presence of water soluble powder on particle densities, lactose was used initially in the unloaded microparticles. The results showed that the presence of lactose did not result in a significant difference in particle size, density, and porosity.
Specific Surface Area, Porosity, and SEM Analysis of the Prepared Microparticles
The values of specific surface area and porosity for raw chitosan (S1) were higher than those of the 16 kDa oligomers (S2), while lactose presence (S4) did not result in significant difference in the values of surface area and porosity. This indicates that presence of water soluble drug will not affect carrier important characteristics. Analysis of specific surface area of FD samples was not performed since BET equation could not be applied in this situation. BET isotherms require a homogeneous sample, and SEM analysis proved the presence of non-uniform large cracks and voids in the FD samples. Though both samples produced by SCF (S1 and S2) were shown by SEM to have homogeneous shape with a high specific surface area with the presence of macropores and mesopores, fusion between the polymeric chains and large non-uniform cracks was observed in FD samples. A comparison between the three FD samples shows that FD4 (prepared using the 8 kDa chitosan oligomer) had the lowest void volume (cracks).
Surface area, porosity measurement, and SEM analysis showed formation of chitosan aerogels using SCF. The microparticles produced by FD contained cracks (voids) between the connected fused polymeric chains. This can indicate the formation of a cryogel with a 3D structure upon the formation of cracks rather than aerogel [38]. Infact, the main limitation in the production of a highly porous structure such as an aerogel is the drying process. This is because of pore collapse in existing nanopores. Traditional drying methods usually require high temperatures and can cause a sudden collapse of these pores and cracking in the dried gel structure. The shrinkage of the pores may come from the surface tension of the liquid contained in the gel nanopores. This results in a capillary pressure gradient in the pore walls, which can reach 100–200 MPa and cause pore collapse. SCF drying overcomes the limitations of traditional drying by preserving the high open porosity and the superior textural properties of prepared porous structures such as aerogels [8]. SCF is considered to be the most suitable method for the preparation of polysaccharide aerogels. This is related to the moderate temperature employed in drying, whereby conformational changes and the likelihood of an interaction between molecules are minimized [38]. Efficiency of SCF procedure in terms of less time required to dry sample (≤1 h) compared to relatively long time by FD technique (48–72 h).
In Vitro Drug Release Studies
Prolonged release was obtained for all prepared microparticles as comparison with unformulated salbutamol. Increasing the concentration of STPP (0.2–5)% decreased the rate of release of the drug due to expected increase in crosslinking. This can be explained by considering that an increase in STPP concentration is expected to increase the crosslinking behavior of the polymeric chain, which decreases the swelling ability [21].
The type of chitosan used affects the release profile of salbutamol from the SCF-prepared microparticles. The highest rate of release was obtained for raw chitosan because it has the highest porosity among the preparations (Fig. 6a). In general, the release profile of raw chitosan did not show a regular pattern. This can be related to the nature of the heterogeneous sample of raw chitosan. On the other hand, the higher molecular weight chitosan oligomer (16 kDa) had a lower rate of release than 8 kDa oligomers using 5% STPP, but this was not the case for 0.5% STPP. This effect can be attributed to the viscosity of the oligomers in water. As the molecular weight of the chitosan oligomers increased, the viscosity also increased, leading to a retardation of drug release. A previous study has also shown that changing the molecular weight of chitosan affects the release profile of loaded drugs in polymers [26, 39]. Although the FD produced microparticles shows higher rate of release when using raw chitosan as compared to SCF microparticles, but it was not significant. On the other hand, the release profile of salbutamol from the chitosan oligomers with different molecular weights (8 and 16 kDa) produced by SCF technology was significantly different from the same microparticles produced by FD, as shown in Fig. 6b.
Model Fitting and Analysis of the Release Mechanism
The Korsmeyer–Peppas model is a semiempirical model that uses a simple exponential equation to correlate drug release with time, as shown below. It is important in cases where the drug has more than one release mechanism or the release mechanism is unknown.
F is the fraction of drug release at time t, Mt is the amount of drug released at time t, M is the total amount of drug in the dosage form, Km is the kinetic constant, t is time in hours, and n is the release exponent.
The release exponent (n) gives an indication of the release mechanism, and it can be estimated from the linear regression of log (F) versus log (t). If n ≤ 0.43, Fickian diffusion or release is indicated. If n = 0.85, case 2 transport (erosion of the polymeric chain) is indicated. If 0.43 ˂ n ˂ 0.85, anomalous or non-Fickian diffusion is indicated, and the release rate is controlled by both diffusion and the erosion of the polymeric chain [26, 40]. The in vitro release study data for each formulation were fitted to the Korsmeyer–Peppas model to determine the release mechanism of salbutamol. For all the prepared microparticles, the regression values (R2) ranged from 0.92 to 0.99 except for FD5, which was 0.86. The n values were between 0.43 and 0.85, except for F4 and F5, which had n values <0.43. This indicates that the release rate is controlled by both diffusion and erosion for all microparticles except for F4 and F5, which fit Fickian diffusion, indicating that drug release was by diffusion through the swollen matrix.
Stability Testing
Physical analysis and appearance after 3 months of storage at room temperature proved that the microparticles produced by SCF were very stable. On the other hand, the microparticles produced by FD proved less stability of the samples with FD5 being the least stable among all samples as shown by color changes. This may be related to the presence of traces of acetic acid in the sample, which may cause destabilization, as discussed by Berthold et al. [41].
CONCLUSION
The results of this study showed and proved that supercritical fluid drying was an efficient method in preparation of relatively large porous chitosan aerogel carrier with a particle size (10 μm) and tapped density (≤0.12 g/mL) in time less than 2 h, while freeze drying method consumed more than 48 h, and fusion between polymer chains occurred with clear cracking in the surface which resulted in production of cryogel having larger values of particle size (64 μm) and tapped density (≤0.22 g/mL). The prepared microparticles were efficiently loaded with salbutamol as a model drug, and sustained release profile was achieved for both SCF and FD-prepared microparticles. The release profile of salbutamol from the microparticles produced by SCF technology was significantly different from that produced by FD method. Also, the release profiles showed to be affected by the concentration of STPP, molecular weight, and concentration of chitosan.
In conclusion, SCF technology was able to produce chitosan aerogel microparticles loaded with salbutamol that could be suitable for pulmonary drug delivery system.
Future work should be designed to increase porosity and surface area of this carrier and to correlate values with aerodynamic diameter that should be measured using Andersen Cascade Impactor, and this can be followed by animal in vivo study for the prepared microparticles.
Acknowledgments
This work was supported by the Jordan University of Science and Technology (grant number 13/2012).
References
- 1.Ahmad FJ, Mittal G, Jain GK, Malhotra G, Khar RK, Bhatnagar A. Nano-salbutamol dry powder inhalation: a new approach for treating broncho-constrictive conditions. Eur J Pharm Biopharm. 2009;71(2):282–91. doi: 10.1016/j.ejpb.2008.09.018. [DOI] [PubMed] [Google Scholar]
- 2.Cook Novel sustained release microspheres for pulmonary drug delivery. J Control Release. 2005;104:79–90. doi: 10.1016/j.jconrel.2005.01.003. [DOI] [PubMed] [Google Scholar]
- 3.Vehring R. Pharmaceutical particle engineering via spray drying. Pharm Res. 2008;25(5):999–1022. doi: 10.1007/s11095-007-9475-1. [DOI] [PMC free article] [PubMed] [Google Scholar]
- 4.Grenha A, Grainger CI, Dailey LA, Seijo B, Martin GP, Remuñán-López C, et al. Chitosan nanoparticles are compatible with respiratory epithelial cells in-vitro. Eur J Pharm Sci. 2007;31(2):73–84. doi: 10.1016/j.ejps.2007.02.008. [DOI] [PubMed] [Google Scholar]
- 5.Ben-Jebria A, Eskew ML, Edwards DA. Inhalation system for pulmonary aerosol drug delivery in rodents using large porous particles. Aerosol Sci Technol. 2000;32(5):421–33. doi: 10.1080/027868200303551. [DOI] [Google Scholar]
- 6.Ben-Jebria A, Chen D, Eskew ML, Vanbever R, Langer R, Edwards DA. Large porous particles for sustained protection from carbachol-induced broncho constriction in guinea pigs. Pharm Res. 1999;16:555–61. doi: 10.1023/A:1018879331061. [DOI] [PubMed] [Google Scholar]
- 7.Chow AH, Tong HH, Chattopadhyay P, Shekunov BY. Particle engineering for pulmonary drug delivery. Pharm Res. 2007;24(3):411–37. doi: 10.1007/s11095-006-9174-3. [DOI] [PubMed] [Google Scholar]
- 8.Tang Q, Wang T. Preparation of silica aerogel from rice hull ash by supercritical carbon dioxide drying. J Supercrit Fluids. 2005;35(1):91–4. doi: 10.1016/j.supflu.2004.12.003. [DOI] [Google Scholar]
- 9.García-González CA, Uy JJ, Alnaief M, Smirnova I. Preparation of tailor-made starch-based aerogel microspheres by the emulsion-gelation method. Carbohydr Polym. 2012;88(4):1378–86. doi: 10.1016/j.carbpol.2012.02.023. [DOI] [Google Scholar]
- 10.García-González CA, Alnaief M, Smirnova I. Polysaccharide-based aerogels—promising biodegradable carriers for drug delivery systems. Carbohydr Polym. 2011;86(4):1425–38. doi: 10.1016/j.carbpol.2011.06.066. [DOI] [Google Scholar]
- 11.Pierre AC, Pajonk GM. Chemistry of aerogels and their applications. Chem Rev. 2002;102(11):4243–66. doi: 10.1021/cr0101306. [DOI] [PubMed] [Google Scholar]
- 12.Mehling T, Smirnova I, Guenther U, Neubert R. Polysaccharide-based aerogels as drug carriers. J Non-Cryst Solids. 2009;355(50-51):2472–9. doi: 10.1016/j.jnoncrysol.2009.08.038. [DOI] [Google Scholar]
- 13.Buisson P, Hernandez C, Pierre M, Pierre A. Encapsulation of lipases in aerogels. J Non-Cryst Solids. 2001;285(1-3):295–302. doi: 10.1016/S0022-3093(01)00470-7. [DOI] [Google Scholar]
- 14.Schwertfeger F, Zimmermann A, Krempel H, inventors; Hoechst Aktiengesellschaft, assignee. Use of inorganic aerogels in pharmacy. United States patent US 6280744. 2001 Aug 28.
- 15.Krukonis V. Supercritical fluids: their proliferation in the pharma industry. Eur Pharmaceutical Contractor (EPC) May 1998.
- 16.Martín A, Cocero MJ. Micronization processes with supercritical fluids: fundamentals and mechanisms. Adv Drug Delivery Rev. 2008;60:339–50. doi: 10.1016/j.addr.2007.06.019. [DOI] [PubMed] [Google Scholar]
- 17.Pasquali I, Bettini R, Giordano F. Supercritical fluid technologies: an innovative approach for manipulating the solid-state of pharmaceuticals. Adv Drug Delivery Rev. 2008;60(3):399–410. doi: 10.1016/j.addr.2007.08.030. [DOI] [PubMed] [Google Scholar]
- 18.Zougagh M, Valcárcel M, Rıos A. Supercritical fluid extraction: a critical review of its analytical usefulness. TrAC Trends Anal Chem. 2004;23(5):399–405. doi: 10.1016/S0165-9936(04)00524-2. [DOI] [Google Scholar]
- 19.Pasquali I, Bettini R. Are pharmaceutics really going supercritical? Int J Pharm. 2008;364(2):176–87. doi: 10.1016/j.ijpharm.2008.05.014. [DOI] [PubMed] [Google Scholar]
- 20.Reverchon E, Antonacci A. Chitosan microparticles production by supercritical fluid processing. J Supercrit Fluids. 2006;46(2):5722–8. [Google Scholar]
- 21.Nanda RK, Patil SS, Navathar DA. Chiotsan nanoparticles loaded with thiocolchicoside. Der Pharma Chemica. 2012;4(4):1619–1625. [Google Scholar]
- 22.Kamble MS. Formulation & characterisation of chitosan based microspheres of salbutamol sulphate dry powder inhaler formulation. J Drug Delivery Ther. 2012;2(5):37–41. [Google Scholar]
- 23.Corrigan DO, Healy AM, Corrigan OI. Preparation and release of salbutamol from chitosan and chitosan co-spray dried compacts and multiparticulates. Eur J Pharm Biopharm. 2006;62(3):295–305. doi: 10.1016/j.ejpb.2005.09.008. [DOI] [PubMed] [Google Scholar]
- 24.Obaidat R, Al-Jbour N, Al-Souâ K, Sweidan K, Al-Remawi M, Badwan A. Some physico-chemical properties of low molecular weight chitosans and their relationship to conformation in aqueous solution. J Sol Chem. 2010;39:575–88. doi: 10.1007/s10953-010-9517-x. [DOI] [Google Scholar]
- 25.Dhawade PP, Jagtap RN. Characterization of the glass transition temperature of chitosan and its oligomers by temperature modulated differential scanning calorimetry. Adv Appl Sci Res. 2012;3(3):1372. [Google Scholar]
- 26.Kouchak M, Avadi M, Abbaspour M, Jahangiri A, Boldaji SK. Effect of different molecular weights of chitosan on preparation and characterization of insulin loaded nanoparticles by ion gelation method. Int J Drug Dev Res. 2012;4:271–7. [Google Scholar]
- 27.El-Hefian EA, Elgannoudi ES, Mainal A, Yahaya AH. Characterization of chitosan in acetic acid: rheological and thermal studies. Turk J Chem. 2010;34:47–56. [Google Scholar]
- 28.Dong Y, Ruan Y, Wang H, Zhao Y, Bi D. Studies on glass transition temperature of chitosan with four techniques. J Appl Polym Sci. 2004;93:1553–8. doi: 10.1002/app.20630. [DOI] [Google Scholar]
- 29.Lazaridou A, Biliaderis CG. Thermophysical properties of chitosan, chitosan–starch and chitosan–pullulan films near the glass transition. Carbohydr Polym. 2002;48:179–90. doi: 10.1016/S0144-8617(01)00261-2. [DOI] [Google Scholar]
- 30.Tsioptsias C, Michailof C, Stauropoulos G, Panayiotou C. Chitin and carbon aerogels from chitin alcogels. Carbohydr Polym. 2009;76(4):535–40. doi: 10.1016/j.carbpol.2008.11.018. [DOI] [Google Scholar]
- 31.Kačuráková M, Belton PS, Wilson RH, Hirsch J, Ebringerová A. Hydration properties of xylan-type structures: an FTIR study of xylo oligosaccharides. J Sci Food Agr. 1998;77:38–44. doi: 10.1002/(SICI)1097-0010(199805)77:1<38::AID-JSFA999>3.0.CO;2-5. [DOI] [Google Scholar]
- 32.Cardenas G, Miranda SP. FTIR and TGA studies of chitosan composite films. J Chil Chem Soc. 2004;49:291–5. [Google Scholar]
- 33.Elhefian EA, Nasef MM, Yahaya AH. Preparation and characterization of chitosan/agar blended films: part 2. thermal, mechanical, and surface properties. J Chem. 2012;9:510–6. [Google Scholar]
- 34.Bhumkar DR, Pokharkar VB. Studies on effect of pH on cross-linking of chitosan with sodium tripolyphosphate: a technical note. AAPS PharmSciTech. 2006;7:E138–E143. doi: 10.1208/pt070250. [DOI] [PMC free article] [PubMed] [Google Scholar]
- 35.Reverchon E, Della Porta G, Pallado P. Supercritical antisolvent precipitation of salbutamol microparticles. Powder Technol. 2001;114(1–3):17–22. doi: 10.1016/S0032-5910(00)00257-6. [DOI] [Google Scholar]
- 36.Nath B, Nath LK, Mazumder B, Kumar P, Sharma N, Sahu BP. Preparation and characterization of salbutamol sulphate loaded ethyl cellulose microspheres using water-in-oil-oil emulsion technique. Iranian J Pharm Res. 2010;9(2):97–105. [PMC free article] [PubMed] [Google Scholar]
- 37.Vatanara A, RouholaminiNajafabadi A, Gilani K, Asgharian R, Darabi M, Rafiee-Tehrani M. A Plackett–Burman design for screening of the operation variables in the formation of salbutamol sulphate particles by supercritical antisolvent. J Supercrit Fluids. 2007;40(1):111–6. doi: 10.1016/j.supflu.2006.03.028. [DOI] [Google Scholar]
- 38.Jin H, Nishiyama Y, Wada M, Kuga S. Nanofibrillar cellulose aerogels. Colloids Surf A. 2004;240:63–7. doi: 10.1016/j.colsurfa.2004.03.007. [DOI] [Google Scholar]
- 39.Honary S, Maleki M, Karami M. The effect of chitosan molecular weight on the properties of alginate/chitosan microparticles containing prednisolone. Trop J Pharm Res. 2009;8:53–61. doi: 10.4314/tjpr.v8i1.14712. [DOI] [Google Scholar]
- 40.Parize AL, Stulzer HK, Laranjeira MCM, da Costa Brighente IM, de Souza TCR. Evaluation of chitosan microparticles containing curcumin and crosslinked with sodium tripolyphosphate produced by spray drying. Quim Nova. 2012;35:1127–32. doi: 10.1590/S0100-40422012000600011. [DOI] [Google Scholar]
- 41.Berthold A, Cremer K, et al. Influence of crosslinking on the acid stability and physicochemical properties of chitosan microspheres. STP Pharma Sci. 1996;6(5):358–364. [Google Scholar]