Abstract
Myricetin (MYR) is a natural compound that has been investigated as a chemopreventative agent. MYR has been shown to suppresses ultraviolet B (UVB)-induced cyclooxygenase-2 (COX-2) protein expression and reduce the incidence of UVB-induced skin tumors in mice. Despite MYR’s promise as a therapeutic agent, minimal information is available to guide the progression of formulations designed for future drug development. Here, data is presented describing the solid-state and solution characterization of MYR. Investigation into the solid-state properties of MYR identified four different crystal forms, two hydrates (MYR I and MYR II) and two metastable forms (MYR IA and MYR IIA). From solubility studies, it was evident that all forms are very insoluble (<5 μg/ml) in pure water. MYR I was found to be the most stable form at 23, 35, and 56°C. Stability determination indicated that MYR undergoes rapid apparent first-order degradation under basic pH conditions, and that degradation was influenced by buffer species. Apparent first-order degradation was also seen when MYR was introduced to an oxidizing solution. Improved stability was achieved after introducing 0.1% antioxidants to the solution. MYR was found to have good stability following exposure to ultraviolet radiation (UVR), which is a consideration for topical applications. Finally, a partitioning study indicated that MYR possess a log P of 2.94 which, along with its solid-state properties, contributes to its poor aqueous solubility. Both the solid-state properties and solution stability of MYR are important to consider when developing future formulations.
KEY WORDS: hydrate, log P, myricetin, solubility, stability
INTRODUCTION
Myricetin (MYR, Fig. 1) is a naturally occurring flavonoid (3, 3′, 4′, 5, 5′, 7-hexahydroxyflavone) found in a variety of fruits such as berries and grapes (1,2). Studies have identified flavonols, including MYR, to possess anti-oxidant, anti-tumor, and anti-inflammatory activity (3,4). The potential for dietary phytochemicals, such as MYR, as chemoprevention agents has been reported throughout the literature (3). With regard to MYR specifically, studies have demonstrated that MYR inhibits tumor cell transformation by direct inhibition of mitogen-activated protein kinase (MAPK)/ERK kinase (MEK) kinase activity in JB6 P+ mouse epidermal cells (5). This study also illustrated that the inhibitory effects of MYR were more potent than the well-characterized chemopreventive agent, resveratrol. Investigations into the role of MYR in skin cancer, including mechanism and target(s), indicate that MYR suppresses ultraviolet B (UVB)-induced cyclooxygenase-2 (COX-2) protein expression in the same cell lines (6). Data suggests that this is achieved by MYR competitively binding to ATP to suppress Fyn kinase activity (6). Additionally, skin tumorigenesis data, via dorsal mouse skin, showed that pretreatment with a topical application of MYR in acetone reduced the incidence of UVB-induced skin tumors (6).
Fig. 1.

Structure of myricetin (MW = 318.23 g/Mol)
Despite evidence in the literature demonstrating MYR’s promise as a chemopreventative for skin cancer, as well as other indications (7), minimal information is available to guide the progression of formulations designed for future drug development. One of the main issues facing potential formulations is the poor aqueous solubility often found among flavonoids. Quercetin, a flavonoid similar in structure to MYR, has been reported to be fairly insoluble at room temperature (5.5 μg/ml) (8). Likewise, MYR has also been reported to have low aqueous solubility at room temperature (<1.5 μg/ml) (9) while in vivo experimentation indicated a low bioavailability of 9.6% in rats (10).
As potential therapeutic benefits of MYR continues to be explored, so too does the approaches to enhance the solubility and absorption. Such delivery systems include complexation with β-cyclodextrins (11,12), a microemulsion (13), and the development of a 1:1 cocrystal with piracetam (14). The aim of this study is to further investigate the solution and solid-state properties of MYR.
MATERIALS AND METHODS
Myricetin was purchased from Research Products International (Mount Prospect, IL) and Sigma-Aldrich (St. Louis, MO). Monobasic potassium phosphate, dibasic sodium phosphate, sodium citrate, boric acid, hydrochloric acid, sodium chloride, ascorbic acid, sodium metabisulfite, polyethylene glycol (PEG) (200, 300, and 400), acetone, and 1-octanol were also purchased from Sigma-Aldrich. Citric acid, methanol, and propylene glycol were acquired from Spectrum Chemical Company (New Brunswick, NJ,). Sodium hydroxide was obtained from EM Science (Darmstadt, Germany). Ethyl alcohol (200 proof) was bought from Decon Labs (King of Prussia, PA). Acetic acid was from Fisher Scientific (Waltham, MA). Anhydrous methanol and a coulometric reagent were purchased from EMD (Gibbstown, NJ, USA). A Millipore water purification system with a 0.22 μm filter was used for water.
Differential Scanning Calorimetry
Thermal analysis was performed via a Q1000 differential scanning calorimeter (DSC) with an auto sampler (TA Instruments, New Castle, DE) and calibrated with indium. Drug samples were weighed (3–4 mg) and placed into an aluminum hermetic pan with a pin-hole lid. A nitrogen purge of 40 ml/min was used throughout. Samples were allowed to equilibrate at 30°C for 5 min, followed by a heat ramp of 10°C/min up to 400°C to determine the melting point (TM). When investigating possible pseudopolymorphs, the initial equilibration period was followed by a heat ramp of 10°C/min up to 150°C, then cooled to 30°C, and followed by a second heat ramp to 150°C. The enthalpy of the phase transition was calculated by the area under the curve for each endotherm, while entropy of the phase transition was obtained by Eq. 1.
| 1 |
where:
- ΔSx
Entropy of transition
- ΔHx
Enthalpy of transition
- ΔTx
Transition temperature (K)
Thermogravimetric Analysis
Thermogravimetric analysis (TGA) was performed on a Q50 TGA (TA Instruments, New Castle, DE). Samples were weighed (3–4 mg) in aluminum pans, sealed with aluminum lids, and heated at 5°C/min up to 400°C. Weight loss as a function of temperature was analyzed, and a nitrogen purge of 60 ml/min was utilized.
Karl Fisher Titration
Water content in different forms of MYR was determined using a TitroLine 7500 Karl Fisher titrator (SI Analytics, Germany). Samples were analytically weighed (2–3 mg), dissolved in anhydrous methanol, and transferred to the titration vessel. A blank sample of anhydrous methanol was used to baseline the system. Samples were run in duplicate.
X-Ray Powder Diffraction
X-ray powder diffraction (XRD) was conducted with a PANalytical X’Pert MPD (PANalytical Inc., Westborough, MA) system with a copper anode (Κα radiation (λ) = 1.54 Å) at 45 kV (40 mA target current). High-resolution scans were conducted along the goniometer axis (θ/2θ) at a step size of ca. 0.0167°. Approximately 2700 scans were taken between 2θ of 5 and 50. Samples were placed on a zero background plate and rotated at 0.25 rps.
High-Performance Liquid Chromatography
Reverse-phase high-performance liquid chromatography (HPLC) was used to analyze drug concentrations from a variety of experimental conditions. Samples were analyzed with a Waters system consisting of a 2695 separation module, coupled with a 2487 dual absorbance detector (Waters Corporation, Milford, MA). Separation was achieved using a 150 mm × 3.9 mm Apollo C18 5.0 μm column. UV detection was conducted at 373 nm. An isocratic method developed for the detection of the flavonol quercetin (15) was adapted for MYR analysis. A mobile phase (50:50) consisting of methanol:acetic acid (3%) with a run time of 10 min was utilized. Standards were prepared from a roughly 500 μg/ml stock solution of MYR in 100% methanol (MeOH) and ranged from 0.5 to 200 μg/ml. The retention time for MYR was approximately 4.5 min. Samples were run with a constant flow rate of 1 ml/min and an injection volume of 10 μl. All quantifications were based on peak area.
Solubility and Dissolution Studies
Solubility values for MYR were determined by adding excess drug to scintillation vials containing 20 ml of various solvents and then agitated with a rocking shaker. Samples were collected at 30 and 60 min intervals for up to 8 h, and then again at 24 h. Additionally, dissolution studies were performed at 4, 23, 35, and 56°C. In an effort to improve solubility, so that differences in relative solubility could be distinguished, 20% ethanol (EtOH) was utilized as a cosolvent. Samples were collected at 60 min intervals for up to 8 h, then at 24 h. Sampling continued until equilibrium was reached. The solubility of MYR was also determined as a function of various cosolvents. EtOH, MeOH, glycerol (Gly), propylene glycol (PG), and polyethylene glycol 400 (PEG 400) were mixed with water (pH = 5, 0.1 M citrate buffer) in volume fractions of 0.05, 0.15, 0.3, and 0.5.
Prior to HPLC analysis, samples were filtered with a 0.2 μm PTFE filter. Potential adsorption of the drug to the filter membrane was investigated by comparing the difference in drug concentration of a standard solution (methanol) before and after filtration with the difference being less than 0.5%. All experimental conditions were performed in duplicate.
Stability Studies
Effect of pH
The effect of pH on the stability of MYR was determined using a citrate buffer in the pH range of 3–5, a phosphate buffer in the pH range of 5–8, and a borate buffer in the pH range of 8–10. Buffers were prepared to a concentration of 0.1 M and pH adjusted with NaOH and HCl as needed and with NaCl to a constant ionic strength of 0.2 M. Samples were prepared with 20% MeOH (V/V) as a cosolvent and a target MYR concentration of 100 μg/ml. Degradation was observed over 3 weeks at 23°C. Stability was determined in duplicate using the HPLC method described above. Shelf life (T90) and half-life (T50) were calculated from the degradation rate constant (κ) for each pH investigated.
Effect of Oxidation
The effects of oxidation on the stability of MYR were investigated by comparing solutions containing 1.5% hydrogen peroxide (H2O2) and adding either 0.1% ascorbic acid (AA) or 0.1% sodium metabisulfite (SMS) to assess the effectiveness of the antioxidants. EtOH was used as a cosolvent (20%) to enhance drug solubility, and degradation was observed for 3 weeks at 23°C. Stability was determined in duplicate using the HPLC method described above. Shelf life (T90) and half-life (T50) were calculated from the degradation rate constant (κ) for each system.
Effect of UV Irradiation
Stability was determined by exposing a solution of MYR in acetone to ultraviolet radiation (UVR). Samples were prepared with a target concentration of 200 μg/ml and exposed to a bank of two ultraviolet A (UVA) Sun 340 sunlamps. The lamps UV emission was between 295 and 390 nm, which includes both UVA and UVB wavelengths. Samples were exposed for 82 min for a total dose of 470 mJ/cm2. Doses stated represent the UVB portion of the lamp output. Stability was determined in duplicate using the HPLC method described above.
Partitioning
A partitioning study was conducted in order to determine the apparent partition coefficient (P) of MYR. 1-octanol was added to an equal volume of a 0.1 M citrate buffer (pH = 5). Six vials containing this mixture where kept on a shaker for 24 h at 23°C to reach equilibrium. Due to the low solubility of MYR, a slight excess of drug was added to the vials and placed back on the shaker for an additional 24 h. MYR was then allowed to separate into the two phases over 24 h. A portion of each phase was sampled, centrifuged, and filtered with a 0.2 μm PTFE filter. 1-octanol phases were diluted 1:1 with ACN, and both phases were analyzed by the HPLC method described above.
RESULTS
Thermal Analysis
Preliminary investigation revealed the existence of two different crystalline materials, identified herein as MYR I and MYR II. An overlay of the differential scanning calorimetry (DSC) and thermogravimetric analysis (TGA) for MYR I can be seen in Fig. 2. The DSC profile for MYR I showed a total of four endotherms (down) and one exotherm (up). In Fig. 2, the two sequential endotherms during the early stages of the thermal cycle represent solvent loss (water) at two distinct temperatures (onset temperature of 81°C, 128°C). The third endotherm, onset temperature of 333°C, and a peak of 343°C is believed to be a transition of a metastable anhydrous form, MYR IA, an indication of a solid-solid phase transition. The fourth endotherm, onset temperature of 363°C, and a peak of 367°C was identified to be a final melting point.
Fig. 2.

DSC/TGA overlay of MYR I starting material
TGA studies were performed, and weight loss as a function of temperature was analyzed to determine water loss from the crystal. Weight loss attributed to dehydration was used to help determine the stoichiometry of water:drug molecules present. The TGA for MYR I showed two visible plateaus with onset temperatures similar to its DSC profile (≈80 and 125°C). Total weight loss attributed to dehydration was estimated at 5.6% which represents roughly 1.04 mol of water per mole of MYR.
An overlay of the differential scanning calorimetry (DSC) and thermogravimetric analysis (TGA) for the second solid material, MYR II, is shown in Fig. 3. Like MYR I, the DSC of MYR II exhibited four endotherms. However, solvent loss (dehydration) is represented by a single endotherm (onset temperature of 50°C). The second endotherm, onset temperature of 313°C, and a peak of 318°C is believed to be a transition of a metastable anhydrous form, MYR IIA, an indication of a solid-solid phase transition. The third endotherm appears to be an additional phase transition. The fourth endotherm, onset temperature of 361°C, and a peak of 368°C was identified to be the final melting point. Additionally, the TGA curve for MYR II displayed one plateau, with weight loss beginning around 50°C resulting in 5.2% weight loss, which corresponds to 0.97 mol of water per mole of MYR.
Fig. 3.
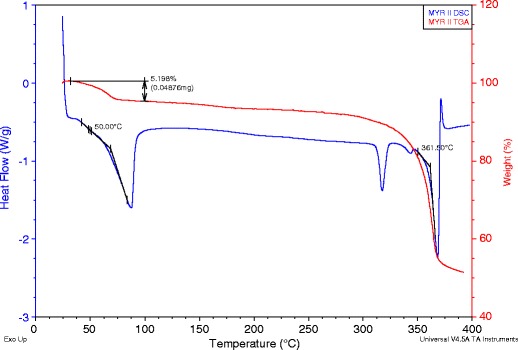
DSC/TGA overlay of MYR II starting material
Entropy of dehydration (ΔSD) and melting (ΔSM) were calculated from endotherm onset temperatures and the corresponding enthalpy of transition. These values can be seen in Table I.
Table I.
Transition Temperature and Calculated Entropy of State for Two MYR Hydrates
|
T
D-1 (°C) |
ΔS
D-1 (cal/KaMol) |
T
D-2 (°C) |
ΔS
D-2 (cal/KaMol) |
T
M
(°C) |
ΔS
M
a
(cal/KaMol) |
|
|---|---|---|---|---|---|---|
| MYR I | 81 | 12.7 | 128 | 17.4 | 363 | 11.0 |
| MYR II | 50 | 37.7 | – | – | 361 | 10.2 |
aIt should be noted that the calculated values for ΔS M may be inexact due to decomposition during the final melting
With the apparent presence of a hydrate, an attempt to desolvate the crystal was made. A sample of MYR I and MYR II (3–5 mg) was run in a DSC cycle that included an initial heating to 150°C, followed by a cool down to 40°C, and finished with a second heating to 150°C. It was confirmed (data not shown) that the dehydration endotherms were no longer present. However, some features seen in the original profiles remained, such as the solid-solid transitions and melting points.
Following these results, a quantity of both MYR starting materials were dehydrated for future studies. This was achieved by heating the sample to 150°C in the TGA, holding the temperature for 30 min, and verifying the absence of water with the DSC. Dehydrated forms are referred to as MYR IA and MYR IIA.
Karl Fisher Titration
Karl Fisher titration (KF) confirmed the presence of water in the starting material for both MYR I and MYR II. The average water content for MYR I was 4.9%, converting to an estimated 0.87 mol of water per mole of MYR. By comparison, the average water content for MYR II was 11.7%, resulting in an estimated 2.07 mol of water per mole of MYR, which is twice of that found from the TGA studies.
X-Ray Powder Diffraction
Four solid forms of MYR were characterized by X-ray powder diffraction (Fig. 4), and differences between all four diffraction patterns were seen across the full range of 2θ. Differences in the diffraction patterns of the starting materials (patterns 1, 3) confirm a different crystal structure for each hydrate. Comparing these patterns showed differences in diffraction, for example, between 10–15, 25–30, and 40–45 2θ. Similarly, when comparing MYR I and MYR IA (patterns 1, 2), substantial changes were seen in the diffraction patterns following dehydration, indicating a different crystal structure for the anhydrous form. Comparing these patterns, differences in diffraction was seen between 5–20, 25–30, and 40–45 2θ. In the case of MYR II and MYR IIA (patterns 3, 4), different diffraction patterns were also seen particularly between 25 and 30 2θ; however, the differences are less distinct, suggesting that the two crystal forms share some similar structural attributes.
Fig. 4.
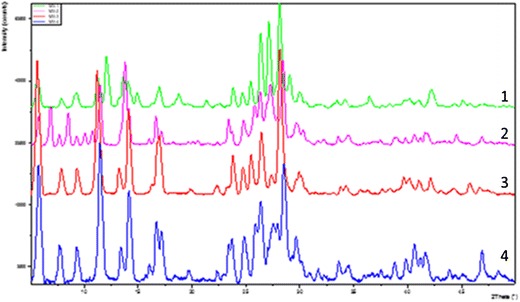
XRD overlay: MYR I (1), MYR IA (2), MYR II (3), MYR IIA (4)
Solubility Determination
Aqueous solubility of four MYR crystal forms was determined at 23°C. The dissolution profiles can be seen in Figs. 5 and 6, respectively. From Fig. 5, a difference in solubility characteristics between MYR I and MYR IA could be seen. The dissolution profile of MYR I had a maximum solubility of 1.1 μg/ml and remained relatively close to 1 μg/ml for the first 8 h until reaching an apparent equilibrium value of 0.5 μg/ml after 24 h. To the contrary, the apparent solubility of MYR IA reached a maximum of 5.0 μg/ml and began to decline more rapidly, leveling off around 3.2 μg/ml after 24 h.
Fig. 5.
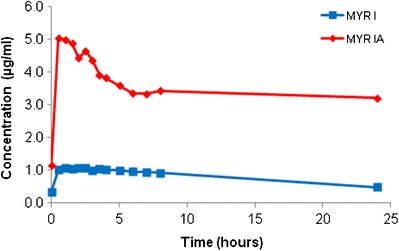
Dissolution profile of MYR I and MYR IA in water (23°C)
Fig. 6.

Dissolution profile of MYR II and MYR IIA in water (23°C)
From Fig. 6, the dissolution profiles of MYR II and MYR IIA revealed that the relative solubility difference between the two forms is not as substantial, when compared to the relative difference between form I and IA. Solubility for both MYR II and MYR IIA had a maximum value under 1 μg/ml (0.6 and 0.7 μg/ml, respectively) and after 24 h apparent equilibrium values were similar to their maximum.
Since both MYR I and MYR II can be categorized as very insoluble, further studies comparing the two were done by altering parameters to enhance the solubility. This included the addition of a cosolvent to the system and evaluating solubility at different temperatures. Dissolution studies were performed at 4, 23, 35, and 56°C. In an effort to improve solubility so that differences in relative solubility could be distinguished, 20% ethanol (EtOH) was utilized as a cosolvent. The dissolution profiles comparing the solubility of MYR I and MYR II at 23 and 35°C can be seen in Fig. 7.
Fig. 7.

Dissolution profile of MYR I and MYR II in 20% EtOH (23 and 35°C)
At 23°C, the dissolution profile in Fig. 7 showed that MYR I had an initial solubility of 12.4 μg/ml that began to decline after 2 h, reaching an apparent equilibrium solubility of 9.3 μg/ml after 24 h. At the same time, the apparent solubility of MYR II gradually reached its apparent equilibrium solubility of 12.9 μg/ml following 24 h. Data at 35°C showed that MYR I had an initial solubility of 27.2 μg/ml which began to decline after 2 h, reaching an apparent equilibrium solubility of 22.1 μg/ml after 24 h. In contrast, MYR II gradually reached its apparent equilibrium solubility of 33.1 μg/ml after 24 h.
The results from 4 to 56°C can be seen in the Arrhenius plot below in Fig. 8. In Fig. 8, logarithm solubility values (Mol/L) were plotted versus the inverse of temperature (K) and results indicate an enantiotropic-like relationship over the experimental temperature range. The MYR I series had a slope of −2.48 and a calculated enthalpy of solution (∆Hsolution) of 20.18 kJ/mol. Similarly, MYR II had a slope of −2.92 and a calculated ∆Hsolution of 23.72 kJ/mol.
Fig. 8.
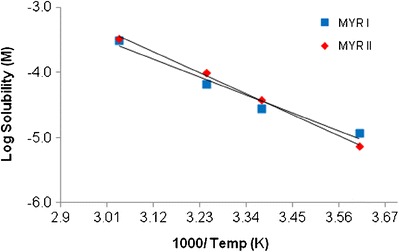
Arrhenius plot of MYR I and MYR II in 20% EtOH
Solubility of MYR was determined at pH 5 for several commonly used cosolvents, EtOH, MeOH, Gly, PG, and PEG 400. Figure 9 shows the effect of cosolvent concentration, as a function of the volume fraction, on the solubility of MYR. A general log-linear increase in solubility was seen for each cosolvent; however, there were differences in curvature. With 0.5 cosolvent, the highest increase in solubility was achieved with PEG 400 (72.8 μg/ml) while the lowest solubility was seen with Gly (10.1 μg/ml). The remaining three cosolvents had nearly identical results. Table II presents the initial solubilization slopes (σ) obtained for each cosolvent as well as the solubility determined with 0.5 cosolvent.
Fig. 9.
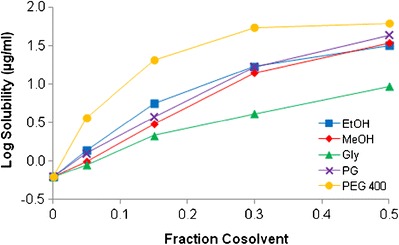
Effect of fractional cosolvent on MYR solubility (pH 5, 23°C)
Table II.
MYR I Solubility (pH 5, 23°C) with 0.5 Cosolvent
| EtOH | MeOH | Gly | PG | PEG 400 | |
|---|---|---|---|---|---|
| Solubilization slope (σ) | 3.85 | 3.93 | 2.41 | 3.96 | 9.74a |
| Solubility (μg/ml) | 49.4 | 48.5 | 10.1 | 54.7 | 72.8 |
aSlope from 0 to 15% cosolvent
Stability Studies
Drug stability can be affected by different pHs, catalyzed by either hydrogen ions or hydroxide ions and in some cases both. Stability of MYR was determined at eight different pHs ranging from 3 to 10 and utilizing different 0.1 M buffers (citrate, phosphate, and borate) at 23°C and a constant ionic strength of 0.2 M. In two instances, at pH 5 and 8, different ion species were used to compare their effect on degradation. From the kinetic rate profiles (data not shown), it was evident that MYR undergoes apparent first-order kinetics in the pH conditions investigated. The degradation rate constants (κ) were calculated from the slope of the log-linear best fit regression. Rate constants were used to plot a pH-rate profile (Fig. 10) for MYR that indicates that MYR undergoes base-catalyzed degradation.
Fig. 10.

pH-rate profile, natural logarithm of degradation rate constant (κ) versus pH (23°C)
From the degradation rate constant, half-life (T50) and shelf life (T90), defined as the time at which 10% of the drug has degraded, can be calculated. The most stable condition was pH 3 citrate buffer (T50 = 1155 h) while the least stable was pH 8 phosphate buffer (T50 = 0.1 h). A summary of the data can be seen in Table III. No pH change was noted in any of the samples over the course of the study.
Table III.
Degradation Rate Constant, Half-Life, and Shelf Life for MYR at Various pHs
| pH (buffer) | κ (per h) | T 50 (h) | T 90 (h) |
|---|---|---|---|
| 3 (Citrate) | 0.0006 | 1155 | 175 |
| 5 (Citrate) | 0.001 | 630 | 95.5 |
| 5 (Phosphate) | 0.004 | 198 | 30 |
| 8 (Phosphate) | 11.6 | 0.1 | 0.01 |
| 8 (Borate) | 0.1 | 7.0 | 1.1 |
| 10 (Borate) | 2.2 | 0.3 | 0.1 |
Accelerated oxidation can be achieved with the aid of peroxides. In low concentrations, hydrogen peroxide will produce primary oxidative degradation products and stability can be analyzed over time. From the kinetic rate profile (Fig. 11), it appeared that MYR undergoes apparent first-order kinetics.
Fig. 11.
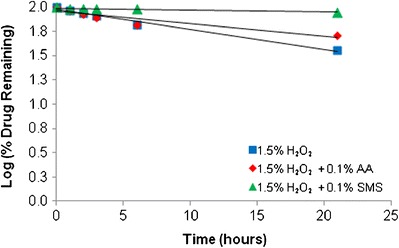
Effect of oxidation (20% EtOH, 23°C)
MYR seemed to be fairly labile in a 1.5% H2O2 solution (T50 = 14.6 days). A moderate improvement in stability was seen when adding 0.1% of the anti-oxidant ascorbic acid (AA) (T50 = 23.7 days) whereas a greater improvement was seen with the addition of 0.1% sodium metabisulfite (SMS) (T50 = 143.5 days).
To investigate light stability, a solution of MYR in acetone (≈200 μg/ml) was dosed with 470 mJ/cm2 of UVR. Following exposure, there was approximately 87% of the initial MYR concentration remaining.
Partitioning Study
An average of six measurements of MYR added to 1:1 1-octanol:water was used to determine the partition coefficient. The concentration of MYR in the 1-octanol phase was determined to be 870 times higher than in the aqueous phase. The resulting oil/water partition coefficient (log P) is therefore 2.94. This value is in agreement with the 1:10 and 1:5 n-octanol:water data reported (11).
DISCUSSION
Presented data supports the existence of two hydrated forms and two metastable anhydrous forms of MYR which have not previously been reported. It has been estimated that one third of active pharmaceutical substances are capable of forming a hydrate (16). In most cases, hydrates contain water molecules within the crystal lattice that are bound at either isolated or channel sites (17). The addition of the water molecule(s) in the crystal can alter the physical structure including changes to the shape, symmetry, and capacity of the unit cell (18). These changes can lead to differences in pharmaceutical properties such as solubility and chemical stability (18).
The different thermal profiles of the MYR starting materials, particularly the different onset dehydration temperatures, suggests a difference between the two drug lots that is due to different hydrate crystal structures. For example, the sharper DSC dehydration endotherm of MYR I, along with the high dehydration temperature, is more typical of hydrates that contain isolated binding sites (17). The broader dehydration endotherm along with its low onset temperature, seen with MYR II, is characteristic of a channel binding hydrate (17). The presence of water in the starting materials was confirmed by Karl Fischer titration, while the stoichiometry of the water:drug molecules was calculated by the weight loss determined from the TGA. It was found that both MYR I and MYR II had roughly 1 mole of water per mole of drug.
XRD analysis of the two starting material lots and their respective dehydrates confirmed the presence of four unique crystal structures. Differences between all four diffraction patterns were seen; however, the similarity of MYR II and MYR IIA patterns suggests the possibility of MYR IIA existing as an isomorphic desolvate (19). An isomorphic desolvate is characterized as a desolvate that essentially retains the crystalline structure of the parent solvate and are often identified through similarities between XRD patterns (19). Additionally, isomorphic desolvates are generally considered to be highly hygroscopic, possessing low-energy activation for rehydration (19). Similarities in the crystal structures of MYR II and MYR IIA could explain the similarities seen in their water solubility profiles discussed below.
In addition to solid-state studies, solubility and dissolution profiles were acquired for the different crystal forms. At room temperature, both metastable forms of MYR (MYR IA and MYR IIA) had higher apparent aqueous solubility following 24 h than the hydrated forms (MYR I and MYR II); however, these differences in solubility were not equal. For example, MYR I had an apparent solubility of 0.5 μg/ml following 24 h whereas MYR IA, due to the metastable nature of the crystal, had an apparent solubility of 3.2 μg/ml after 24 h. Solubility for both MYR II and MYR IIA were relatively similar (0.6 and 0.7 μg/ml, respectively) after 24 h suggesting the metastable form (MYR IIA) retained some crystalline features from the parent hydrate (MYR II). Surprisingly, the dissolution rates for all of the crystal forms were relatively high considering that the intrinsic solubilities are very low. Since both MYR hydrates possess a unique DSC profile, potential conversion between crystal forms was investigated. Following a 7-day period, excess solid was sampled from a solubility study (23°C) and DSC profiles indicated that neither MYR IA nor MYR IIA had reverted back to a hydrated state nor did either hydrate convert to another form. Solubility studies comparing the two hydrate forms were conducted at four temperatures (4, 23, 35, and 56°C) and aided by the addition of a cosolvent (20% EtOH). It was observed that MYR I had lower solubility at 23, 35, and 56°C indicating that it appears to be the more stable crystal hydrate. Interestingly, these results were reversed at 4°C, but it must be noted that the solubility differences between the two hydrates are small.
Solubility studies were also performed with various cosolvents and were conducted at 23°C. While all of the cosolvents provided an increase in solubility in a log-linear fashion (exponential increase), the resulting solubilities were all less than 100 μg/ml. In fact, even for the most nonpolar cosolvent, PEG 400, the solubility was only 72.8 μg/ml using 50% cosolvent. Based on these studies, the use of cosolvents will have limited applicability in solubilizing aqueous solutions of MYR.
Stability of MYR under various pH conditions, oxidative stress, and UV irradiation was also evaluated at 23°C. The pH-rate profile showed that MYR undergoes base-catalyzed degradation. Interestingly, the slope from pH 5 (citrate) to pH 10 (borate) is 1.5 with an R2 = 0.99, potentially indicating that in addition to base catalysis, there may be other mechanism of degradation occurring. From the data, it was evident that the stability of MYR is highly dependent on pH. In fact, stability varied nearly 10 log units between the maximum and minimum rate of degradation. In addition, it is important to consider buffer type when developing future formulations. Accelerated degradation was seen with phosphate buffer, as evidenced by pH 8 borate buffer having a T50 = 7.0 h, while pH 8 phosphate had a T50 = 0.1 h. Likewise, at pH 5, the citrate samples had a T50 = 630 h, while phosphate had a T50 = 198 h.
MYR was seen to be fairly labile when introduced to an oxidizing agent. From the chemical structure, it is evident that MYR contains several hydroxyl groups which can be susceptible to a number of oxidation reactions, when exposed to a peroxide, including nucleophilic addition reactions (20). Degradation as a result of oxidation can often be stabilized by the addition of antioxidants (21). In this study, improved stability was achieved with addition of ascorbic acid and sodium metabisulfite, with greater stability seen in the latter. Both antioxidants can be classified as sacrificial reductants, which effectively scavenge oxygen while being consumed themselves (20).
Exposure to UVA and UVB has been shown to cause DNA damage, erythema, immunosuppression, and eventually, skin cancer (22,23). Following a dose of 470 mJ/cm2 of UVR, MYR was found to degrade roughly 13% from its original concentration. Observed stability is indeed relevant, as this UVR dose represents more than double the minimal erythema dose (MED) for sun reactive skin type VI and far exceeds the MED for skin types I to V (24).
A log P value of −0.04 was initially calculated by the software ACD/Chemsketch (25). Experimental determination of MYR log P resulted in a value of 2.94, nearly 1000× greater than originally estimated. Thus, the very low aqueous solubility of MYR can be attributed to the combination of crystal component and lower than expected log P.
CONCLUSIONS
Solid-state characterization of four forms of MYR, two hydrates and two metastable forms, was conducted. Data supports the two hydrates containing different binding sites for the included water, with MYR I likely an isolated hydrate and MYR II likely a channel hydrate. Solubility studies also confirmed that the most stable form at 23, 35, and 56°C was MYR I. Overall, MYR was shown to be poorly soluble in water, with modest improvements seen with the addition of various cosolvents, particularly PEG 400.
Stability studies indicated that MYR undergoes rapid apparent first-order degradation under basic pH conditions and that degradation can be influenced by buffer species with accelerated degradation seen in phosphate buffers. Apparent first-order degradation was also seen when MYR was exposed to an oxidizing solution. Improved stability was achieved after introducing 0.1% antioxidants to the solution, with the greatest improvement seen with sodium metabisulfite. Following a dose of UVR, MYR was found to have good stability, which is a consideration for topical applications. Finally, a partitioning study indicated that MYR possess a log P (2.94). Both the solid-state properties and solution stability of MYR are important to consider when developing future formulations.
Acknowledgments
The project described was supported by Award Numbers P01CA027502 and K07CA132956, both from the National Cancer Institute. The content is solely the responsibility of the authors and does not necessarily represent the official views of the National Cancer Institute or the National Institutes of Health.
Conflict of Interest
The authors report no conflicts of interest.
References
- 1.Hakkinen SH, Karenlampi SO, Heinonen IM, Mykkanenm HM, Torronen AR. Content of the flavonols quercetin, myricetin, and kaempferol in 25 edible berries. J Agric Food Chem. 1999;47:2274–9. doi: 10.1021/jf9811065. [DOI] [PubMed] [Google Scholar]
- 2.Hertog MGL, Fresken EJM, Hollman PCH. Dietary antioxidative flavonoids and risk of coronary heart disease: the Zutphen Elderly Study. Lancet. 1999;342:1007–11. doi: 10.1016/0140-6736(93)92876-U. [DOI] [PubMed] [Google Scholar]
- 3.Surh YJ. Cancer chemoprevention with dietary phytochemicals. Nat Rev Cancer. 2003;3:768–80. doi: 10.1038/nrc1189. [DOI] [PubMed] [Google Scholar]
- 4.Ribeiro de Lima MT, Waffo-Teguo P, Teissedre PL. Determination of stilbenes (trans-astringin, cis and trans-piceid, and cis and trans-resveratrol) in Portuguese wines. J Agric Food Chem. 1999;47:2666–70. doi: 10.1021/jf9900884. [DOI] [PubMed] [Google Scholar]
- 5.Lee KW, Kang NJ, Rogozin EA. Myricetin is a novel natural inhibitor of neoplastic cell transformation and MEK1. Carcinogenesis. 2007;28:1918–27. doi: 10.1093/carcin/bgm110. [DOI] [PubMed] [Google Scholar]
- 6.Jung SK, Lee KW, Byun S. Myricetin suppresses UVB-induced skin cancer by targeting Fyn. Cancer Res. 2008;68:6021–9. doi: 10.1158/0008-5472.CAN-08-0899. [DOI] [PubMed] [Google Scholar]
- 7.Li Y, Ding Y. Therapeutic potential of myricetin in diabetes mellitus. Food Sci Hum Well. 2013;1:19–25. doi: 10.1016/j.fshw.2012.08.002. [DOI] [Google Scholar]
- 8.Lauro MR, Torre ML, Maggi L, De Simone F, Conte U, Aquino RP. Fast-and slow-release tablets for oral administration of flavonoids: rutin and quercetin. Drug Dev Ind Pharm. 2002;28:371–9. doi: 10.1081/DDC-120002998. [DOI] [PubMed] [Google Scholar]
- 9.Hong C, Xie Y, Yao Y, Li G. A novel strategy for pharmaceutical cocrystal generation without knowledge of stoichiometric ratio: myricetin cocrystals and a ternary phase diagram. Pharm Res. 2015;32:47–60. doi: 10.1007/s11095-014-1443-y. [DOI] [PubMed] [Google Scholar]
- 10.Dang Y, Lin G, Xie Y, Duan J. Quantitative determination of myricetin in rat plasma by ultra performance liquid chromatography tandem mass spectrometry and its absolute bioavailability. Drug Res. 2013;64:516–22. doi: 10.1055/s-0033-1363220. [DOI] [PubMed] [Google Scholar]
- 11.Yao Y, Lin G, Xie Y, Ma P. Preformultation studies of myricetin: a natural antioxidant flavonoid. Pharmazie. 2014;69:19–26. [PubMed] [Google Scholar]
- 12.Lucas-Abellán C, Fortea I, Gabaldón JA. Encapsulation of quercetin and myricetin in cyclodextrins at acidic pH. J Agric Food Chem. 2008;56:255–9. doi: 10.1021/jf0720640. [DOI] [PubMed] [Google Scholar]
- 13.Wang S, Ye T, Zhang X, Yang R, Yi X. Myricetin microemulsion for oral drug delivery: formulation optimization, in situ intestinal absorption and in-vivo evaluation. Asian J Pharm Sci. 2013;8:18–27. [Google Scholar]
- 14.Sowa M, Ślepokura K, Matczak-Jon E. A 1:1 pharmaceutical cocrysral myricetin in combination with uncommon piracetam conformer: x-ray single crystal analysis and mechanochemical synthesis. J Mol Struct. 2014;1058:114–21. doi: 10.1016/j.molstruc.2013.10.071. [DOI] [Google Scholar]
- 15.Chen-Yu G, Chun-fen Y, Qi-lu L, Qi T. Development of a quercetin-loaded nanostructured lipid carrier formulation for topical delivery. Int J Pharm. 2014;430:292–8. doi: 10.1016/j.ijpharm.2012.03.042. [DOI] [PubMed] [Google Scholar]
- 16.Qu H, Munk T, Cornett C. Influence of temperature on solvent-meditated anhydrate-to-hydrate transformation kinetics. Pharm Res. 2011;28:364–73. doi: 10.1007/s11095-010-0281-9. [DOI] [PubMed] [Google Scholar]
- 17.Brittain HG, Morris KR, Boerrigter SXM. Structural aspects of solvatomorphic systems. In: Brittain HG, editor. Polymorphism in pharmaceutical solids. 2. New York: Informa Healthcare Inc; 2009. pp. 233–81. [Google Scholar]
- 18.Grant D, Khankari RK. Pharmaceutical hydrates. Thermochim Acta. 1995;248:61–79. doi: 10.1016/0040-6031(94)01952-D. [DOI] [Google Scholar]
- 19.Stephenson GA, Groleau EG, Kleeman RL. Formation of isomorphic desolvates: creating a molecular vacuum. J Pharm Sci. 1998;87:536–42. doi: 10.1021/js970449z. [DOI] [PubMed] [Google Scholar]
- 20.Waterman KC, Adami RC, Alsante KM, Hong J. Stabilization of pharmaceuticals to oxidative degradation. Pharm Dev Technol. 2002;7:1–32. doi: 10.1081/PDT-120002237. [DOI] [PubMed] [Google Scholar]
- 21.Yoshioka S, Stella VJ. Stability of drugs and dosage forms. 1. New York: Kluwer Academic/Plenum; 2000. [Google Scholar]
- 22.Melnikova VO, Ananthaswamy HN. Cellular and molecular events leading to the development of skin cancer. Mutat Res. 2005;571:91–106. doi: 10.1016/j.mrfmmm.2004.11.015. [DOI] [PubMed] [Google Scholar]
- 23.Setlow RB. The wavelengths in sunlight effective in producing skin cancer: a theoretical analysis. Proc Natl Acad Sci U S A. 1974;71:3363–6. doi: 10.1073/pnas.71.9.3363. [DOI] [PMC free article] [PubMed] [Google Scholar]
- 24.Fitzpatrick TB. The validity and practicality of sun-reactive skin types I through VI. Arch Dermatol. 1998;24:869–71. doi: 10.1001/archderm.124.6.869. [DOI] [PubMed] [Google Scholar]
- 25.ACD/Chemsketch for Windows. Version 12.0. Advanced Chemistry Development Inc.


