

Abstract
Polyethylene oxide has been researched extensively as an alternative polymer to hydroxypropyl methylcellulose (HPMC) in controlled drug delivery due to its desirable swelling properties and its availability in a number of different viscosity grades. Previous studies on HPMC have pointed out the importance of particle size on drug release, but as of yet, no studies have investigated the effect of particle size of polyethylene oxide (polyox) on drug release. The present study explored the relationship between polymer level and particle size to sustain the drug release. Tablets produced contained theophylline as their active ingredient and consisted of different polyethylene oxide particle size fractions (20–45, 45–90, 90–180 and 180–425 μm). It was shown that matrices containing smaller particle sizes of polyox produced harder tablets than when larger polyox particles were used. The release studies showed that matrices consisting of large polyox particles showed a faster release rate than matrices made from smaller particles. Molecular weight (MW) of the polymer was a key determining step in attaining sustained release, with the high MW of polyox resulting in a delayed release profile. The results showed that the effect of particle size on drug release was more detrimental when a low concentration of polyox was used. This indicates that care must be taken when low levels of polyox with different particle size fractions are used. More robust formulations could be obtained when the concentration of polyox is high. Differential scanning calorimetry (DSC) traces showed that particle size had no major effect on the thermal behaviour of polyox particles.
KEY WORDS: DSC traces, particle size, polyox, sustained release, theophylline
INTRODUCTION
Controlled release dosage forms are formulated in a manner that the contained drug is available over an extended period of time following administration. This process is conducted by using certain polymers such as hydroxypropyl methylcellulose (HPMC) or polyethylene oxide (PEO) in which the drug is dispersed homogenously throughout the polymer matrix. Upon contact with an aqueous medium, the polymer physically swells to form a hydrogel layer allowing drug release through the outer surface of the gel (1, 2).
Polyethylene oxide (PEO) is a synthetic nonionic linear homopolymer of ethylene oxide (3). It is available commercially under the trade name of polyox. PEO is synthesised by reacting ethylene oxide with a catalyst such as silver or platinum (4). PEO is represented with a molecular formula of (OCH2CH2)n, where ‘n’ is the average number of oxyethylene groups which can range from 100,000 to 7,000,000 Da. Its appearance is a waxy white solid accompanied with a light ammonium odour and a melting point varying from 62 to 67°C depending on its molecular weight (5).
PEO has been widely used as a controlled release excipient due to its desirable hydration and sustained release properties. PEO is nonirritant, nontoxic and is being researched extensively an alternative to HPMC in controlled release dosage forms (6–8). It exhibits a crystalline structure (9), giving it good binding and lubricating and film-forming properties. This allows PEO to be used in various tablet manufacturing techniques such as matrix systems for oral controlled release as well as being suitable to be used as a thickening agent and a tablet coater (10–13).
Mitchell et al. (14) investigated the influence of particle size of HPMC on the dissolution rate of propranolol HCl from the matrices. The findings showed that the release rate generally decreased as the particle size fraction decreased from 350 to 150 μm. This was due to a larger particle size requiring more time for the dissolution medium to penetrate, resulting in a burst release of drug before a gel barrier is formed. On the other hand, small HPMC particles could form a sufficiently complete gel barrier before any burst effect could occur (15). Further decrease of the polymer particle size led to a significant reduction of the gel layer porosity, but an increase in its tortuosity; therefore, drug release depended on a combination of both erosion and diffusion (16–18).
Theophylline is a methylxanthine drug used to treat respiratory diseases such as asthma and chronic obstructive pulmonary disease. Chemically, theophylline is 1,3-dimethyl-7H-purine-2,6-dione. Theophylline shows medium solubility and has biphasic solubility; it also has a low molecular weight (19). Differences in the half-life of theophylline are important because the toxic dose is close to the therapeutic dose, although the use of theophylline CR has been used for many years (20). For theophylline, it is beneficial to have a steady plasma concentration over night to reduce symptoms experienced early in the morning; hence, preparation of a sustained release formulation for theophylline is highly beneficial.
Although there are many studies on the effect of HPMC particle size of release behaviours of various drugs, to best of our knowledge, there is no systematic and comprehensive studies to explore the relationship between polyox particle size and polyox level used in matrix tablets to sustain the drug release. Therefore, the aim of the present research was to investigate the effect of PEO particle size and concentration simultaneously on the release behaviour of theophylline using high molecular weight PEO 303 and low molecular weight PEO 750. In addition, DSC was used to investigate the thermal behaviour of polyox with different particle sizes.
MATERIALS AND METHODS
Materials
PEO grades Polyox WSR 750 (ID166255) MW = 3 × 10⁵ and PEO 303 Polyox WSR 303 (ID166227) MW = 7 × 10⁶ produced by Dow Chemical (Philadelphia, USA) and distributed by Colorcon (Kent, UK) were used. The drugs theophylline (THF) and magnesium stearate were purchased from Sigma (Gillingham, UK). Lactose (α-lactose monohydrate) was donated from DMV International, Netherlands.
Particle Size Fractions of Polyethylene Oxides
Different particle size fractions of PEO 750 and 303 were obtained using an Endecott sieve shaker with different sieve meshes (20–45, 45–90, 90–180 and 180–425 μm) which operated for 10 min, in which the respected size fractions of polyox were collected.
Particle Size Analyses
A Sympatec HELOS/RODOS (Clausthal-Zellerfeld, Germany) laser diffraction particle size analyser was used to confirm the particle size fraction obtained through the mechanical sieving technique and also for the determination of volume-weighted particle size of polyox samples. A test reference measurement was performed with the HELOS sensor using WINDOX software followed by a standard measurement. The detail of the used method was described elsewhere (21).
Preparation of Formulations
The materials required for the tablet formulation were individually weighed and then mixed altogether for 10 min (except magnesium stearate) using a TURBULA® blender (Maschinenfabrik, Basel, Switzerland) at a constant speed of 100 rpm. Magnesium stearate was mixed with the final mixture for further 2 min. Theophylline was mixed with PEO 750 or PEO 303 at 20% concentration (formulation series A and B, respectively), and in the second part of the study, 40% PEO 750 or PEO 303 was prepared as formulation series C and D, respectively. The compositions of these tablets for all series are summarised in Table I.
Table I.
Formulations Investigated Containing Theophylline Mixed with PEO 750 at 20% Concentration (Formulation A), PEO 303 at 20% Concentration (Formulation B), PEO 750 at 40% Concentration (Formulation C) and PEO 303 at 40% Concentration (Formulation D)
| Materialsa | PEO (%) | Lactose (%) | Mg stearate (%) |
|---|---|---|---|
| Formulation series A | |||
| A1: PEO 750 (20–45 μm) | 20 | 29 | 1 |
| A2: PEO 750 (45–90 μm) | 20 | 29 | 1 |
| A3: PEO 750 (90–180 μm) | 20 | 29 | 1 |
| A4: PEO 750 (180–425 μm) | 20 | 29 | 1 |
| Formulation series B | |||
| B1: PEO 303 (20–45 μm) | 20 | 29 | 1 |
| B2: PEO 303 (45–90 μm) | 20 | 29 | 1 |
| B3: PEO 303 (90–180 μm) | 20 | 29 | 1 |
| B4: PEO 303 (180–425 μm) | 20 | 29 | 1 |
| Formulation series C | |||
| C1: PEO 750 (20–45 μm) | 40 | 9 | 1 |
| C2: PEO 750 (45–90 μm) | 40 | 9 | 1 |
| C3: PEO 750 (90–180 μm) | 40 | 9 | 1 |
| C4: PEO 750 (180–425 μm) | 40 | 9 | 1 |
| Formulation series D | |||
| D1: PEO 303 (20–45 μm) | 40 | 9 | 1 |
| D2: PEO 303 (45–90 μm) | 40 | 9 | 1 |
| D3: PEO 303 (90–180 μm) | 40 | 9 | 1 |
| D4: PEO 303 (180–425 μm) | 40 | 9 | 1 |
PEO polyethylene oxide, Mg magnesium
aThe amount of theophylline in each formulation was 50%, and the total weight of each table was 350 mg.
True Density Measurements of Formulation Powders
In order to evaluate any changes in the true density of powders, an ULTRAPYCNOMETER 1000 (Quantachrome, USA) was used. In this test, helium gas was used to measure the true volume of the samples, hence, the true density. To carry out the test, 3–5 g of sample was used and the experiment was repeated three times to obtain the mean and standard deviation.
Differential Scanning Calorimetry (DSC)
Differential scanning calorimetry (DSC) measurements were carried out using the METTLER TOLEDO DSC822e (Switzerland). The DSC pans were filled with 4–5 mg of blended powder of each formulation tested. The DSC pans were then sealed using a METTLER TOLEDO press. The temperature range scanned was between 25 and 250°C, with a heating rate of 10°C/min.
Preparation of Tablets
A specific amount (350 mg) of the blended powder containing 1% magnesium stearate was compressed at 1000 psi using a tablet press (ENERPAC Hydraulic Press RC-53, USA), fitted with 10-mm round and flat-faced punches. Magnesium stearate was required for easy ejection of the tablets from the die.
Hardness of Tablets
The hardness of each tablet was measured using Dr. Schleuniger Pharmatron Tablet Tester (Switzerland). The hardness data were reported which is the mean and standard deviation of minimum three determinations.
Porosity Determination of Tablets
In order to calculate the porosity, the dimension of tablets was measured using an electronic digital calliper (Fisher Scientific, UK), and the true density of the powder mixtures was obtained using an ULTRAPYCNOMETER 1000 (Quantachrome Instruments, UK). The following equation was used to calculate the porosity of tablets before the start of the dissolution test.
| 1 |
Dissolution Studies
Dissolution testing of the tablets was carried out using a dissolution tester ERWEKA DT 700 (Germany). The USP paddle method (22) (USP apparatus II) was used with the paddle rotating at 100 rpm, 900 mL de-ionised water maintained at 37 ± 0.5°C. Each dissolution test was carried out for a total of 12 h. The UV absorption of the samples was determined by UV spectrophotometer (Shimadzu, Japan) at 271 nm for theophylline. Dissolution tests for each size fraction were performed in triplicate.
Dissolution Parameters
Dissolution efficiency (DE12h) and mean dissolution time (MDT) were used to evaluate the dissolution behaviour from various preparations. The dissolution efficiency (DE) of a pharmaceutical dosage form is defined as the area under the dissolution curve up to a certain time, t, expressed as percentage of the area of the rectangle described by 100% dissolution in the same time (Eq. 2) (23):
| 2 |
where y is the percent drug release as the function of time, t, t is the total time of drug release and y100 is 100% drug release. An alternative parameter that describes the dissolution rate is the mean dissolution time (MDT); the most likely time for a molecule to be dissolved from a solid dosage form. Therefore, MDT is the mean time for the drug to dissolve under in vitro dissolution conditions. This is calculated using Eq. 3.
| 3 |
where j is the sample number, tj is the midpoint of the jth time period (easily calculated with [t + (t − 1)] / 2) and ΔMj is the additional amount of drug dissolved between tj and t – 1.
Similarity Factor (f2)
To determine the similarity between the obtained drug release profiles, the f2 factor proposed by Moore and Flanner (24) was calculated according to Eq. 4.
| 4 |
This is a mathematical treatment of the dissolution data where n is the number of test points for the samples, Rt is the reference assay at time point t, and Tt is the test assay at time point t. An f2 value between 50 and 100 suggests a similarity between the two release profiles, and the closer the value is to 100, the more similar or identical the profiles are. Also, dissimilarity occurs with decreasing values less than 50 (24).
Swelling Index Determination
The rate of swelling (swelling index) was determined by equilibrium weight gain method. The pure polyox tablets were accurately weighed (W0), placed in the small containers with the metal mesh underneath the tablets. Another mesh was placed at the top of the container to make sure the tablets are kept inside the chamber. The small containers containing the tablets were placed in the bottom of the dissolution vessels containing the dissolution medium. In order to mimic the in vitro dissolution conditions, the paddles were used to stir the dissolution medium at a rate of 100 rpm at 37°C. At different time intervals, each container was removed from the dissolution vessel and the tablet was lightly blotted with tissue paper to remove excess dissolution medium. Then, the tablet was weighed (W1) on an analytical balance (model AG204, METTLER TOLEDO, Switzerland). The experiment was performed in triplicate for each time point, and fresh samples were used for each individual time point. The percentage increase in weight of each tablet due to water absorption or water uptake was calculated using the following equation:
| 5 |
Viscosity Measurement
Polyox samples were prepared at a 1% w/v concentration in distilled water using gentle agitation on a radial shaker for 12 h at 25°C. They were tested using a BROOKFIELD Model DV-II+ Pro viscometer (Harlow, UK) using spindles 61 and 62 for polyox 303 and 750, respectively, with a rotation speed of 60 rpm. Results presented are an average of three runs.
RESULTS AND DISCUSSION
Effect of Particle Size on Tablet Properties
In this study, the results showed that the hardness of tablets decreased with increasing the particle size of polyox (Table II). This could be due to a difference in the surface area of particles available for bonding. Smaller particles show a higher ratio of surface/volume compared to a larger particle size. The above discussion is valid as it has been shown that both polyox (25) and theophylline (26) undergo plastic deformation (not brittle fracture behaviour). Therefore, under the compression, bonding between small particles is much stronger than larger particles due to the greater number of particles available for bonding. For example, the average hardness for theophylline tablets made from PEO 303 (20%) with the particle size fractions 25–40 and 90–180 μm was 61 and 54 N, respectively. A similar pattern was shown in case of tablets made from lower molecular weight PEO 750 (formulation series A and C; Table II).
Table II.
Average Mean Diameter, Hardness, True Density and n Value (Mechanism of Drug Release) for Different Formulations Under Investigation
| Materials | Mesh size range (μm) | Mean diameter (μm) | Hardness (N) | Porosity of tablets (%) | n |
|---|---|---|---|---|---|
| Formulation series A | |||||
| A1: THF-PEO750 20% | 20–45 | 31.8 ± 1.0 | 61.0 ± 0.2 | 4.98 ± 1.63 | 1.11 |
| A2: THF-PEO750 20% | 45–90 | 54.8 ± 0.2 | 59.0 ± 0.2 | 5.11 ± 1.56 | – |
| A3: THF-PEO750 20% | 90–180 | 128.4 ± 0.3 | 56.0 ± 1.0 | 6.25 ± 1.25 | – |
| A4: THF-PEO750 20% | 180–425 | 276.9 ± 0.1 | 54.0 ± 0.5 | 7.34 ± 0.80 | a |
| Formulation series B | |||||
| B1: THF-PEO303 20% | 20–45 | 30.8 ± 0.4 | 52.0 ± 0.4 | 4.85 ± 0.76 | 0.82 |
| B2: THF-PEO303 20% | 45–90 | 110.6 ± 0.2 | 50.0 ± 1.0 | 5.91 ± 1.23 | – |
| B3: THF-PEO303 20% | 90–180 | 131.0 ± 0.3 | 47.0 ± 0.5 | 7.29 ± 1.11 | – |
| B4: THF-PEO303 20% | 180–425 | 292.0 ± 0.5 | 45.0 ± 0.2 | 8.92 ± 0.25 | 0.66 |
| Formulation series C | |||||
| C1: THF-PEO750 40% | 20–45 | 69.0 ± 0.9 | 66.0 ± 0.8 | 4.20 ± 1.63 | 1.51 |
| C4: THF-PEO750 40% | 180–425 | 261.5 ± 0.2 | 60.0 ± 1.0 | 7.01 ± 1.05 | 0.90 |
| Formulation series D | |||||
| D1: THF-PEO303 40% | 20–45 | 33.4 ± 0.6 | 56.0 ± 0.5 | 6.96 ± 1.40 | 0.96 |
| D4: THF-PEO303 40% | 180–425 | 240.8 ± 0.5 | 53.0 ± 0.1 | 3.99 ± 1.26 | 0.59 |
a drug release was too quick to calculate n value, en dash these formulations have not been selected for further analysis, THF theophylline, PEO polyethylene oxide
Effect of Particle Size on Dissolution Rate
Drug release profiles of PEO matrices with different particle size fractions are shown in Fig. 1. It is seen in Fig. 1a that for the matrices made from low molecular weight polyox (PEO 750) at the first 30 min, a large amount of the drug (above 60%) is released from matrices containing a large particle size of polyox. This is referred to as burst release and can be explained as follows. Coarser fractions of the polymer hydrate too slowly thus allowing water to penetrate into the centre of the matrix at a much faster rate resulting in the burst release of the drug (27, 28). Furthermore, the smaller size fractions of the polymer possess a larger surface area compared to larger particles, enhancing polymer-water contact resulting in the formation of a gel barrier much faster, thus, preventing premature drug release (14, 27, 29). This was supported by the difference in percentage water uptake by different particle sizes of polyox 750 (for smaller particles, 20–45 μm, %water uptake was 265 ± 48 versus 152 ± 35% for larger particles, 180–450 μm within the first 30 min of the swelling test). A similar conclusion was drawn for tablets containing polyox 303 tablets (336 ± 50% increase in the weight of tablets containing the smallest particle size versus 275 ± 49% increase in the weight of tablets when a larger particle size of polyox 303 was used).
Fig. 1.
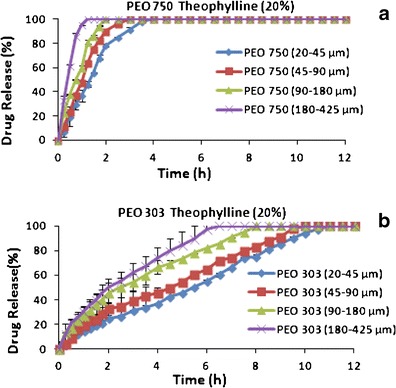
Effect of molecular weight and particle size on theophylline drug release containing of 20% polymer. a Polyox 750. b Polyox 303
In addition, the porosity of tablets made from a larger particle size of polyox 750 (7.34 ± 0.80%) was much higher than the porosity of polyox 750 tablets when a smaller particle size (4.98 ± 1.63%) was used (Table I).
To confirm the above findings, the similarity factor (f2) was calculated and data are presented in Table III. This table shows that as all f2 values for polyox 750 and 303 are less than 50 (when 20% polyox was used) which is an indication of no similarity between polyox formulations with different particle sizes. All these f2 values supported the conclusion drawn for the release profiles of various PEO-particle size theophylline matrix tablets.
Table III.
f 2 Values of Various Particle Sizes PEO 750/303 Matrices with 20 and 40% PEO Concentrations. Fraction 20–45 μm Was Used as a Control
| PEO grade | Particle sizes (μm) | f 2 (20%) | f 2 (40%) |
|---|---|---|---|
| 750 | 45–90 | 25.7 | – |
| 90–180 | 21.1 | – | |
| 180–425 | 15.4 | 76.7 | |
| 303 | 45–90 | 34.7 | – |
| 90–180 | 24.6 | – | |
| 180–425 | 21.0 | 44.4 |
PEO polyethylene oxide
Dissolution efficiency (DE12h) and mean dissolution time (MDT) were used to represent the dissolution rate from various polyox matrices (Table IV). Dissolution efficiency values are consistent with dissolution profiles confirming that the drug release rate from PEO 750 and 303 matrices is faster in the case of larger PEO particles. For instance, the DE value of matrices made from size fraction of 20–45 μm, PEO 750 was 88.0% whereas this value increased to 96% for matrices made from particle size fraction 180–425 μm. This was also the case for matrices containing high molecular weight polyox (PEO 303) which DE increased from 56% for the fraction 20–45 μm to 79% for the fraction 180–425 μm. The results obtained for MDT confirmed the same trend for both low and high molecular weight PEO. For instance, MDT for PEO 750 with particle size fraction 20–45 μm was 1.42 h while this value decreased to 0.44 h in the case of a larger fraction (180–425 μm) which is an indication of fast drug release from polyox matrices made from the larger particle size (Table IV).
Table IV.
Effect of Particle Size on Dissolution Parameters of PEO Matrices with 20% Polymer
| PEO | Particle sizes (μm) | DE (%) | MDT (h) |
|---|---|---|---|
| PEO 750 | 20–45 | 88.0 | 1.42 |
| 45–90 | 91.0 | 1.08 | |
| 90–180 | 93.0 | 0.88 | |
| 180–425 | 96.4 | 0.44 | |
| PEO 303 | 20–45 | 56.0 | 5.20 |
| 45–90 | 63.0 | 4.44 | |
| 90–180 | 74.0 | 3.09 | |
| 180–425 | 79.0 | 2.49 |
DE dissolution efficiency, MDT mean dissolution time, PEO polyethylene oxide
Figure 1 also shows the difference in dissolution profiles of theophylline containing different molecular weights of polyox when the same particle size was used. It can be seen that the molecular weight of the polyox was the determining factor in achieving sustained release in theophylline matrices. The matrices made from high molecular weight (PEO 303) exhibited a longer drug release profile compared to matrices made from low molecular weight (PEO 750) (comparing Fig. 1a, b). Such results could be explained as follows. Polyox swells up upon contact with the dissolution medium. High molecular weight polyox forms a gel layer, which is much thicker and less liable to dissolve, acting as a barrier against drug release hence slowing down the drug release extensively. On the other hand, low molecular weight polyox produces a hydrogel that has a much thinner and softer structure thus not acting as a strong barrier and making the gel layer more susceptible to erosion (30–32). This was also supported by percentage water uptake by different molecular weight of polyox for the same particle size and also by the viscosity data. For example, the amount of water uptake by the smallest particle size of polyox 750 was lower than when the same particle size with higher molecular weight (PEO 303) was used (Fig. 2). Viscosity data also confirmed a reduction in the viscosity of polyox solutions when the molecular weight of the polyox decreased. In case of a larger particle size of polyox (180–450 μm), the viscosities of 1% polyox 750 (the lowest molecular weight) and 303 (the highest molecular weight) in distilled water were 23.4 ± 4.4 and 417.3 ± 16.8 cP, respectively. It is obvious the higher molecular weight of polyox can generate a stronger gel layer around the tablets, leading to slower drug release. The results also showed that the particle size of polyox had no significant effect on the viscosity of the samples as when the smaller particles were used, the viscosity of 1% polyox 750 and polyox 303 was 20.0 ± 1.9 and 392.0 ± 7.8 cP respectively (these values for larger particle sizes were 23.4 ± 4.4 and 417.3 ± 16.8 for PEO 750 and PEO 303, respectively). This indicates that for the given polyox, the effect of particle size on release could not be due to the viscosity effect and there should be other parameters such as porosity and water uptake which were discussed earlier.
Fig. 2.
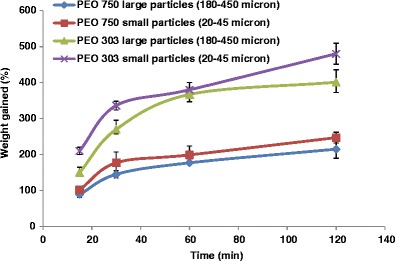
The effect of particle size and molecular weight of PEO on water uptake (percentage weight gained)
A similar conclusion was reported in the case of HPMC polymer by Wan et al. (33) who showed an increase in gel layer thickness after 30 min of swelling for HPMC matrix tablets was higher for higher molecular weight HPMC. Additionally, at the same polymer concentration, polymers of higher viscosity grades (such as PEO with higher molecular weight) induce greater chain entanglement than polymers of low viscosity, making it harder for longer chains to dissolve due to higher energy required for pulling them off the matrix (34). At low molecular weight, the drug is released primarily by erosion and diffusion of the polymer. As the molecular weight of the polymer increases, the polymer rate of hydration is slowed down due to increased tortuosity of the polymer strands. This causes the erosion and dissolution of the polymer to slow down to such an extent that the only way the drug release is facilitated is through the swelling of the polymer and the diffusion of the drug across the hydrogel layer (35).
Effect of Polymer Concentration on Dissolution Rate
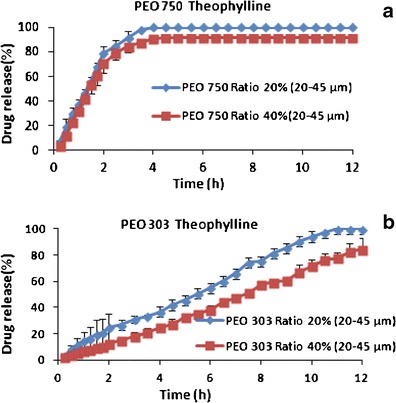
In the preliminary experiments, four different particle size fractions of polyox were chosen to investigate the effect of particle size on the release rate of theophylline from polyox matrices. In this stage, only two different particle size fractions, the smallest size fraction (20–45 μm) and the largest size fraction (180–425 μm), were chosen to investigate the effect of polymer concentration (20 and 40% w/w) on theophylline release. The results of dissolution profiles of theophylline from polyox matrices containing 40% polymer are shown in Fig 3. As it can be seen, the dissolution profiles containing 40% polyox with different particle size fractions (Fig. 2b) showed a different trend to the matrices containing 20% PEO in terms of release rate (Fig. 1). For example, in case of matrices made from low molecular weight of polyox (40% PEO), particle size had less impact on the drug release (Fig. 3a) compared to the matrices when 20% polyox 750 was used (compare Figs. 1 and 3a). Comparing Figs. 1 and 3 also obviously shows that the effect of particle size on drug release is more prominent when low concentration of polyox (20% w/w) was used (see the gap between dissolution profiles containing 20% PEO (Fig. 1) and matrices containing 40% PEO (Fig. 3)). This is in agreement with previous studies which highlighted that the effect of particle size of the polymer was greater when a lower polymer concentration was used (14, 28, 36).
Fig. 3.

Effect of particle sizes on drug release from theophylline matrix tablets with 40% polymer concentration. a PEO 750. b PEO 303
This was supported by similarity factor results reported in Table III. The f2 values for PEO 750 (lower molecular weight) are reported to be greater than 50 when the matrices containing a small particle size were compared with matrices containing large polyox particles at 40% polymer level, which is an indication of similarity between their release profiles (Table III). In contrast, the f2 values for PEO 303 were less than 50, suggesting that there is no similarity between their release rates. This indicates that the effect of particle size on drug release from low molecular weight and high molecular weight polyox is different.
As in the case of matrices containing low molecular weight of PEO, burst release occurred regardless of the size of polymer; therefore, the effect of particle size on the drug release is little (similarity between the dissolution profiles, see f2 values), whereas in the case of high molecular weight PEO, matrices containing different particle sizes do not disintegrate in the dissolution medium. Therefore, the impact of particle size changes on the drug release is significant when high molecular weight of polyox (PEO 303) was used (no similarity between the dissolution profiles).
In addition, fractions of polymers with a smaller particle size have more surface area relative to equivalent weights of fractions with a larger particle size. This greater surface area allows for better polymer-water contact thereby increasing the overall rate by which complete polymer hydration and gelation occurs. Alderman, 1984, studied K chemistry HPMC polymers and found that polymers that contained coarse particles ranging 200–300 μm produced burst release of the drug riboflavin (37). This was because the protective gel layer was not formed quickly enough. This is evident in Fig. 3a. What is interesting is that the smaller particle size of the PEO 750 also fails to control the burst release (Fig. 4a). As particle size fails to explain this phenomenon in the lower molecular weight PEO 750, this can be explained with regard to its low viscosity which means it is susceptible to the same level of agitation as experienced in the dissolution medium.
Fig. 4.
Effect of polyox concentration and molecular weight on drug release from theophylline matrix tablets containing polyox particles 20–45 μm
With regard to the high molecular weight PEO 303, particle size plays a significant effect on drug release regardless of polymer level. Despite the high level of polymer used (40%) and literature reporting that the effect of particle size are less prominent with increased polymer levels, the large difference in the particle sizes makes a significant difference (Fig. 3b). This big difference from 20–45 to 180–425 μm means the overall rate of hydration for the former occurs quicker than the latter. This quicker hydration rate also means that the protective gel layer controls drug release quicker and better (as experienced through the agitation in the dissolution medium). The release profiles shown in Fig. 3 can be correlated with the water uptake data (Fig. 2). Comparing Fig. 3 and Fig. 2 shows that there should be an inverse relationship between the rate of water uptake and drug release. Faster uptake of water by the matrices leads to slower drug release which could explain the slower drug release from matrices containing high molecular weight polyox and matrices containing smaller particles of polyox (Fig. 3).
Figure 3b also shows that with the particles size remaining the same at levels of 20 and 40%, the latter has more polymer content available or in contact with the dissolution media thereby forming a quicker gel layer in comparison to the former and thereby having the ability to modulate drug release better. The big difference as seen, when comparing PEO 750 and PEO 303, is as a result of their different molecular weights. Other authors have reported similar differences with regard to the different molecular weight of HPMC (38–41).
For better clarification of the effect of particle size and polyox concentration on drug release simultaneously, release profiles were shown at the same particle size fractions (Figs. 4 and 5). Dissolution profiles (Figs. 4 and 5) demonstrated that when the polymer concentration was increased from 20 to 40%, a significant decrease in the amount of drug released was observed when a larger particle size fraction of polyox was used. For instance, tablets made from 40% polyox 303 with the particle size fraction of 180–425 μm almost showed 40% of drug release at 6 h compared to tablets made with 20% polyox of the same particle size fraction that showed 100% release in the same time. The extent of the effect of polyox concentration on drug release was smaller when smaller particle size fraction (20–45 μm) was employed (Fig. 5).
Fig. 5.

Effect of polyox concentration and molecular weight on drug release from theophylline matrix tablets containing polyox particles 180–425 μm
When the polymer concentration in the matrix tablet increases, the viscosity of the gel around the tablet increases resulting in the formation of a gel layer that has a longer diffusional path thus decreasing the effective diffusion coefficient of the drug leading to a reduction in the drug release rate (42). At high concentration of polymer (40% w/w), the burst release was also significantly reduced. Heng et al. (29) stated that at higher concentrations, gel layers form at a much faster rate and are more viscous and resistant thus preventing a large initial bolus of drug being released.
The results of fitting the dissolution data with the dissolution criteria (DE and MDT) are shown in Table V. Dissolution efficiency values are consistent with dissolution profiles confirming that the drug release rate from PEO 750 and 303 is faster in the case of larger PEO particles. For instance, the DE value of fraction 20–45 μm PEO 303 was 41.0% whereas this value increased to 58% for matrices with particle size 180–425 μm. This was also the case for PEO 750 formulations where DE increased from 80% for fraction 20–45 μm to 88% for fraction 180–425 μm. Similar conclusions could be drawn when considering MDT values (Table V). It can be concluded that more care must be taken when larger polyox particles are used as their drug release are very sensitive to the concentration of polyox incorporated in the formulations.
Table V.
Effect of Particle Size on Dissolution Parameters of PEO Matrices with 40% Polymer
| PEO (40%) | Particle size (μm) | DE (%) | MDT (h) |
|---|---|---|---|
| PEO 750 | 20–45 | 80.0 | 1.47 |
| 180–425 | 88.0 | 1.39 | |
| PEO 303 | 20–45 | 41.0 | 6.20 |
| 180–425 | 58.0 | 5.00 |
DE dissolution efficiency, MDT mean dissolution time, PEO polyethylene oxide
Finally, to elucidate the results further, the thermal behaviour of the different particle sizes of polyox used in the preparation of tablet matrices were studied by DSC, and their DSC traces and data are presented in Fig. 6 and Table VI, respectively. DSC traces in Fig. 6 showed thermal behaviour of polyox with different particle sizes. All DSC traces showed an endothermic peak which is an indication of polyox melting point. The DSC traces (Fig. 6) show that as the particle size fraction increases, the melting peak slightly shifted towards a higher temperature. This indicates that a larger particle requires more energy to reach their melting point. This could be due to the fact that the larger particles have a higher heat transfer resistance than smaller particles, leading to a delay in time for greater particles to reach the furnace temperature. Our data were in agreement with previous research carried out by Reynoso et al. (43). They showed that there was slight increase in enthalpies and melting peak of phosphate sodium-based glass with a larger particle size when they were compared to a smaller particle size. Table VI shows the melting point of PEO 303 with the particle size fraction of 20–45 μm was 68.0°C, while the melting point of PEO 303 with the particle size fraction of 180–425 μm had a melting point of 70.0°C. It can be concluded that the thermal behaviour of different particle size fractions of polyox powders is slightly different, and the authors do not believe that these slight changes in their thermal behaviour can change the release profile significantly. There should be other parameters such as surface area of particles and gel formation rate which were discussed earlier in the manuscript.
Fig. 6.
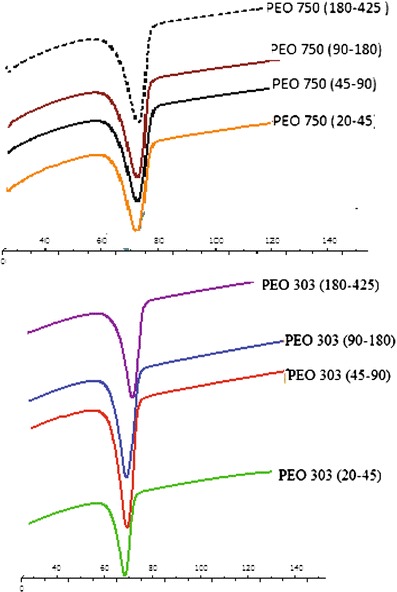
DSC traces of various particle sizes of PEO 750 and 303
Table VI.
DSC Parameters of Various PEO Ground Matrix Tablets with (20% Ratio) with Different Particle Sizes
| PEO grade | Particle size (μm) | Enthalpy (J/g) | Onset (°C) | Peak (°C) |
|---|---|---|---|---|
| 750 | 20–45 | −131.0 ± 1.0 | 60.0 ± 0.5 | 65.0 ± 0.2 |
| 45–90 | −132.0 ± 1.0 | 61.0 ± 0.1 | 65.5 ± 0.5 | |
| 90–180 | −134.0 ± 2.0 | 61.5 ± 1.0 | 66.0 ± 1.0 | |
| 180–425 | −135.0 ± 2.0 | 62.0 ± 1.0 | 66.3 ± 0.3 | |
| 303 | 20–45 | −158.0 ± 0.4 | 61.0 ± 0.3 | 68.0 ± 1.0 |
| 45–90 | −159.0 ± 1.0 | 61.5 ± 0.1 | 68.7 ± 1.0 | |
| 90–180 | −161.0 ± 0.5 | 62.3 ± 1.0 | 69.5 ± 1.0 | |
| 180–425 | −162.0 ± 2.0 | 63.0 ± 1.0 | 70.0 ± 0.5 |
PEO polyethylene oxide
To have a better understanding of the effect of polyox particle size on the mechanism of drug release, the release data were fitted into the general drug release behaviour (power law) from hydrophilic matrices described by Korsmeyer et al. (44):
| 6 |
where n gives an indication of the release mechanism (a value of n near 0.5 indicates Fickian diffusion while n value near 1 indicates that erosion is the main mechanism of drug release). Our results showed that an increase in the particle size resulted in a reduction in n value (Table II). This indicates that the drug release mechanism was not consistent with the changes in particle size, and the particle size of polyox can change the mechanism of drug release. This is in a good agreement with the data reported for HPMC K15M where the smallest HPMC particle size (34 μm) showed an n value of 0.845 and the largest HPMC particle (309 μm) showed an n value of 0.281 (45).
CONCLUSION
The results in this study clearly showed that hydrophilic matrices made from larger particle size fractions of polyethylene oxide (polyox) had a faster drug release profile than matrices made from smaller particles. The results showed that at a high concentration of polymer (40% w/w), the impact of particle size on drug release is not as big as when a low concentration of polymer (20%) was used. This indicates that the drug release from polyox matrices containing a larger particle size is very sensitive to the level of polyox particularly when high molecular weight of polyox is used.
REFERENCES
- 1.Colombo P, Bettini R, Massimo G, Catellani PL, Santi P, Peppas NA. Drug diffusion front movement is important in drug release control from swellable matrix tablets. J Pharm Sci. 1995;84:993–997. doi: 10.1002/jps.2600840816. [DOI] [PubMed] [Google Scholar]
- 2.Haan PD, Lerk CF. Oral controlled release dosage forms: a review. Pharm World Sci. 1984;6:57–67. doi: 10.1007/BF01953956. [DOI] [PubMed] [Google Scholar]
- 3.Kiss D, Suvegh K, Marek T, Devenyi L, Novak C, Zelko R. Tracking the physical aging of poly(ethylene oxide) AAPS PhamSci Tech. 2006;7:118–125. doi: 10.1208/pt070495. [DOI] [PMC free article] [PubMed] [Google Scholar]
- 4.Bailey FE, Koleske JV. Alkylene oxides and their polymer. New York: Marcel and Dekker; 1990. [Google Scholar]
- 5.Bailey FE, Koleske JV. Poly(ethylene oxide) New York: Academic; 1976. [Google Scholar]
- 6.Colombo P, Bettini R, Sant IP, Peppas NA. Swellable matrices for controlled drug delivery: gel-layer behaviour, mechanisms and optimal performance. Pharm Sci Technol Today. 2000;3:198–204. doi: 10.1016/S1461-5347(00)00269-8. [DOI] [PubMed] [Google Scholar]
- 7.Royce AE. Directly compressible polyethylene oxide vehicle for preparing therapeutic dosage forms. 1993; US Patent 5273758.
- 8.Kim CJ. Drug release from compressed hydrophilic Polyox® WSR tablets. J Pharm Sci. 1993;84:303–306. doi: 10.1002/jps.2600840308. [DOI] [PubMed] [Google Scholar]
- 9.Chatani Y, Okamura S. Crystal structure of poly(ethylene oxide)–sodium iodide complex. Polymer. 1987;28:1815–1820. doi: 10.1016/0032-3861(87)90283-7. [DOI] [Google Scholar]
- 10.Rowe RC, Sheskey PJ, Weller PJ. Handbook of pharmaceutical excipients. 4. London: Pharmaceutical Press; 2003. [Google Scholar]
- 11.Dimitrov M, Lambov N. Study of Verapamil hydrochloride release from compressed hydrophilic Polyox-Wsr tablets. Int J Pharm. 1999;189:105–111. doi: 10.1016/S0378-5173(99)00242-2. [DOI] [PubMed] [Google Scholar]
- 12.Zhang F, McGinity JW. Properties of sustained-release tablets prepared by hot-melt extrusion. Pharm Dev Technol. 1999;4:241–225. doi: 10.1081/PDT-100101358. [DOI] [PubMed] [Google Scholar]
- 13.Dhawan S, Sinha VR. Applications of poly(ethylene oxide) in drug delivery systems part II. Pharm Technol. 2005;9:82–96. [Google Scholar]
- 14.Mitchell K, Ford JL, Armstrong DJ, Elliott PNC, Hogan JE, Rostron C. The influence of the particle size of hydroxypropylmethylcellulose K15M on its hydration and performance in matrix tablets. Int J Pharm. 1993;100:175–9.
- 15.Liew CV, Chan LW, Ching AL, Heng PSW. Evaluation of sodium alginate as drug release modifier in matrix tablets. Int J Pharm. 2006;309:25–37. doi: 10.1016/j.ijpharm.2005.10.040. [DOI] [PubMed] [Google Scholar]
- 16.Nokhodchi A, Rubenstein MH, Ford JH. The effect of particle size and viscosity grade on the compaction properties of hydroxypropylmethylcellulose 2208. Int J Pharm. 1995;126:189–197. doi: 10.1016/0378-5173(95)04122-2. [DOI] [Google Scholar]
- 17.Landín M, Rowe RC, York P. Particle size effects on the dehydration of dicalcium phosphate dihydrate powders. Int J Pharm. 1994;104:271–275. doi: 10.1016/0378-5173(94)90167-8. [DOI] [Google Scholar]
- 18.Akbari J, Nokhodchi A, Farid J, Adarangui M, Siahi–Shahdad MR, Saeedi M. Development and evaluation of buccoadhesive propranolol hydrochloride tablet formulations: effect of fillers. IL- Farmaco. 2003;59:155–161. doi: 10.1016/j.farmac.2003.11.011. [DOI] [PubMed] [Google Scholar]
- 19.Boyapally H, Nukala RK, Bhujbal P, Douroumis D. Controlled release from directly compressible theophylline buccal tablets. Colloids Surf B: Biointerfaces. 2010;77:227–233. doi: 10.1016/j.colsurfb.2010.01.031. [DOI] [PubMed] [Google Scholar]
- 20.Sabnis S, Adeyeye SM. Controlled-release hydrophilic tablets for individualized theophylline therapy. Drug Dev Ind Pharm. 1998;25:187–196. doi: 10.1081/DDC-100102159. [DOI] [PubMed] [Google Scholar]
- 21.Kaialy W, Martin GP, Ticehurst MD, Royall P, Mohammad MA, Murphy J, et al. Characterisation and deposition studies of recrystallised lactose from binary mixtures of ethanol/butanol for improved drug delivery from dry powder inhalers. AAPS J. 2011;13:30–43. doi: 10.1208/s12248-010-9241-x. [DOI] [PMC free article] [PubMed] [Google Scholar]
- 22.USP Pharmacopoeia 26 National Formulary 21, USP Convention, Rockville, 2003.
- 23.Khan KA. Concept of dissolution efficiency. J Pharm Sci. 1975;271:48–49. doi: 10.1111/j.2042-7158.1975.tb09378.x. [DOI] [PubMed] [Google Scholar]
- 24.Moore JW, Flanner HH. Mathematical comparison of dissolution profiles. Pharm Tech. 1996;20:64–74. [Google Scholar]
- 25.Al-Khattawi A, Iyire A, Dennison T, Dahmash E, Bailey CJ, Smith J, et al. Systematic screening of compressed ODT excipients: cellulosic versus non-cellulosic. Curr Drug Deliv. 2014;11(4):486–500. doi: 10.2174/1567201811666140323201650. [DOI] [PubMed] [Google Scholar]
- 26.Chattoraj S, Shia L, Sun CC. Understanding the relationship between crystal structure, plasticity and compaction behaviour of theophylline, methyl gallate, and their 1:1 co-crystal. Cryst Eng Comm. 2010;12:2466–2472. doi: 10.1039/c000614a. [DOI] [Google Scholar]
- 27.Cahyadi C, Chan LW, Colombo P, Heng PWS. The butterfly effect: a physical phenomenon of hypromellose matrices during dissolution and the factors affecting its occurrence. Int J Pharm. 2011;406:31–40. doi: 10.1016/j.ijpharm.2010.12.028. [DOI] [PubMed] [Google Scholar]
- 28.Aldrete ME, Villafuerte-Robles L. Influence of the viscosity grade and the particle size of HPMC on metronidazole release from matrix tablets. Eur J Pharm Biopharm. 1997;43:173–178. doi: 10.1016/S0939-6411(96)00004-5. [DOI] [Google Scholar]
- 29.Heng PWS, Chan LW, Easterbrook MG, Li XM. Investigation of the influence of mean HPMC particle size and number of polymer particles on the release of aspirin from swellable hydrophilic matrix tablets. J Control Rel. 2001;76:39–49. doi: 10.1016/S0168-3659(01)00410-2. [DOI] [PubMed] [Google Scholar]
- 30.Wu N, Wang LS, Tan DC, Moochhala SM, Yang YY. Mathematical modelling and in vitro study of controlled drug release via a highly swellable and dissoluble polymer matrix: polyethylene oxide with high molecular weights. J Control Rel. 2005;102:569–581. doi: 10.1016/j.jconrel.2004.11.002. [DOI] [PubMed] [Google Scholar]
- 31.Apicella A, Cappello B, Del Nobile MA, La Rotonda MI, Mensitieri G, Nicolais L. Poly(ethylene oxide) (PEO) and different molecular weight PEO blends monolithic devices for drug release. Biomaterials. 1993;14:83–90. doi: 10.1016/0142-9612(93)90215-N. [DOI] [PubMed] [Google Scholar]
- 32.Di Colo G, Burgalassi S, Chetoni P, Fiaschi MP, Zambito Y, Saettone MF. Relevance of polymer molecular weight to the in vitro/in vivo performances of ocular inserts based on poly(ethylene oxide). Int J Pharm. 2001;220:169–77. [DOI] [PubMed]
- 33.Wan LSC, Heng PWS, Wong LF. Relationship between swelling and drug release in a hydrophilic matrix. Drug Dev Ind Pharm. 1993;19:1201–121. doi: 10.3109/03639049309063012. [DOI] [Google Scholar]
- 34.Hiremath PS, Saha RN. Controlled release hydrophilic matrix tablet formulations of isoniazid: design and in vitro studies. AAPS PharmSciTech. 2008;9:1171–1178. doi: 10.1208/s12249-008-9159-0. [DOI] [PMC free article] [PubMed] [Google Scholar]
- 35.Maggi L, Segale L, Torre ML, Ochoa ME, Conte U. Dissolution behaviour of hydrophilic matrix tablets containing two different polyethylene oxides (PEOs) for the controlled release of a water-soluble drug. Dimensionality study. Biomaterials. 2002;23:1113–1119. doi: 10.1016/S0142-9612(01)00223-X. [DOI] [PubMed] [Google Scholar]
- 36.Lotfipour F, Nokhodchi A, Saeedi M, Norouzi-Sani S, Sharbafi J, Siahi-Shadbad MR. The effect of hydrophilic and lipophilic polymers and fillers on the release rate of atenolol from HPMC matrices. IL Farmaco. 2004;59:819–825. doi: 10.1016/j.farmac.2004.06.006. [DOI] [PubMed] [Google Scholar]
- 37.Alderman DA. A review of cellulose ethers in hydrophilic matrixes for oral controlled-release dosage forms. Int J Pharm Tech Prod Mfr. 1984;5:1–9. [Google Scholar]
- 38.Ford JL, Rubinstein MH, Hogan JE. Formulation of sustained-release promethazine hydrochloride tablets using hydroxypropyl methyl cellulose matrixes. Int J Pharm. 1985;24:327–338. doi: 10.1016/0378-5173(85)90031-6. [DOI] [Google Scholar]
- 39.Asare-Addo K, Levina M, Rajabi-Siahboomi AR, Nokhodchi A. Effect of ionic strength and pH of dissolution media on theophylline release from hypromellose matrix tablets—Apparatus USP III, simulated fasted and fed conditions. Carbohydr Polym. 2011;86:85–93. doi: 10.1016/j.carbpol.2011.04.014. [DOI] [Google Scholar]
- 40.Asare-Addo K, Levina M, Rajabi-Siahboomi AR, Nokhodchi A. Study of dissolution hydrodynamic conditions versus drug release from hypromellose matrices: the influence of agitation sequence. Colloids Surf B: Biointerfaces. 2010;81:452–460. doi: 10.1016/j.colsurfb.2010.07.040. [DOI] [PubMed] [Google Scholar]
- 41.Asare-Addo K, Conway BR, Larhrib H, Levina M, Rajabi-Siahboomi AR, Tetteh J, et al. The effect of pH and ionic strength of dissolution media on in-vitro release of two model drugs of different solubilities from HPMC matrices. Colloids Surf B: Biointerfaces. 2013;111:384–391. doi: 10.1016/j.colsurfb.2013.06.034. [DOI] [PubMed] [Google Scholar]
- 42.Velasco MV, Ford JL, Rowe P, Rajabi-Siahboomi AR. Influence of drug: hydroxypropylmethylcellulose ratio, drug and polymer particle size and compression force on the release of diclofenac sodium from HPMC tablets. J Control Rel. 1999;57:75–85. doi: 10.1016/S0168-3659(98)00110-2. [DOI] [PubMed] [Google Scholar]
- 43.Reynosa VCS, Yukimitu K, Nagami T, Carvalho CL, Moraes JCS, Araujo EB. Crystallization kinetics in phosphate sodium-based glass studied by DSC technique. J Physics Chem Solids. 2003;64:27–30. doi: 10.1016/S0022-3697(02)00204-4. [DOI] [Google Scholar]
- 44.Korsmeyer RW, Gurny R, Deolker E, Buri P, Peppas NA. Mechanisms of solute release from porous hydrophilic polymers. Int J Pharm. 1983;15:25–35. doi: 10.1016/0378-5173(83)90064-9. [DOI] [PubMed] [Google Scholar]
- 45.Heng PWS, Chan LW, Easterbrook MG, Li X. Investigation of the influence of mean HPMC particle size and number of polymer particles on the release of aspirin from swellable hydrophilic matrix tablets. J Controlled Release. 2001;76:39–49. doi: 10.1016/S0168-3659(01)00410-2. [DOI] [PubMed] [Google Scholar]