

Abstract
The Biopharmaceutics Drug Disposition Classification System (BDDCS) can be utilized to predict drug disposition, including interactions with other drugs and transporter or metabolizing enzyme effects based on the extent of metabolism and solubility of a drug. However, defining the extent of metabolism relies upon clinical data. Drugs exhibiting high passive intestinal permeability rates are extensively metabolized. Therefore, we aimed to determine if in vitro measures of permeability rate or in silico permeability rate predictions could predict the extent of metabolism, to determine a reference compound representing the permeability rate above which compounds would be expected to be extensively metabolized, and to predict the major route of elimination of compounds in a two-tier approach utilizing permeability rate and a previously published model predicting the major route of elimination of parent drug. Twenty-two in vitro permeability rate measurement data sets in Caco-2 and MDCK cell lines and PAMPA were collected from the literature, while in silico permeability rate predictions were calculated using ADMET Predictor™ or VolSurf+. The potential for permeability rate to differentiate between extensively and poorly metabolized compounds was analyzed with receiver operating characteristic curves. Compounds that yielded the highest sensitivity-specificity average were selected as permeability rate reference standards. The major route of elimination of poorly permeable drugs was predicted by our previously published model and the accuracies and predictive values were calculated. The areas under the receiver operating curves were >0.90 for in vitro measures of permeability rate and >0.80 for the VolSurf+ model of permeability rate, indicating they were able to predict the extent of metabolism of compounds. Labetalol and zidovudine predicted greater than 80% of extensively metabolized drugs correctly and greater than 80% of poorly metabolized drugs correctly in Caco-2 and MDCK, respectively, while theophylline predicted greater than 80% of extensively and poorly metabolized drugs correctly in PAMPA. A two-tier approach predicting elimination route predicts 72±9%, 49±10%, and 66±7% of extensively metabolized, biliarily eliminated, and renally eliminated parent drugs correctly when the permeability rate is predicted in silico and 74±7%, 85±2%, and 73±8% of extensively metabolized, biliarily eliminated, and renally eliminated parent drugs correctly, respectively when the permeability rate is determined in vitro.
Keywords: BDDCS, Permeability, Drug Elimination, Biliary, Renal, Metabolism
Introduction
Absorbed drugs are predominately eliminated from the body via metabolism or secretion of unchanged drug in the bile or the urine. Elimination is a multi-factorial process mediated in part by passive permeability, drug transport, and substrate specificity to transporters and metabolizing enzymes. Understanding which route predominates in the disposition and elimination of a drug can help pharmaceutical scientists anticipate potentially dangerous interactions with other drugs, endogenous molecules, and food. Additionally, processes associated with drug elimination can be utilized to aid in drug delivery. For instance, a drug that is eliminated in the bile can undergo enterohepatic recycling, exposing the drug to the liver and intestine multiple times, while a concern for extensively metabolized drugs may be susceptibility to extensive first pass metabolism.
In 1995, the development of the Biopharmaceutics Classification System (BCS) recognized that drug permeability can predict the extent of drug absorption1. Ten years later, Wu and Benet2 proposed the Biopharmaceutics Drug Disposition Classification System (BDDCS), which recognized that drugs exhibiting a high passive intestinal permeability rate were also extensively metabolized, while low permeability rate drugs were primarily eliminated as unchanged drug in the bile or the urine. This may be because highly permeable drugs are passively reabsorbed from the urine or the bile, and require metabolism to a more polar compound to be successfully eliminated from the body. BDDCS classifies drugs based on their extent of metabolism and solubility. BDDCS class 1 and 2 drugs are extensively metabolized, while poorly metabolized drugs, which are primarily eliminated as parent drug in the bile or the urine, populate classes 3 and 4. The BCS is used by the FDA and the EMA to grant biowaivers to certain highly permeable, highly soluble drugs3. Therefore, a number of assays are outlined to qualify a drug as highly permeable, including determining the in vitro permeability rate in monolayer-cultured epithelial cells4. Ideally, this principle could be applied to predict the extent of metabolism prior to in vivo studies. Recently, Varma et al. demonstrated that BDDCS class can be provisionally classified by in vitro permeability rate, measured in MDCK-II cells in their study, and solubility5. Cell-based in vitro permeability rate is typically measured in human colorectal adenocarcinoma cells (Caco-2) or Madin-Darby canine kidney (MDCK) cells, epithelial cell lines that are cultured as monolayers. Alternatively, permeability rate can be measured in the parallel artificial membrane permeability assay (PAMPA). Permeability rate is often expressed as an absorptive rate, in the apical to basolateral direction. We expect that the permeability rate measured in this direction will relevantly predict the extent of metabolism, as we hypothesize that reabsorption of high permeability-rate drugs across the apical membranes of the kidneys (i.e. from the tubule) or the liver (i.e. from the bile) result in poor excretion of unchanged drug and a high extent of metabolism. Permeability rate measurements vary significantly between laboratories due to differences in experimental conditions such as cell source, passage number, culture media, cell density, monolayer age, or transport buffer6. As a result, permeability rate measurements should be carried out in single laboratories and compared with a reference standard to categorize if a drug is highly or poorly permeable. Metoprolol is widely used as a reference compound to define highly permeable or highly absorbed drugs7, but studies have suggested that it is too conservative8,9, resulting in incorrect classification of drugs that would otherwise be considered highly permeable and potentially subject to a biowaiver in BCS, or correctly classified as extensively metabolized in BDDCS. Furthermore, normalization of permeability rate to metoprolol’s permeability rate does not reduce the variability of quantitative measurements to predict absorption between laboratories10.
Recently, we published an in silico logistic regression model utilizing polarizability and predicted metabolic stability. This model successfully predicted the major route of elimination of poorly metabolized parent drugs, i.e., biliary versus renal11. When we tested extensively metabolized drugs on this model, we noted that many extensively metabolized drugs shared similar in silico properties with poorly metabolized drugs that are primarily eliminated as unchanged drug in the bile, i.e., a high polarizability or molecular weight and a low predicted metabolic stability. Although high molecular weight was historically predictive of biliary elimination, we showed that greater than 80% of orally administered drugs with MW > 380 Da, the molecular weight threshold that we calculated11, and greater than 80% of orally administered drugs with MW > 475 Da, the molecular weight threshold for anions calculated by Yang et al.12, were extensively metabolized. Although high molecular weight/polarizability and low predicted metabolic stability identify both biliarily eliminated and many extensively metabolized drugs, we expected that in vitro permeability rate measurements or in silico permeability rate predictions could differentiate poorly metabolized drugs, including those eliminated in the bile, from extensively metabolized drugs.
This study aims to demonstrate the utility of in vitro permeability rate measurements and in silico permeability rate predictions in defining the extent of metabolism using 22 in vitro permeability rate datasets drawn from the literature and BDDCS classification as defined by Benet et al.13 Additionally, we evaluate lipophilicity as a surrogate estimation of permeability rate. We aim to determine a less conservative permeability rate reference compound than metoprolol that produces the most accurate predictions of the extent of metabolism. Finally, we predict the major route of drug elimination by combining extent of metabolism predictions based on permeability rate with a logistic regression model11 predicting the elimination route of unchanged drugs.
Methods
Datasets
Caco-2, MDCK, and PAMPA data were obtained from the literature5,14–31. We required experimental values in each dataset to be determined in the same laboratory. Datasets considering only one therapeutic drug class (e.g. fluoroquinolones) were not selected for analysis. To be included in our analysis, at least 4 extensively metabolized and 4 poorly metabolized drugs were required to be in the dataset. The data were reported as Papp (× 10−6 cm/s) in the apical to basolateral direction. In silico permeability predictions were calculated in ADMET Predictor™ (Simulations Plus, Inc.) with default settings at pH = 7.4 or in VolSurf+32,33 with default options at pH = 7.5 using the predefined models S+ MDCK and S+ Peff from ADMET Predictor™ (available from http://www.simulations-plus.com) or CACO2 from VolSurf+ (available from http://www.moldiscover.com). Measured octanol/water partition coefficients (mLogP) were obtained from Benet et al.13, calculated octanol/water partition coefficients (cLogP) were determined in ADMET Predictor and VolSurf+, and calculated cyclohexane/water partition coefficients were determined in VolSurf+. BDDCS class was assigned using the classifications assigned by Benet et al13. BDDCS classes 1 and 2 are extensively metabolized, while classes 3 and 4 are poorly metabolized. Drugs were removed from the permeability rate datasets when BDDCS class and therefore extent of metabolism was not categorized by the Benet et al. dataset. In vitro measured permeability rate, predicted in silico permeability rate, and measured or calculated LogP was assessed with bootstrapped area under the receiver operating characteristic (ROC) curve (AUC) for their abilities to differentiate the extent of metabolism (extensively versus poorly metabolized). AUCs > 0.8 are considered representative of significant differentiability, while values approaching 0.5 represent a lack of discrimination.
Optimal permeability rate reference standard determination and classification statistics
For analysis, extensively metabolized drugs were considered the positive class, while poorly metabolized drugs were considered the negative class. Drugs present in 3 or more datasets were evaluated for their effect on the sensitivity (ratio of true positives to all positives, representing how accurately extensively metabolized drugs are predicted), specificity (ratio of true negatives to all negatives, representing how accurately poorly metabolized drugs are predicted), positive predictive value (PPV, the ratio of true positives to predicted positives, representing how accurately high permeability rates describe extensively metabolized drugs), and negative predictive value (NPV, the ratio of true negatives to predicted negatives, representing how accurately low permeability rates describe poorly metabolized drugs).
Optimal permeability rate standards were selected for each cell line by choosing the drug giving the maximum average of sensitivity and specificity, with the requirement that sensitivity, specificity, negative predictive value, and positive predictive values must all be greater than 0.7.
Two-tier approach to predicting major elimination route
Two datasets5,16 (Varma, Skolnik) met the initial dataset inclusion criteria and included at least 4 drugs from each of the three major routes of elimination, as previously defined11. To expand the analysis, we included the Pham-The dataset that reports an average permeability rate from many sources34. As the logistic regression model can only usefully be applied to orally administered drugs11, we reduced each dataset to orally administered drugs only. We applied the previously defined logistic regression model11 using predicted metabolic stability and polarizability to poorly permeable compounds and calculated the accuracy and predictive ability of a two-tier classification approach (Figure 1).
Figure 1.

Two-tier approach to predicting major route of elimination utilizing in vitro permeability rate to determine extent of metabolism and the previously defined logistic regression model to predict major route of elimination of poorly metabolized drugs. aLogistic regression model including calculated polarizability and metabolic stability published by Hosey et al.:11 When Π(x) >0.237, the drug is predicted to be eliminated in the bile.
In silico permeability rate models were evaluated for their performance in the two-tier approach. Permeability rates were predicted in ADMET Predictor with the S+ MDCK model and the S+ Peff model and in VolSurf+ with the CACO2 model. 100×5 fold cross validation was performed as follows: the stratified dataset was randomly assigned to 5 groups 100 times. For each of the 100 randomizations, a numeric permeability rate threshold giving the maximum average between sensitivity and specificity was calculated from 4/5 of the stratified data. The threshold was applied to predict the extent of metabolism of each compound and the previously published logistic regression model predicting the major route of elimination of poorly permeable drugs was applied. The performance of this process was tested on the remaining 1/5 of the stratified data. This process was repeated 5 times, using each progressive 1/5 of the data as a test set. After sampling through 100 randomizations, the threshold and the performance values were averaged to represent the selected numeric threshold and performances specific to each in silico model.
Improving permeability rate predictions
To detect regions of permeability rate with very high predictability, we selected a “low” permeability rate standard, such that drugs with permeability rates less than this standard were very likely to be eliminated unchanged (NPV > 0.8). We also selected a “high” standard, which reflected a permeability above which drugs were very likely to be extensively metabolized. We considered drugs that were present in all of the Pham-The, Skolnik, and Varma datasets, and that gave a high predictive value (PPV or NPV > 0.8) among the datasets predicting extent of metabolism.
Results
Dataset
Eleven Caco-2 datasets, 5 MDCK datasets, and 6 PAMPA datasets met the criteria for dataset inclusion, with in vitro permeability rate measurements obtained for 214 drugs. Supplementary Table I details the population of compounds by cell line and extent of metabolism. When biliarily eliminated drugs were listed as part of the dataset, the table details the population of compounds via the major routes of elimination.
In vitro permeability models
The area under the ROC curve is a metric that is independent of threshold selection (in this case, the permeability rate of the selected reference compound), but portrays the ability of a feature (e.g. permeability rate) to discriminate between two classes (e.g. poorly or extensively metabolized drugs). Table I reports the ROC AUCs of in vitro permeability rate measures and in silico permeability rate predictions as discriminators of the extent of metabolism when comparing extensively metabolized drugs to: all poorly metabolized drugs, drugs primarily eliminated as unchanged drug in the urine, and drugs primarily eliminated as unchanged drug in the bile. The last column exhibits the AUC when comparing the permeability rates of drugs primarily eliminated as unchanged drug in the bile to those eliminated as unchanged drug in the urine.
Table I.
Area under the receiver operating curve for bootstrapped sampling of measured or predicted permeability rate as a predictor of extensively metabolized and poorly metabolized drugs eliminated primarily as unchanged drug in either the bile or urine.
| Extensive Metabolism vs
|
||||
|---|---|---|---|---|
| In vitro Model | Elimination as unchanged drug (N) | Renal elimination of unchanged drug (N) | Biliary elimination of unchanged drug (N) | Biliary vs Renal |
|
|
|
|||
| Caco2 | 0.93±0.07 (11) | 0.90±0.11(11) | 0.82 (1) | 0.53 (1) |
| MDCK | 0.91 ± 0.03 (5) | 0.95 ± 0.02 (5) | 0.89 (1) | 0.53 (1) |
| PAMPA | 0.93 ± 0.05 (6) | 0.95 ± 0.04 (6) | --- | 0.71 (1) |
| In silico Model | ||||
| AP MDCK | 0.78±0.03 | 0.82±0.04 | 0.81±0.05 | 0.56±0.09 |
| AP Peff | 0.74±0.03 | 0.76±0.04 | 0.69±0.07 | 0.58±0.09 |
| VS+ CACO2 | 0.82±0.03 | 0.81±0.07 | 0.87±0.03 | 0.61±0.10 |
(N) represents the number of datasets
AP: ADMET Predictor
VS+: VolSurf+
Permeability standard selection and validation
The drugs that met the criteria for standard reference drug selection, listed in order of decreasing average between sensitivity and specificity were: labetalol, dexamethasone, and methylprednisolone for the Caco-2 cell line; zidovudine and labetalol for the MDCK cell line; and theophylline and metoprolol for PAMPA. The drugs selected as permeability rate reference compounds for each in vitro method and the mean classification statistical values are reported in Table II. Performance of the selected standards in alternative cell lines is also shown.
Table IIa.
Performance measures of reference compounds selected to compare experimental in vitro permeability rate of extensively and poorly metabolized compounds
| Labetalol | Zidovudine | Theophylline | Dexamethasone | Methylprednisolone | Metoprolol | |
|---|---|---|---|---|---|---|
| number of datasets in selection set (Cell Lines) | 3(Caco-2) | 3 (MDCK) | 5 (PAMPA) | 7 (Caco-2) | 3 (Caco-2) | 8(Caco-2) 3 (MDCK) |
| number of datasets in validation set (Cell Lines) | 4 (MDCK) 1 (PAMPA) |
2(Caco-2) 2 (PAMPA) |
5 (Caco-2) 2 (MDCK) |
2 (MDCK) 3 (PAMPA) |
2 (MDCK) 3 (PAMPA) |
6 (PAMPA) |
| Caco-2 | ||||||
| Sensitivity | 0.83±0.13 | 0.88±0.12 | 0.45±0.13 | 0.78±0.11 | 0.75±0.13 | 0.52±0.18 |
| Specificity | 0.87±0.03 | 0.86±0.04 | 1.00±0.00 | 0.87±0.10 | 0.90±0.10 | 0.99±0.01 |
| Positive Predictive Value | 0.92±0.02 | 0.92±0.02 | 1.00±0.00 | 0.92±0.07 | 0.91±0.10 | 0.99±0.03 |
| Negative Predictive Value | 0.77±0.11 | 0.84±0.10 | 0.54±0.12 | 0.70±0.14 | 0.72±0.10 | 0.56±0.10 |
| MDCK | ||||||
| Sensitivity | 0.76±0.12 | 0.90±0.09 | 0.55 ± 0.00 | 0.75±0.03 | 0.80±0.05 | 0.28±0.07 |
| Specificity | 0.90±0.04 | 0.81±0.13 | 0.97 ± 0.04 | 0.84±0.08 | 0.78±0.16 | 1.00±0.00 |
| Positive Predictive Value | 0.90±0.04 | 0.90±0.04 | 0.97 ± 0.04 | 0.89±0.02 | 0.87±0.05 | 1.00±0.00 |
| Negative Predictive Value | 0.75±0.15 | 0.85±14 | 0.62 ± 0.15 | 0.67±0.05 | 0.70±0.05 | 0.57±0.11 |
| PAMPA | ||||||
| Sensitivity | 0.64 | 0.69±0.12 | 0.88 ± 0.11 | 0.46±0.22 | 0.54±0.24 | 0.72±0.23 |
| Specificity | 0.87 | 0.82±0.06 | 0.81 ± 0.24 | 0.93±0.07 | 0.93±0.07 | 0.90±0.13 |
| Positive Predictive Value | 0.90 | 0.85±0.06 | 0.90 ± 0.12 | 0.93±0.06 | 0.94±0.06 | 0.94±0.07 |
| Negative Predictive Value | 0.57 | 0.65±0.15 | 0.81 ± 0.10 | 0.56±0.10 | 0.60±0.13 | 0.70±0.17 |
High (metoprolol) and low (chlorothiazide) permeability rate standards were selected to provide more discriminating predictability in extreme permeability rate regions. The low permeability rate reference standards selected were: chlorothiazide, hydrochlorothiazide, nadolol, furosemide, atenolol, and pravastatin. Selecting chlorothiazide as the standard resulted in the highest predictive performance of drugs predicted to be eliminated in the bile (4/6, 3/7, and 8/22 in Varma, Skolnik, and Pham-The, respectively), with the highest retention (specificity) of renally cleared drugs, which are 100% predictive. Metoprolol was selected due to its historical relevance as a permeability rate reference compound, with evidence of high positive predictive values (Table II). Among all datasets including either metoprolol or chlorothiazide, 97±5% (n=20) of the compounds with permeability rate greater than that of metoprolol were metabolized, while 90±14% (n=8) of the compounds with permeability rates less than that of chlorothiazide were poorly metabolized. Table II shows the PPV and NPV of selected intermediate standards. For extensively metabolized drugs, the intermediate permeability rate standards (e.g. labetalol, zidovudine) approach the PPV of metoprolol, but for poorly metabolized drugs, the intermediate permeability rate standards do not approach the NPV of chlorothiazide. Selecting metoprolol and chlorothiazide as additional standards allowed us to consider the regions of permeability rate that are highly predictive (low and high permeability rates), as well as regions of permeability rate with a higher degree of uncertainty in the predictability (low-intermediate and high-intermediate permeability rates). Table III depicts the predictive values when a compound has a low-intermediate permeability rate (predicted to be poorly metabolized), bounded by the permeability rates of chlorothiazide and the selected reference compound, or high-intermediate permeability rate (predicted to be extensively metabolized), bounded by the permeability rates of the selected reference compound and metoprolol.
Table IIb.
The number of drugs populating the datasets used for analysis above.
| Labetalol | Zidovudine | Theophylline | Dexamethasone | Methylprednisolone | Metoprolol | |
|---|---|---|---|---|---|---|
| CACO2 | 43,22,41 | 43, 41 | 23, 24, 17, 22, 15 | 23, 24, 43, 83, 15, 41, 22 | 24, 43, 84 | 23, 24, 43, 83, 18,17, 22, 41 |
| MDCK | 45, 20, 101, 26 | 27, 45, 101 | 20, 101 | 27, 45 | 27, 45 | 45, 20, 101 |
| PAMPA | 85 | 58, 85 | 32, 32, 58, 17, 85 | 17, 58, 85 | 17, 58, 85 | 32, 32, 17, 58, 17, 85 |
Two-tier Predictions
Table IV depicts the predictive values and accuracies for each elimination route and the accuracy of predicting the major route of elimination when utilizing a two-tier prediction. The in vitro two-tier prediction first uses a drug’s permeability rate as compared to a standard reference compound to predict the extent of metabolism, and then applies the previously published logistic regression model11 to predict the major route of elimination (biliary or renal) of compounds predicted to be poorly metabolized parent drugs. Figure 2 provides a visualization of the permeability rates of drugs by elimination route, compared with selected high (metoprolol), intermediate (zidovudine, dexamethasone), and low (chlorothiazide) permeability rate standards, and shows the predicted excretion route of parent drug. The two-tier approach using in vitro permeability rate data and the selected reference compounds as noted in group I in Table IVa resulted in an accuracy of 74±7%, 85±2%, and 73±8% for extensively metabolized, biliarily eliminated, and renally eliminated drugs, respectively, while choosing alternative compounds, listed in group III in Table IVa resulted in an accuracy of 71±6%, 83±4%, and 73±12% for extensively metabolized, biliarily eliminated, and renally eliminated drugs, respectively. Group II represents the predictability of permeability rate in very high (≥ metoprolol) or very low (≤ chlorothiazide) permeability rate regions. Group IV depicts the accuracy and predictability when indinavir, which gave the highest accuracy among the three datasets, but did not meet initial standard reference selection criteria, was selected as an intermediate reference compound.
Table III.
Predictive values of intermediate regions of permeability rates
| Reference | NPV of permeability rates [Chlorothiazide, Reference) | N= | PPV of permeability rates [Reference, Metoprolol) | N= |
|---|---|---|---|---|
| Labetalol | 0.59±0.27 | 7 | 0.87±0.07 | 7 |
| Zidovudine | 0.63±0.25 | 6 | 0.77±0.29 | 5 |
| Dexamethasone | 0.50±0.19 | 6 | 0.85±0.08 | 9 |
| Theophylline | 0.38±0.25 | 4 | 0.83±0.26 | 11 |
| Methylprednisolone | 0.52±0.19 | 5 | 0.86±0.10 | 5 |
| Salicylic Acid | 0.55±0.17 | 4 | 0.94±0.06 | 4 |
| Hydrocortisone | 0.48±0.11 | 5 | 0.88±0.12 | 9 |
N represents the number of datasets including both the reference compound and chlorothiazide or metoprolol
Figure 2.
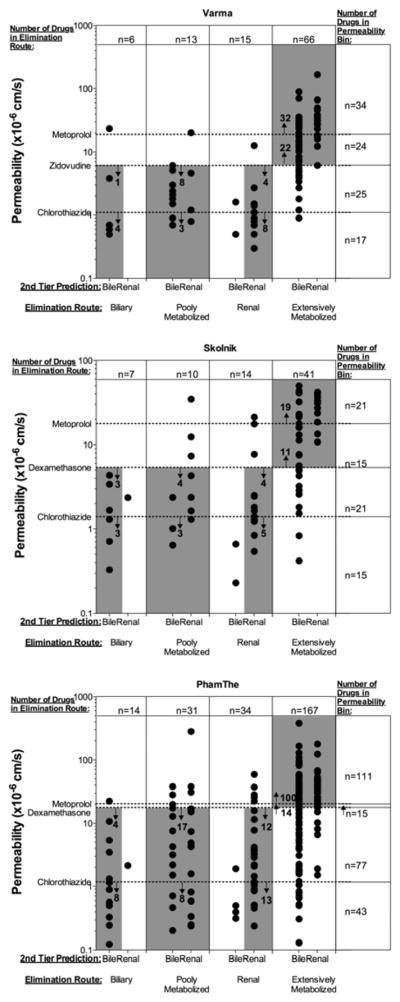
Two-tier predictions of major elimination route using in vitro permeability rate and in silico predicted elimination route of parent drug, segregated by the actual elimination route. Points within the grey boxes represent accurately predicted drugs. The number of correctly predicted drugs is labeled within the bounds of the permeability rate reference standard compounds for each elimination route.
Table IVb shows the performance of the two-tier prediction approach using in silico models to predict permeability rate/extent of metabolism utilizing the numeric threshold selected via 100×5 fold cross validation for each model, accurately predicting 72±9%, 49±10%, and 66±10% of metabolized, biliarily eliminated, and renally eliminated compounds respectively, where the VolSurf+ CACO2 model resulted in the highest predictability for biliary and renal elimination, and comparable predictability of metabolized compounds with the ADMET Predictor models.
Table IV.
Accuracy and predictive values of two-tier elimination route predictions.
| A. In vitro permeability rates | |||||||||
|---|---|---|---|---|---|---|---|---|---|
| % of Drugs Correctly Predicted
|
Predictive Value (%)
|
Accuracy
|
|||||||
| Metabolism | Biliary | Renal | Metabolism | Biliary | Renal | ||||
|
|
|
||||||||
| Groupa | Reference | Dataset | |||||||
| I | Zidovudine | Varma | 82 | 83 | 80 | 93 | 26 | 100 | 82 |
| I | Dexamethasone | Pham-The | 68 | 86 | 74 | 90 | 19 | 78 | 70 |
| I | Dexamethasone | Skolnik | 73 | 86 | 64 | 83 | 32 | 90 | 73 |
|
| |||||||||
| II | Metoprolol, Chlorothiazide | Varma | 94 | 67 | 100 | ||||
| II | Metoprolol, Chlorothiazide | Skolnik | 90 | 43 | 100 | ||||
| II | Metoprolol, Chlorothiazide | Pham-The | 90 | 36 | 100 | ||||
|
| |||||||||
| III | Labetalol | Varma | 67 | 83 | 87 | 96 | 19 | 87 | 71 |
| III | Methylprednisolone | Skolnik | 68 | 86 | 64 | 82 | 29 | 90 | 69 |
| III | Methylprednisolone | Pham-The | 77 | 79 | 68 | 86 | 22 | 82 | 75 |
|
| |||||||||
| IV | Indinavir | Varma | 94 | 67 | 80 | 91 | 40 | 100 | 90 |
| IV | Indinavir | Skolnik | 90 | 57 | 64 | 80 | 40 | 90 | 81 |
| IV | Indinavir | Pham-The | 87 | 64 | 41 | 78 | 28 | 88 | 79 |
| B. In silico permeability rates | ||||||||
|---|---|---|---|---|---|---|---|---|
| % of Drugs Correctly Predicted
|
Predictive Value (%)
|
Accuracy
|
||||||
| Metabolism | Biliary | Renal | Metabolism | Biliary | Renal | |||
|
|
|
|||||||
| Threshold | Dataset | |||||||
| 105.92 ± 9.48 | S+ MDCK | 0.73 ± 0.05 | 0.56 ± 0.17 | 0.59 ± 0.12 | 0.46 ± 0.01 | 0.15 ± 0.04 | 0.31 ± 0.04 | 0.69 ± 0.10 |
| 0.9 ± 0.06 | S+ Peff | 0.63 ± 0.04 | 0.37 ± 0.17 | 0.72 ± 0.11 | 0.46 ± 0.01 | 0.08 ± 0.03 | 0.31 ± 0.03 | 0.64 ± 0.05 |
| 0.05 ± 0.09 | VS+ CACO2 | 0.80 ± 0.07 | 0.54 ± 0.19 | 0.66 ± 0.11 | 0.45 ± 0.01 | 0.17 ± 0.05 | 0.35 ± 0.04 | 0.77 ± 0.03 |
Group I represents analyses of the drugs selected as single-cutoff permeability standards. Group II represents the predictive abilities of a high permeability standard (metoprolol) and a low permeability standard (chlorothiazide). Group III represents the performance of alternative standards. Group IV represents the performance of indinavir, which gives the highest average accuracy in the two-tier prediction for these datasets.
Extreme Outliers
Table V shows the compounds classified as extensively metabolized, but having a very low (< chlorothiazide) permeability rate in at least one dataset and compounds classified as poorly metabolized, but having a very high (> metoprolol) permeability rate in at least one dataset.
Table V.
Compounds exhibiting permeability rates uncharacteristic of the extent of metabolism in one or more datasets.
| Drug | Classified Extent of Metabolism | Outlier Frequencya | Dataset | Notesb | Ref |
|---|---|---|---|---|---|
| A. Outlier Compounds with Reported Permeability Rate < Chlorothiazide | |||||
| Bromocriptine | Extensive | 1/2 | A | Extensive first pass metabolism | 45 |
| Clofibrate | Extensive | 1/1 | A | Prodrug | 46 |
| Cyclosporine | Extensive | 1/1 | A | Extensively Metabolized | 47 |
| Enalapril | Extensive | 1/2 | A | Prodrug | 48 |
| Ketoconazole | Extensive | 1/3 | A | Extensively Metabolized | |
| Saquinavir | Extensive | 2/2 | B, C | Gut metabolism or Poor Bioavailability | 49 |
| Sulfasalazine | Extensive | 3/7 | A, B, D | Metabolized by bacteria | 50 |
| B. Outlier Compounds with Reported Permeability Rate > Metoprolol | |||||
| Atenolol | Poor | 1/16 | F | Eliminated Unchanged | |
| Captopril | Poor | 1/1 | A | 40–50% unchanged, remainder is the disulfide dimer of captopril and captopril-cysteine disulfide | 51 |
| Cephalexin | Poor | 1/4 | B | Eliminated unchanged | 52 |
| Ciprofloxacin | Poor | 1/4 | E | Eliminated unchanged | 53 |
| Clonidine | Poor | 2/3 | A, B | Extensively Metabolized | 54 |
| Disopyramide | Poor | 1/3 | F | 50% eliminated unchanged, 30% metabolized | 55 |
| Flecainide | Poor | 1/1 | E | Extensively Metabolized | 56 |
| Metoclopramide | Poor | 1/1 | C | Extensively Metabolized | 57 |
| Phenazopyridine | Poor | 1/1 | C | Extensively Metabolized | 58 |
| Pindolol | Poor | 1/9 | A | Extensively Metabolized | 59 |
| Procainamide | Poor | 1/1 | E | 40–70% eliminated unchanged, approximately 50% acetylated with a large range; acetylation may depend upon acetylator phenotype | 60 |
| Trimethoprim | Poor | 1/6 | A | 60–80% unchanged | 61 |
Zhu
Skolnik
Varma
Wang
Sugano
Teksin
Outlier frequency represents the number of times the compound exhibited an uncharacteristic permeability rate per the number of times the compound and the reference compound (chlorothiazide or metoprolol) were in the same dataset.
Notes reflect characteristics of the compound which may be valuable in understanding the uncharacteristic permeability rate.
We considered the regions of high permeability rate in each dataset that were uniquely occupied by extensively metabolized drugs and the regions of low permeability rate that were uniquely occupied by poorly metabolized drugs as a proportion of the extensively metabolized drugs or poorly metabolized drugs in the dataset, respectively. On average, 60±30% of the extensively metabolized drugs and 45±32% of poorly metabolized drugs occupied their respective unique permeability rate regions (p<0.01). We additionally considered the range of permeability rates occupied by metabolized compounds or poorly metabolized compounds. Metabolized compounds covered 75.9±56.3 × 10⁻⁶ cm/s on average, while poorly metabolized compounds covered 24.6±24.7 × 10⁻⁶ cm/s on average (p<0.0001), and the permeability rate range metabolized drugs covered was greater than the range of poorly metabolized compounds for every dataset.
Lipophilicity
Extensively metabolized compounds are significantly more lipophilic than poorly metabolized compounds (Figure 3). However, when poorly metabolized compounds are separated into major routes of elimination, there is no significant difference in mLogP or cLogP calculated in VolSurf+ between extensively metabolized compounds and compounds primarily eliminated as unchanged drug in the bile, although 21% of the metabolized compounds have a mLogP greater than the maximum mLogP (4.02) of biliarily eliminated compounds. There was a significant difference in the cLogP calculated by ADMET Predictor for extensively metabolized and biliarily eliminated drugs, but the area under the ROC curve = 0.63. The Pearson correlation coefficient of permeability rate to mLogP is 0.48±0.26.
Figure 3.

The measured and calculated logarithms of partition coefficients by major route of drug elimination.
Discussion
As our lab has proposed, in vitro measurements of permeability rate can predict when extensive metabolism is a major route of drug elimination. Varma et al. 5 demonstrated this principle while developing a provisional BDDCS classification based on in vitro measures. As permeability rate measurements between laboratories are notoriously variable, we wanted to extend the analysis to many datasets amongst Caco-2 and MDCK cell lines and PAMPA. We used BDDCS classes previously curated from clinical data by Benet et al.13 to represent the extent of metabolism. In vitro permeability rate is differentiable among extensively and poorly metabolized compounds as demonstrated by the AUCs > 0.8 shown in Table I, and this differentiability persists when poorly metabolized drugs are deconstructed into their major routes of elimination of parent drug. As expected, in vitro permeability rate does not discriminate between the major elimination routes of poorly metabolized compounds. In silico permeability rate predictions can provide a prediction of the extent of metabolism quickly, but with less differentiability (Table I).
We proposed that an alternative compound to metoprolol could serve as a permeability rate reference compound, such that drugs with permeability rates greater than the selected standard are predicted to be extensively metabolized in humans, while lower permeability rate drugs are predicted to be eliminated primarily unchanged in the bile or the urine. As a conservative reference, metoprolol is ineffective at identifying many metabolized compounds by their permeability rate. While compounds with permeability rates greater than metoprolol are almost certainly metabolized, using metoprolol’s permeability rate as a standard in Caco-2 or MDCK studies predicts many extensively metabolized drugs as eliminated as unchanged drug, as indicated by low sensitivity values of 28% in MDCK and 52% in Caco-2 (Table II). Our goal in choosing a reference standard, then, was to increase the negative predictive value, or the proportion of compounds with a low permeability rate relative to the reference that are truly poorly metabolized, while preserving the positive predictive value as much as possible. Our analysis indicated that labetalol or zidovudine might best serve the purpose of a single permeability discriminator for Caco-2 or MDCK cells, and theophylline might best serve the purpose of a single permeability discriminator for PAMPA. Although labetalol was not selected as the optimal standard reference compound for permeability rate studies in MDCK cells, it met the criteria for a standard reference compound for both MDCK and Caco-2 cell lines. Labetalol has previously been proposed as an alternative permeability rate standard35, and has been used as a reference standard in studies to predict BCS class22,28, but we are unaware of any studies that have rigorously tested its performance in multiple laboratories as a standard predictor of metabolism. In Caco-2 and MDCK cells, using labetalol, zidovudine, dexamethasone, or methylprednisolone as a reference compound results in correctly identifying a higher proportion of extensively metabolized drugs (an increase in sensitivity) than metoprolol, while increasing the negative predictive value, the confidence that a poorly permeable drug is poorly metabolized. The standards appear transferable between Caco-2 and MDCK cells, while these standards perform poorly for PAMPA. This difference is understandable as Caco-2 and MDCK are biological membranes that include uptake and efflux transporters and tight junctions for paracellular transport. However, there is little difference in predictive performance of the cell lines or PAMPA (Table IIa), assuming that the experimenter selects a standard substrate recommended for that system.
Additionally, there are a number of acceptable standards for the cell lines (Caco-2, MDCK). While the methodology we used provides confidence that these standards are preferable alternatives to metoprolol, discrepancies exist in the drugs used to develop each dataset. Therefore, this list is not exhaustive, and while we have provided a ranking of performance, any of the standards listed may be acceptable choices.
Metoprolol was selected naively as an alternative to theophylline in PAMPA, but remains a more conservative reference compound. While using less stringent reference compounds compared to metoprolol penalizes the positive predictive value of high permeability rate drugs and the specificity, the proportion of poorly metabolized drugs correctly identified, they still result in >90% positive predictive value and >80% specificity for the selection cell line (Table II).
Including additional reference compounds provides more informative predictions. When the permeability rate of drugs was broken into 4 sectors with permeability rate relative to high (metoprolol), intermediate (labetalol, zidovudine, dexamethasone, or methylprednisolone), and low (chlorothiazide) standards, an interesting pattern emerged. We noted that in many cases (14/18 combinations of reference standard with in vitro method) a single segregation by intermediate permeability references resulted in greater specificities than sensitivities (Table II). While only around 50% of the low-intermediate permeability drugs were correctly identified as poorly metabolized (NPV), greater than 85% of the high-intermediate permeability rate drugs are extensively metabolized (PPV) (Table III). In addition, a smaller proportion of poorly metabolized drugs populated the low permeability rate regions unique to poorly metabolized drugs than uniquely highly metabolized dugs populated the high permeability regions. Finally, the range of permeability rates for metabolized compounds vastly exceeds the range observed for non-metabolized drugs. These may indicate that while highly permeable drugs require metabolic elimination, as we have hypothesized35, high permeability rate may not be mandatory for drug metabolism. Rather, a drug with a low-intermediate permeability rate is equally likely to be eliminated unchanged or by metabolism. As new molecular entities follow a similar distribution of extent of metabolism (extensive or poor metabolism)35, we expect that in vitro permeability rate will be an indicator of the extent of the metabolism for future compounds.
When predicting the major route of elimination of orally administered drugs with a two-tier approach, the uncertainty in each tier is naturally multiplicative, and therefore excellent results (>80% accuracy) are difficult to obtain. We were able to obtain accuracy >79% in all three datasets when indinavir was used as the reference compound (Table IV). However, accuracy is skewed by the success of predicting the highly populated extensively metabolized drugs, while zidovudine and dexamethasone provide more balanced accuracy across the major routes of elimination. On the other hand, indinavir provides well-balanced and higher predictive values, and may be a useful reference compound. It was only present in the Varma (MDCK), Skolnik (Caco-2), and PhamThe datasets and therefore did not meet the minimum number of datasets per cell line as a selection criteria for standard reference compounds. It would therefore be useful to consider indinavir as a reference compound in future studies.
While the previously defined model11 almost always correctly assigns renally and biliarily eliminated drugs, extensively metabolized drugs invade low-permeability rate compounds. For this reason, there may be little value in assessing metabolic clearance of low-permeability rate compounds in vitro. Renally cleared compounds are unlikely to be metabolized in vitro, while biliarily eliminated compounds may be metabolized in microsomes11 and may be confounded with lower-permeability rate metabolized compounds. By utilizing a high, intermediate, and low standard, regions of uncertainty can be better characterized, and regions of high predictive value can be prioritized. Therefore, if the permeability rate is greater than metoprolol, it is safe to assume that the drug is extensively metabolized. If the drug has a very low permeability, i.e. less than chlorothiazide, the drug is very likely poorly metabolized, and the in silico model predicting biliary elimination may be applied. In the three datasets considered, all of the low permeability rate compounds predicted as renally eliminated were correctly predicted. When the compound exhibits a permeability rate between chlorothiazide and metoprolol, the intermediate “best standard” can predict the extent of metabolism, followed by the in silico model for a prediction, although in vivo experiments may still be required, particularly if the drug is predicted to be eliminated in the bile. This is, however, still an improvement in predicting which compounds are likely to be eliminated as unchanged drug in the bile.
Two-tier performance was evaluated with permeability rate in reference to the standard with the highest average sensitivity and specificity among all datasets in the cell line containing the standard. Therefore, zidovudine was selected as the MDCK cell line standard for the Varma dataset. Labetalol was the highest ranking permeability rate standard for Caco-2, but was not available in the Skolnik dataset, so the second highest ranking standard, dexamethasone, was selected. We selected dexamethasone as the standard reference compound for the Pham-The dataset as the permeability rate of labetalol was greater than that of metoprolol. This only occurred in one other dataset (Zhu), of the eight datasets, including the Pham-The dataset. It is important to note that the permeability rates given in the Pham-The dataset are an average from several datasets and therefore do not meet our initial selection criteria and may not be representative of permeability rates in a single lab. Additionally, the Zhu dataset29 had the greatest percentage of outliers in its dataset (13% of the orally administered drugs).
While threshold independent evaluations of in silico permeability rate predictions indicated that the VS+ CACO2 model could significantly differentiate extensively from poorly metabolized compounds and the MDCK model approached significant differentiability, the loss of differentiability compared to in vitro methods may contribute to the poor sensitivity, specificity and predictive values in the two-tier approach compared to in vitro methods. We therefore recommend that initial permeability rate studies be conducted in vitro.
As we have recognized previously11, molecular weight is an inadequate predictor of biliary excretion, as biliarily eliminated drugs encompass only 12% of orally administered drugs with MW > 380 Da and 20% of orally administered drugs with MW > 475 Da and this number drops significantly when including non-orally administered drugs. However, combining in vitro permeability rate and the logistic regression model vastly improves the success rate, achieving up to 67% predictability for biliary excretion being the major route of elimination when comparing permeability rate to a conservative reference (i.e. chlorothiazide).
Despite the success of this two-tier approach, we noted that there were BDDCS class 1 and 2 drugs with reported very low permeability rates (< chlorothiazide), and BDDCS class 3 and 4 drugs with reported very high permeability rates (> metoprolol). We therefore reviewed these compounds for discrepencies between the listed BDDCS classes, and conflicting literature (Table V). This table indicates the number of times the compound was an outlier per the number of datasets containing the compound and the reference compound (Cholorothiazide in part A, Metoprolol is part B). Notably, in the BDDCS classification publication, extensively metabolized compounds were not limited to compounds metabolized by metabolic processes subsequent to absorption, such as cytochrome P450 or phase II metabolism, as was initially proposed2,3, but was extended to all extensively metabolized drugs (≥70% metabolism). Therefore, drugs such as sulfasalazine, which is metabolized by bacteria in the gut, may not follow the high permeability/extensive metabolism relationship. No extensively metabolized drugs appear to have been misclassified by BDDCS. Of the high permeability rate poorly metabolized drugs, there were five BDDCS class 3 and 4 compounds (clonidine, flecainide, metoclopramide, phenazopyridine, and pindolol) that may have been misclassified, and may be extensively metabolized. Interestingly, 4/5 of these compounds (all except metoclopramide) were listed with intermediate fractions excreted unchanged in the urine (35<fe<65), which may indicate multiple elimination routes and variable reports regarding the major elimination route. Other notes reported in Table V indicate additional possibilities of incorrect prediction due to permeability rate. We note that many of the outlier compounds have a low frequency of incorrect prediction based on permeability rate (e.g. atenolol is only an outlier in 1/16 datasets), and subsequent evaluations of permeability rate may indicate that the compound in question is correctly identified by permeability rate. More than half of the outlier drugs (10/19) were found in the Zhu et al. dataset29.
Lipophilicity
Using both measured and calculated LogPs, we have shown that while extensively metabolized drugs are more lipophilic than poorly metabolized drugs, this relationship deteriorates by considering biliarily eliminated drugs as a subgroup of the poorly metabolized drugs (Figure 3). While there is a significant difference in the LogP calculated by ADMET Predictor of extensively metabolized versus biliarily eliminated compounds, the area under the ROC curve = 0.63, indicating no differentiability. Indeed, for the measured LogP or the VolSurf+ calculated LogPs (where the nonpolar phase is either octanol or cyclohexane), there is no significant difference in lipophilicity between metabolized and biliarily eliminated drugs, and biliarily eliminated drugs are significantly more lipophilic than renally eliminated drugs. Additionally, some groups have found no difference between the lipophilicity of biliarily and non-biliarily eliminated compounds12,36, while others found that biliarily eliminated compounds are more hydrophilic37,38. Uncontested, urinary excretion is negatively correlated with lipophilicity39. High lipophilicity is often considered a surrogate for high passive membrane permeability, and it has been observed that highly lipophilic compounds have high affinity for metabolizing enzymes/are extensively metabolized by cytochrome P45039–41 and UGTs42. We found a modest correlation between the measured LogP and in vitro permeability rates, though with a large standard deviation. The active sites of CYP enzymes are localized on the cytosolic side of the endoplasmic reticulum, while the active site of UGT enzymes are localized on the lumenal side of the endoplasmic reticulum43. The binding region of P-glycoprotein (P-gp), a transporter responsible for biliary efflux, is located in the transmembrane region44. Increased lipophilicity has been hypothesized to be required for successful permeation across membranes encasing UGT enzymes within the endoplasmic reticulum42, or P-gp within the plasma membrane37. However, due to the localization of CYP enzymes and other transporters, it is unlikely that increased lipophilicity in metabolism and biliary excretion is due to enzyme or transporter access across a membrane. The presumed relationship between permeability rate and lipophilicity might indicate that highly lipophilic drugs are metabolized due to reabsorption from the bile or urine. However, as biliarily eliminated compounds are highly lipophilic, it is more likely that lipophilicity, while slightly correlated with permeability, actually represents increased hydrophobic interactions that allow metabolized compounds and biliarily eliminated compounds to interact with metabolizing enzymes39 and transporters36, respectively. Considering the large variability in the relationship between mLogP and in vitro permeability rates, as well as overlapping lipophilicities of metabolized and biliarily eliminated compounds, lipophilicity is not an appropriate predictor of permeability rate and/or extent of metabolism.
Conclusions
In vitro permeability rate of compounds compared to reference compounds such as labetalol, dexamethasone, or methylprednisolone are acceptable predictors of the extent of metabolism in Caco-2 cells; zidovudine or labetalol are acceptable predictors of the extent of metabolism in MDCK cells; and theophylline or metoprolol serve as appropriate references for PAMPA. Highly permeable drugs, especially those with permeability rates greater than metoprolol are very likely to require metabolic elimination, and while extensively metabolized drugs tend to be more highly permeable than poorly metabolized drugs, high permeability rate may not be required for a compound to be metabolized. The major route of elimination of a drug intended for oral administration may be predicted using a two-tier approach by predicting extent of metabolism using permeability rate, and parent drug excretion of poorly metabolized drugs with a logistic regression model incorporating calculated metabolic stability and polarizability. This two-tier approach correctly predicts 72±9%, 49±10%, and 66±7% of extensively metabolized, biliarily eliminated, and renally eliminated parent drugs, respectively when permeability rates are predicted in silico, but 74±7%, 85±2%, and 73±8% of extensively metabolized, biliarily eliminated, and renally eliminated parent drugs, respectively when permeability studies are carried out in vitro. Thus, in silico permeability rates can predict extensively metabolized and renally eliminated parent drugs reasonably well, but to have confidence in predicting biliary excretion of an NME, a simple in vitro permeability study appears necessary.
Supplementary Material
Acknowledgments
Chelsea Hosey was supported in part by NIH Training Grant T32 GM007175 and the Pharmaceutical Research and Manufacturers of America (PhRMA) Foundation Pre Doctoral Fellowship in Pharmaceutics. This work was supported in part by NIH grants GM061390 and GM113597.
Footnotes
Supporting Information Available
A supporting table detailing the distribution of drugs by their major route of elimination per dataset is available. This information is available free of charge via the Internet at http://pubs.acs.org/.
References
- 1.Amidon GL, Lennernäs H, Shah VP, Crison JR. A Theoretical Basis for a Biopharmaceutic Drug Classification: the Correlation of In Vitro Drug Product Dissolution and In Vivo Bioavailability. Pharm Res. 1995;12:413–420. doi: 10.1023/a:1016212804288. [DOI] [PubMed] [Google Scholar]
- 2.Wu CY, Benet LZ. Predicting Drug Disposition via Application of BCS: Transport/Absorption/Elimination Interplay and Development of a Biopharmaceutics Drug Disposition Classification System. Pharm Res. 2005;22:11–23. doi: 10.1007/s11095-004-9004-4. [DOI] [PubMed] [Google Scholar]
- 3.Chen ML, Amidon GL, Benet LZ, Lennernäs H, Yu LX. The BCS, BDDCS, and Regulatory Guidances. Pharm Res. 2011;28:1774–1778. doi: 10.1007/s11095-011-0438-1. [DOI] [PubMed] [Google Scholar]
- 4.Food and Drug Administration Center for Drug Evaluation and Research. Guidance for Industry: Waiver of In Vivo Bioavailability and Bioequivalence Studies for Immediate-Release Solid Oral Dosage Forms based on a Biopharmaceutics Classification System. [accessed Jul 28, 2014];US FDA website. http://www.fda.gov/downloads/Drugs/GuidanceComplianceRegulatoryInformation/Guidances/UCM070246.pdf.
- 5.Varma MV, Gardner I, Steyn SJ, Nkansah P, Rotter CJ, Whitney-Pickett C, Zhang H, Di L, Cram M, Fenner KS, El-Kattan AF. pH-Dependent Solubility and Permeability Criteria for Provisional Biopharmaceutics Classification (BCS and BDDCS) in Early Drug Discovery. Mol Pharm. 2012;9:1199–1212. doi: 10.1021/mp2004912. [DOI] [PubMed] [Google Scholar]
- 6.Volpe DA. Variability in Caco-2 and MDCK Cell-Based Intestinal Permeability Assays. J Pharm Sci. 2007;97:712–725. doi: 10.1002/jps.21010. [DOI] [PubMed] [Google Scholar]
- 7.Dahan A, Lennernäs H, Amidon GL. The Fraction Dose Absorbed, in Humans, and High Jejunal Human Permeability Relationship. Mol Pharm. 2012;9:1847–1851. doi: 10.1021/mp300140h. [DOI] [PMC free article] [PubMed] [Google Scholar]
- 8.Zur M, Gasparini M, Wolk O, Amidon GL, Dahan A. The Low/High BCS Permeability Class Boundary: Physicochemical Comparison of Metoprolol and Labetalol. Mol Pharm. 2014;11:1707–1714. doi: 10.1021/mp500152y. [DOI] [PubMed] [Google Scholar]
- 9.Larregieu CA, Benet LZ. Distinguishing Between the Permeability Relationships with Absorption and Metabolism to Improve BCS and BDDCS Predictions in Early Drug Discovery. Mol Pharm. 2014;11:1335–1344. doi: 10.1021/mp4007858. [DOI] [PMC free article] [PubMed] [Google Scholar]
- 10.Larregieu CA, Benet LZ. Drug Discovery and Regulatory Considerations for Improving In Silico And In Vitro Predictions That Use Caco-2 as a Surrogate for Human Intestinal Permeability Measurements. AAPS J. 2013;15:483–497. doi: 10.1208/s12248-013-9456-8. [DOI] [PMC free article] [PubMed] [Google Scholar]
- 11.Hosey CM, Broccatelli F, Benet LZ. Predicting When Biliary Excretion of Parent Drug Is a Major Route of Elimination in Humans. AAPS J. 2014;16:1085–1096. doi: 10.1208/s12248-014-9636-1. [DOI] [PMC free article] [PubMed] [Google Scholar]
- 12.Yang X, Gandhi YA, Duignan DB, Morris ME. Prediction of Biliary Excretion in Rats and Humans Using Molecular Weight and Quantitative Structure–Pharmacokinetic Relationships. AAPS J. 2009;11:511–525. doi: 10.1208/s12248-009-9124-1. [DOI] [PMC free article] [PubMed] [Google Scholar]
- 13.Benet LZ, Broccatelli F, Oprea TI. BDDCS Applied to Over 900 Drugs. AAPS J. 2011;13:519–547. doi: 10.1208/s12248-011-9290-9. [DOI] [PMC free article] [PubMed] [Google Scholar]
- 14.Yazdanian M, Glynn SL, Wright JL, Hawi A. Correlating Partitioning and Caco-2 Cell Permeability of Structurally Diverse Small Molecular Weight Compounds. Pharm Res. 1998;15:1490–1494. doi: 10.1023/a:1011930411574. [DOI] [PubMed] [Google Scholar]
- 15.Stenberg P, Norinder U, Luthman K, Artursson P. Experimental and Computational Screening Models for the Prediction of Intestinal Drug Absorption. J Med Chem. 2001;44:1927–1937. doi: 10.1021/jm001101a. [DOI] [PubMed] [Google Scholar]
- 16.Skolnik S, Lin X, Wang J, Chen XH, He T, Zhang B. Towards Prediction of In Vivo Intestinal Absorption Using a 96-Well Caco-2 Assay. J Pharm Sci. 2010;99:3246–3265. doi: 10.1002/jps.22080. [DOI] [PubMed] [Google Scholar]
- 17.Camenisch G, Alsenz J, van de Waterbeemd H, Folkers G. Estimation of Permeability by Passive Diffusion Through Caco-2 Cell Monolayers Using the Drugs’ Lipophilicity and Molecular Weight. Eur J Pharm Sci. 1998;6:317–324. [PubMed] [Google Scholar]
- 18.Yamashita S, Furubayashi T, Kataoka M, Sakane T, Sezaki H, Tokuda H. Optimized Conditions for Prediction of Intestinal Drug Permeability Using Caco-2 Cells. Eur J Pharm Sci. 2000;10:195–204. doi: 10.1016/s0928-0987(00)00076-2. [DOI] [PubMed] [Google Scholar]
- 19.Chong S, Dando SA, Soucek KM, Morrison RA. In Vitro Permeability Through Caco-2 Cells Is Not Quantitatively Predictive of In Vivo Absorption for Peptide-Like Drugs Absorbed via the Dipeptide Transporter System. Pharm Res. 1996;13:120–123. doi: 10.1023/a:1016045820933. [DOI] [PubMed] [Google Scholar]
- 20.Yee S. In Vitro Permeability Across Caco-2 Cells (Colonic) Can Predict In Vivo (Small Intestinal) Absorption in Man--Fact or Myth. Pharm Res. 1997;14:763–766. doi: 10.1023/a:1012102522787. [DOI] [PubMed] [Google Scholar]
- 21.Irvine JD, Takahashi L, Lockhart K, Cheong J, Tolan JW, Selick HE, Grove JR. MDCK (Madin-Darby Canine Kidney) Cells: a Tool for Membrane Permeability Screening. J Pharm Sci. 1999;88:28–33. doi: 10.1021/js9803205. [DOI] [PubMed] [Google Scholar]
- 22.Volpe DA, Faustino PJ, Ciavarella AB, Asafu-Adjaye EB, Ellison CD, Yu LX, Hussain AS. Classification of Drug Permeability with a Caco-2 Cell Monolayer Assay. Clin Res Regul Aff. 2007;24:39–47. [Google Scholar]
- 23.Fujikawa M, Nakao K, Shimizu R, Akamatsu M. QSAR Study on Permeability of Hydrophobic Compounds with Artificial Membranes. Bioorg Med Chem. 2007;15:3756–3767. doi: 10.1016/j.bmc.2007.03.040. [DOI] [PubMed] [Google Scholar]
- 24.Teksin ZS, Seo PR, Polli JE. Comparison of Drug Permeabilities and BCS Classification: Three Lipid-Component PAMPA System Method Versus Caco-2 Monolayers. AAPS J. 2010;12:238–241. doi: 10.1208/s12248-010-9176-2. [DOI] [PMC free article] [PubMed] [Google Scholar]
- 25.Li C, Wainhaus S, Uss AS, Cheng K-C. High-Throughput Screening Using Caco-2 Cell and PAMPA Systems. In: Erhardt C, Kim K-J, editors. Drug Absorption Studies: In Situ, In Vitro and In Silico Models. VII. Springer; New York: 2008. pp. 418–429. [Google Scholar]
- 26.Chen LL, Yao J, Yang JB, Yang J. Predicting MDCK Cell Permeation Coefficients of Organic Molecules Using Membrane-Interaction QSAR Analysis. Acta Pharmacol Sin. 2005;26:1322–1333. doi: 10.1111/j.1745-7254.2005.00166.x. [DOI] [PubMed] [Google Scholar]
- 27.Wang Q, Rager JD, Weinstein K, Kardos PS, Dobson GL, Li J, Hidalgo IJ. Evaluation of the MDR-MDCK Cell Line as a Permeability Screen for the Blood–Brain Barrier. Int J Pharm (Amsterdam, Neth) 2005;288:349–359. doi: 10.1016/j.ijpharm.2004.10.007. [DOI] [PubMed] [Google Scholar]
- 28.Thiel-Demby VE, Humphreys JE, St John Williams LA, Ellens HM, Shah N, Ayrton AD, Polli JW. Biopharmaceutics Classification System: Validation and Learnings of an In Vitro Permeability Assay. Mol Pharm. 2009;6:11–18. doi: 10.1021/mp800122b. [DOI] [PubMed] [Google Scholar]
- 29.Zhu C, Jiang L, Chen TM, Hwang KK. A Comparative Study of Artificial Membrane Permeability Assay for High Throughput Profiling of Drug Absorption Potential. Eur J Med Chem. 2002;37:399–407. doi: 10.1016/s0223-5234(02)01360-0. [DOI] [PubMed] [Google Scholar]
- 30.Chen X, Murawski A, Patel K, Crespi CL, Balimane PV. A Novel Design of Artificial Membrane for Improving the PAMPA Model. Pharm Res. 2008;25:1511–1520. doi: 10.1007/s11095-007-9517-8. [DOI] [PubMed] [Google Scholar]
- 31.Sugano K, Takata N, Machida M, Saitoh K, Terada K. Prediction of Passive Intestinal Absorption Using Bio-Mimetic Artificial Membrane Permeation Assay and the Paracellular Pathway Model. Int J Pharm (Amsterdam, Neth) 2002;241:241–251. doi: 10.1016/s0378-5173(02)00240-5. [DOI] [PubMed] [Google Scholar]
- 32.Cruciani C, Crivori P, Carrupt PA, Testa B. Molecular Fields in Quantitative Structure-Permeation Relationships: the VolSurf Approach. J Mol Struct: THEOCHEM. 2000;503:17–30. [Google Scholar]
- 33.Crivori P, Cruciani G, Carrupt PA, Testa B. Predicting Blood-Brain Barrier Permeation From Three-Dimensional Molecular Structure. J Med Chem. 2000;43:2204–2216. doi: 10.1021/jm990968+. [DOI] [PubMed] [Google Scholar]
- 34.Pham-The H, Garrigues T, Bermejo M, González-Álvarez I, Monteagudo MC, Cabrera-Pérez MÁ. Provisional Classification and In Silico Study of Biopharmaceutical System Based on Caco-2 Cell Permeability and Dose Number. Mol Pharm. 2013;10:2445–2461. doi: 10.1021/mp4000585. [DOI] [PubMed] [Google Scholar]
- 35.Benet LZ. The Role of BCS (Biopharmaceutics Classification System) and BDDCS (Biopharmaceutics Drug Disposition Classification System) in Drug Development. J Pharm Sci. 2012;102:34–42. doi: 10.1002/jps.23359. [DOI] [PMC free article] [PubMed] [Google Scholar]
- 36.Proost JH, Roggeveld J, Wierda JM, Meijer DK. Relationship Between Chemical Structure and Physicochemical Properties of Series of Bulky Organic Cations and Their Hepatic Uptake and Biliary Excretion Rates. J Pharmacol Exp Ther. 1997;282:715–726. [PubMed] [Google Scholar]
- 37.Varma MVS, Chang G, Lai Y, Feng B, El-Kattan AF, Litchfield J, Goosen TC. Physicochemical Property Space of Hepatobiliary Transport and Computational Models for Predicting Rat Biliary Excretion. Drug Metab Dispos. 2012;40:1527–1537. doi: 10.1124/dmd.112.044628. [DOI] [PubMed] [Google Scholar]
- 38.Sharifi M, Ghafourian T. Estimation of Biliary Excretion of Foreign Compounds Using Properties of Molecular Structure. AAPS J. 2013;16:65–78. doi: 10.1208/s12248-013-9541-z. [DOI] [PMC free article] [PubMed] [Google Scholar]
- 39.van de Waterbeemd H, Smith DA, Jones BC. Lipophilicity in PK Design: Methyl, Ethyl, Futile. J Comput-Aided Mol Des. 2001;15:273–286. doi: 10.1023/a:1008192010023. [DOI] [PubMed] [Google Scholar]
- 40.Varma MVS, Obach RS, Rotter C, Miller HR, Chang G, Steyn SJ, El-Kattan A, Troutman MD. Physicochemical Space for Optimum Oral Bioavailability: Contribution of Human Intestinal Absorption and First-Pass Elimination. J Med Chem. 2010;53:1098–1108. doi: 10.1021/jm901371v. [DOI] [PubMed] [Google Scholar]
- 41.Obach RS, Lombardo F, Waters NJ. Trend Analysis of a Database of Intravenous Pharmacokinetic Parameters in Humans for 670 Drug Compounds. Drug Metab Dispos. 2008;36:1385–1405. doi: 10.1124/dmd.108.020479. [DOI] [PubMed] [Google Scholar]
- 42.Smith PA, Sorich MJ, McKinnon RA, Miners JO. In Silico Insights: Chemical and Structural Characteristics Associated with Uridine Diphosphate-Glucuronosyltransferase Substrate Selectivity. Clin Exp Pharmacol Physiol. 2003;30:836–840. doi: 10.1046/j.1440-1681.2003.03923.x. [DOI] [PubMed] [Google Scholar]
- 43.Cribb AE, Peyrou M, Muruganandan S, Schneider L. The Endoplasmic Reticulum in Xenobiotic Toxicity. Drug Metab Rev. 2005;37:405–442. doi: 10.1080/03602530500205135. [DOI] [PubMed] [Google Scholar]
- 44.Dolghih E, Bryant C, Renslo AR, Jacobson MP. Predicting Binding to P-Glycoprotein by Flexible Receptor Docking. PLoS Comput Biol. 2011;7:e1002083. doi: 10.1371/journal.pcbi.1002083. [DOI] [PMC free article] [PubMed] [Google Scholar]
- 45.Cycloset [Product Insert] San Diego, CA: Santaurus, Inc; 2010. [Google Scholar]
- 46.Miller DB, Spence JD. Clinical Pharmacokinetics of Fibric Acid Derivatives (Fibrates) Clin Pharmacokinet. 1998;34:155–162. doi: 10.2165/00003088-199834020-00003. [DOI] [PubMed] [Google Scholar]
- 47.Sandimmune [Product Insert] East Hanover, NJ: Novartis Pharmaceuticals Corporation; 2013. [Google Scholar]
- 48.Vasotec Tablets (Enalapril) [Product Insert] Valeant Pharmaceuticals International, Inc; Bridgewater, NJ: 2011. [Google Scholar]
- 49.Invirase [Product Insert] South San Francisco: Genentech USA, Inc; 2004. [Google Scholar]
- 50.Azulfidine EN-tabs [Product Insert] New York, New York: Pfizer Pharmacia & Upjohn Co; 2014. [accessed Aug 14, 2014]. [Google Scholar]
- 51.Capoten [Product Insert] Montreal, CA: Bristol-Myers Squibb Canada; 1981. [Google Scholar]
- 52.Cephalexin Capsule [Product Insert] Baltimore, MD: Lupin Pharmaceuticals, Inc; 1977. [Google Scholar]
- 53.Cipro [Product Insert] Wayne, NJ: Bayer HealthCare Pharmaceuticals Inc; 2014. [Google Scholar]
- 54.Captapres-TTS [Product Insert] Ridgefield, CT: Boehringer Ingelheim Pharmaceuticals, Inc; 2012. [Google Scholar]
- 55.Norpace [Product Insert] New York, NY: Pfizer Inc; 2006. [Google Scholar]
- 56.Flecainide Acetate Tablet [Product Insert] Sellersville, PA: Teva Pharmaceuticals USA; 2013. [Google Scholar]
- 57.Bateman DN. Clinical Pharmacokinetics of Metoclopramide. Clin Pharmacokinet. 1983;8:523–529. doi: 10.2165/00003088-198308060-00003. [DOI] [PubMed] [Google Scholar]
- 58.Phenazopyridine HCl [Product Insert] Coral Springs, FL: Boca Pharmacal, Inc; 2010. [Google Scholar]
- 59.Pindolol Tablet [Product Insert] Morgantown, WV: Mylan Pharmaceuticals Inc; 2010. [Google Scholar]
- 60.Pronestyl SR [Product Insert] Princeton, NJ: E.R. Squibb & Sons, L.L.C; 2000. [Google Scholar]
- 61. [accessed Oct 15, 2014];Lexicomp Online. http://www.crlonline.com/lco/action/doc/retrieve/docid/patch_f/7826.
Associated Data
This section collects any data citations, data availability statements, or supplementary materials included in this article.