

Olivetolic acid cyclase from C. sativa L. has been overexpressed in E. coli, purified and crystallized. Diffraction data have been collected to a resolution of 1.40 Å.
Keywords: cannabinoids, Cannabis sativa, cyclase, olivetolic acid
Abstract
Plant polyketides are a structurally diverse family of natural products. In the biosynthesis of plant polyketides, the construction of the carbocyclic scaffold is a key step in diversifying the polyketide structure. Olivetolic acid cyclase (OAC) from Cannabis sativa L. is the only known plant polyketide cyclase that catalyzes the C2–C7 intramolecular aldol cyclization of linear pentyl tetra-β-ketide-CoA to generate olivetolic acid in the biosynthesis of cannabinoids. The enzyme is also thought to belong to the dimeric α+β barrel (DABB) protein family. However, because of a lack of functional analysis of other plant DABB proteins and low sequence identity with the functionally distinct bacterial DABB proteins, the catalytic mechanism of OAC has remained unclear. To clarify the intimate catalytic mechanism of OAC, the enzyme was overexpressed in Escherichia coli and crystallized using the vapour-diffusion method. The crystals diffracted X-rays to 1.40 Å resolution and belonged to space group P3121 or P3221, with unit-cell parameters a = b = 47.3, c = 176.0 Å. Further crystallographic analysis will provide valuable insights into the structure–function relationship and catalytic mechanism of OAC.
1. Introduction
Plant polyketides, such as flavonoids, stilbenes and phloroglucinols, are one of the largest and most important families of natural products, with remarkable structural diversity and biological activities. In the biosynthesis of plant polyketides, the construction of the carbocyclic scaffold is a key step in diversifying the polyketide structures. This process is generally catalyzed by a type III polyketide synthase (PKS) by carbon-chain elongation and the subsequent cyclization of the highly reactive poly-β-keto intermediate (Schröder, 1999 ▸; Austin & Noel, 2003 ▸; Abe & Morita, 2010 ▸). Recent studies have suggested that the biosyntheses of plant polyketides, such as the anthranoids (Abe et al., 2005 ▸; Abdel-Rahman et al., 2013 ▸) and cannabinoids (Taura et al., 2009 ▸; Gagne et al., 2012 ▸) produced by Aloe arborescens and Cannabis sativa, respectively, require additional enzymes for proper folding cyclization of the linear poly-β-keto intermediate to generate the final products, as in the cases of bacterial polyketide biosyntheses.
The recently identified olivetolic acid cyclase (OAC) from C. sativa is a novel polyketide cyclase that is proposed to be involved in the biosynthesis of cannabinoids. The enzyme is the only known plant polyketide cyclase, and is thought to accept the linear pentyl tetra-β-ketide CoA produced by a type III PKS tetraketide synthase (TKS) as the substrate and perform a C2–C7 aldol cyclization, thioester bond cleavage and aromatization reactions to generate olivetolic acid (OA) without requiring any cofactors (Fig. 1 ▸; Gagne et al., 2012 ▸). OAC shares 30–48% identity with functionally unidentified plant dimeric α+β barrel (DABB) proteins such as the structurally characterized heat-stable protein (AtHS1) from Arabidopsis thaliana (48% identity; Bingman et al., 2004 ▸; Lytle et al., 2004 ▸), boiling-stable protein (SP1) from Populus tremula (38% identity; Dgany et al., 2004 ▸) and At5g22580 from A. thaliana (32% identity; Cornilescu et al., 2004 ▸). OAC also shares low sequence identity (less than 20%) with bacterial DABB proteins such as the structurally characterized bacterial polyketide cyclase tetracenomycin F2 cyclase (TcmI) from Streptomyces glaucescens (17% identity; Thompson et al., 2004 ▸) and the functionally distinct, structurally characterized ActVA-Orf6 monooxygenase from S. coelicolor (15% identity; Sciara et al., 2003 ▸) and 4-methylmuconolactone methylisomerase (MLMI) from Pseudomonas reinekei (13% identity; Marín et al., 2009 ▸).
Figure 1.

Proposed mechanism for the formation of olivetolic acid by OAC.
On the basis of these findings and of a comparison of the homology model of OAC with the three-dimensional structures of plant and bacterial DABB proteins, OAC has been proposed to be a homodimeric protein consisting of 12.2 kDa subunits and to possess a hydrophobic tunnel as the active-site cavity in each monomer (Gagne et al., 2012 ▸), as in the cases of the other structurally characterized DABB proteins. Furthermore, site-directed mutagenesis studies have suggested that three His residues (His5, His57 and His78) play crucial roles in the OA-forming activity (Gagne et al., 2012 ▸). However, the catalytic mechanism underlying the substrate and product specificities, the aldol cyclization and aromatization reactions and the thioester bond cleavage, as well as the catalytic roles of the three His residues in the OA-forming activity, have remained unclear. Therefore, to further clarify the intimate structural details of the reaction catalyzed by OAC, we expressed glutathione S-transferase (GST)-fused recombinant OAC in Escherichia coli, removed the GST portion and obtained good-quality crystals of recombinant OAC.
2. Materials and methods
2.1. Expression and purification
The cDNA encoding full-length OAC, with SmaI/SalI sites just before the initiation codon and after the stop codon, respectively, was purchased from Eurofins Genomics (Table 1 ▸). The cDNA was digested with SmaI/SalI and was ligated into the SmaI/SalI sites of the modified pQE-80L vector (Qiagen) for expression as a fusion protein with GST at the N-terminus. A PreScission Protease (GE Healthcare) cleavage site was introduced between GST and OAC. The constructed expression plasmid was transformed into E. coli M15 cells (Qiagen) and the cells harbouring the plasmid were cultured to an OD600 of 0.6 in Luria broth (LB) medium containing 100 µg ml−1 ampicillin at 310 K. Isopropyl β-d-1-thiogalactopyranoside was added to a final concentration of 1 mM to induce protein expression and the culture was incubated at 290 K for a further 20 h.
Table 1. Macromolecule-production information.
| Source organism | C. sativa L. |
| DNA source | Chemical synthesis |
| Cloning vector | pEX-A |
| Expression vector | pQE-80L |
| Expression host | E. coli M15 (Qiagen) |
| Complete amino-acid sequence of the construct produced† | MRGSHHHHHHGSMSPILGYWKIKGLVQPTRLLLEYLEEKYEEHLYERDEGDKWRNKKFELGLEFPNLPYYIDGDVKLTQSMAIIRYIADKHNMLGGCPKERAEISMLEGAVLDIRYGVSRIAYSKDFETLKVDFLSKLPEMLKMFEDRLCHKTYLNGDHVTHPDFMLYDALDVVLYMDPMCLDAFPKLVCFKKRIEAIPQIDKYLKSSKYIAWPLQGWQATFGGGDHPPKSD LEVLFQGPGMAVKHLIVLKFKDEITEAQKEEFFKTYVNLVNIIPAMKDVYWGKDVTQKNKEEGYTHIVEVTFESVETIQDYIIHPAHVGFGDVYRSFWEKLLIFDYTPRK |
The amino-acid sequence of the glutathione S-transferase (GST) tag is shown in italics. The PreScission Protease recognition site (LEVLFQGP) is underlined. The peptide bond between the Q and G residues is cleaved by PreScission Protease.
All of the following procedures were performed at 277 K. The E. coli cells were harvested by centrifugation at 5000g for 20 min and then resuspended in 50 mM Tris–HCl buffer pH 8.0 containing 200 mM NaCl, 5%(v/v) glycerol and 2 mM DTT (buffer A). The cells were disrupted by sonication and the lysate was centrifuged at 6000g for 10 min. The supernatant was loaded onto a COSMOGEL GST-Accept resin column (Nacalai Tesque) equilibrated with buffer A. After the column had been washed with 20 mM HEPES–NaOH buffer pH 7.5 containing 100 mM NaCl, 5%(v/v) glycerol and 2 mM DTT (buffer B), the GST tag was cleaved on the column by PreScission Protease (GE Healthcare) overnight and OAC was eluted with buffer B. The resultant protein thus contains three additional N-terminal residues (GPG) derived from the PreScission Protease recognition sequence. The protein solution was diluted tenfold with 20 mM HEPES–NaOH buffer pH 7.5 containing 2 mM DTT (buffer C) and was then applied onto a Resource Q column (GE Healthcare). The column was washed with buffer C containing 10 mM NaCl and the protein was subsequently eluted at 50 mM NaCl using a linear gradient of 10–200 mM NaCl. The protein was further purified by size-exclusion chromatography on a HiLoad 16/60 Superdex 200 prep-grade column (GE Healthcare) and was concentrated to 17 mg ml−1 in 20 mM HEPES–NaOH buffer pH 7.5 containing 25 mM NaCl.
A dynamic light-scattering (DLS) analysis was performed using a DynaPro-MSXTC molecular-sizing instrument (Protein Solutions). After centrifugation through a 0.22 µm Ultrafree-MC filter (Millipore) to remove particulate material from the protein solution, the solution properties of the purified protein were monitored. Data were acquired as 50 scattering measurements at 293 K. Data from five sets of measurements were analyzed using the DYNAMICS software package (Protein Solutions) and averaged.
2.2. Crystallization
Initial crystallization conditions were found by screening with The JCSG+ Suite screening kit (Qiagen). The crystallizations were performed at 278 K using the sitting-drop vapour-diffusion method in a 96-well plate. All crystallization drops were prepared by mixing 1 µl protein solution (17 mg ml−1) with an equal volume of reservoir solution and were equilibrated against 50 µl reservoir solution. Clusters of crystals were observed 3 d later in a crystallization condition consisting of 100 mM Bicine pH 8.5, 20%(w/v) PEG 6000. Further crystallization was attempted using Additive Screen HT (Hampton Research) at various pH values, together with the use of 20–30%(w/v) PEG 6000 as a precipitant. Diffraction-quality crystals were finally obtained at 278 K in 100 mM Tris–HCl pH 8.8, 25%(w/v) PEG 6000, 100 mM sodium malonate using the sitting-drop vapour-diffusion method (Table 2 ▸).
Table 2. Crystallization.
| Method | Sitting-drop vapour-diffusion method |
| Plate type | 96-well CrystalQuick, 288 square wells, flat bottom (Greiner Bio-One) |
| Temperature (K) | 278 |
| Protein concentration (mg ml−1) | 17 |
| Buffer composition of protein solution | 20 mM HEPES–NaOH buffer pH 7.5, 25 mM NaCl |
| Composition of reservoir solution | 100 mM Tris–HCl pH 8.8, 25%(w/v) PEG 6000, 100 mM sodium malonate |
| Volume and ratio of drop (µl) | 1:1 |
| Volume of reservoir (µl) | 50 |
2.3. Data collection and processing
Single crystals were transferred into a crystallization solution containing 10%(v/v) glycerol as a cryoprotectant, picked up in a nylon loop and then flash-cooled at 100 K in a nitrogen-gas stream. X-ray diffraction data sets were collected on beamline NW-12A at the Photon Factory (PF; wavelength 1.0000 Å) using an ADSC Q210r detector, with a distance of 117.1 mm between the crystal and the detector. A total of 360 frames were recorded with a 0.5° oscillation angle and 1 s exposure time. The data were indexed, integrated and scaled with the XDS package (Kabsch, 2010 ▸). The Matthews volume (V M) and the solvent content were calculated with phenix.xtriage (Adams et al., 2010 ▸).
3. Results and discussion
Recombinant OAC was overexpressed in E. coli as a fusion protein with a GST tag at the N-terminus. After cleavage of the GST tag, the purified OAC migrated as a single band with a molecular weight of 10 kDa upon 20%(w/v) SDS–PAGE, which is in agreement with the calculated molecular weight of 12.2 kDa (Fig. 2 ▸ a). In contrast, a gel-filtration experiment using size-exclusion chromatography indicated a molecular weight of 25 kDa (Fig. 2 ▸ b). In addition to the gel-filtration analysis, DLS analysis after size-exclusion chromatography revealed a monomodal distribution with a polydispersity value of 9.5% and a molecular-weight estimate of 23 kDa, which allowed us to confirm that the recombinant OAC is a homodimeric protein and also suggested that OAC is a member of the DABB protein family. The typical yield of the purified recombinant OAC was about 1.5 mg per litre of culture.
Figure 2.

Analysis of the molecular weight of OAC. (a) SDS–PAGE gel. Lane 1, molecular-weight marker; lane 2, peak fraction. Molecular-weight markers are labelled in kDa. (b) Chromatogram of size-exclusion chromatography. The peak represents OAC. The molecular weights of the marker proteins are indicated in kDa at the top of the chromatogram.
The OAC crystals appeared reproducibly in the optimized crystallization solution within a few days and grew to various sizes with approximate dimensions of up to 0.15 × 0.15 × 0.12 mm. Among them, only crystals with approximate dimensions of 0.07 × 0.07 × 0.06 mm gave good-quality diffraction up to 1.40 Å resolution (Fig. 3 ▸). The detailed data-collection statistics are summarized in Table 3 ▸. The preliminary crystallographic analysis indicated that the crystals belonged to space group P3121 or P3221, with unit-cell parameters a = b = 47.3, c = 176.0 Å. With two monomers in the asymmetric unit, the Matthews volume (V M) was calculated to be 2.5 Å3 Da−1 and the estimated solvent content was 50.7%, which is in the range normally observed for protein crystals. Structure determination by the molecular-replacement method is currently under way using Phaser (McCoy et al., 2007 ▸) and MOLREP (Vagin & Teplyakov, 2010 ▸) with the crystal structures of the plant DABB proteins AtHS1 (PDB entry 1q53; Lytle et al., 2004 ▸), At5g22580 (PDB entry 1rjj; Cornilescu et al., 2004 ▸) and SP1 (PDB entry 1si9; Dgany et al., 2004 ▸) and other bacterial homologues such as TcmI (PDB entry 1tuw; Thompson et al., 2004 ▸), ActVA-Orf6 (PDB entry 1lq9; Sciara et al., 2003 ▸) and MLMI (PDB entry 3hds; Marín et al., 2009 ▸) as search models. Simultaneously, we are also attempting to crystallize OAC complexed with its product and product analogues, together with the expression, purification and crystallization of selenomethionine-labelled OAC. These structural analyses will provide valuable insights into not only the structure–function relationship and catalytic mechanism of OAC but also the functional diversity of the DABB proteins.
Figure 3.
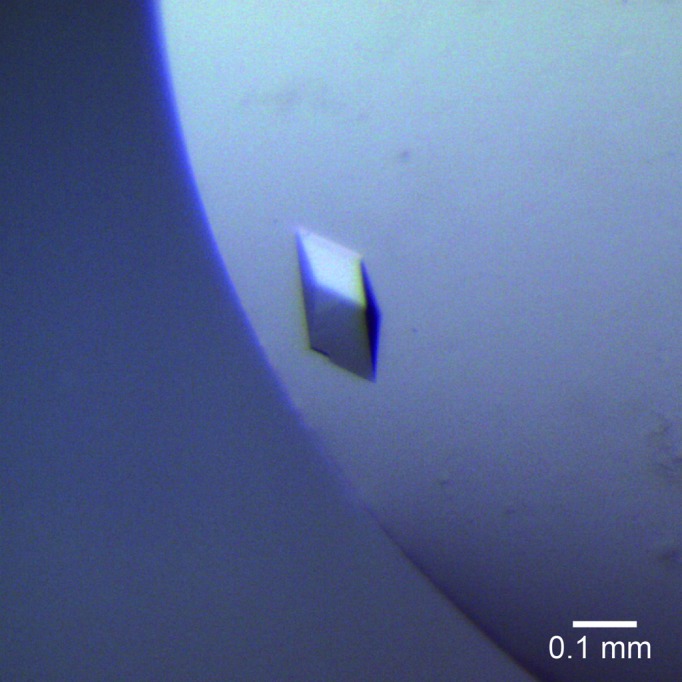
Crystals of OAC. The dimensions of the crystals were approximately 0.07 × 0.07 × 0.06 mm.
Table 3. Data collection and processing.
Values in parentheses are for the outer shell.
| Diffraction source | NW-12A, PF |
| Wavelength (Å) | 1.0000 |
| Temperature (K) | 100 |
| Detector | ADSC Q210r |
| Crystal-to-detector distance (mm) | 117.1 |
| Rotation range per image (°) | 0.5 |
| Total rotation range (°) | 180 |
| Exposure time per image (s) | 1 |
| Space group | P3121 or P3221 |
| a, b, c (Å) | 47.3, 47.3, 176.0 |
| Mosaicity (°) | 0.193 |
| Resolution range (Å) | 50.0–1.40 (1.48–1.40) |
| Total No. of reflections | 475525 (74586) |
| No. of unique reflections | 45736 (7287) |
| Completeness (%) | 98.9 (98.9) |
| Multiplicity | 10.4 (10.2) |
| 〈I/σ(I)〉 | 24.2 (12.3) |
| R merge † | 0.074 (0.155) |
| Overall B factor from Wilson plot (Å2) | 10.19 |
| No. of molecules per asymmetric unit | 2 |
| V M (Å3 Da−1) | 2.5 |
| V solv (%) | 50.7 |
R
merge = 
 , where I
i(hkl) is the intensity of the ith observation of reflection hkl,
, where I
i(hkl) is the intensity of the ith observation of reflection hkl,  is the sum over all reflections and
  is the sum over the i measurements of reflection hkl.
Acknowledgments
This work was supported in part by Grants-in-Aid for Scientific Research from the Ministry of Education, Culture, Sports, Science and Technology, Japan (to HN, IA and HM), by a grant from the Japan Foundation for Applied Enzymology (to HM) and by a grant from NAGASE Science Technology Foundation (to HM). The authors declare that they have no competing financial interests. We thank the beamline staff at the Photon Factory for their assistance with X-ray diffraction data collection.
References
- Abdel-Rahman, I. A. M., Beuerle, T., Ernst, L., Abdel-Baky, A. M., Desoky, E. E. K., Ahmed, A. S. & Beerhues, L. (2013). Phytochemistry, 88, 15–24. [DOI] [PubMed]
- Abe, I. & Morita, H. (2010). Nat. Prod. Rep. 27, 809–838. [DOI] [PubMed]
- Abe, I., Oguro, S., Utsumi, Y., Sano, Y. & Noguchi, H. (2005). J. Am. Chem. Soc. 127, 12709–12716. [DOI] [PubMed]
- Adams, P. D. et al. (2010). Acta Cryst. D66, 213–221.
- Austin, M. B. & Noel, J. P. (2003). Nat. Prod. Rep. 20, 79–110. [DOI] [PubMed]
- Bingman, C. A. et al. (2004). Proteins, 57, 218–220. [DOI] [PubMed]
- Cornilescu, G., Cornilescu, C. C., Zhao, Q., Frederick, R. O., Peterson, F. C., Thao, S. & Markley, J. L. (2004). J. Biomol. NMR, 29, 387–390. [DOI] [PubMed]
- Dgany, O., Gonzalez, A., Sofer, O., Wang, W., Zolotnitsky, G., Wolf, A., Shoham, Y., Altman, A., Wolf, S. G., Shoseyov, O. & Almog, O. (2004). J. Biol. Chem. 279, 51516–51523. [DOI] [PubMed]
- Gagne, S. J., Stout, J. M., Liu, E., Boubakir, Z., Clark, S. M. & Page, J. E. (2012). Proc. Natl Acad. Sci. USA, 109, 12811–12816. [DOI] [PMC free article] [PubMed]
- Kabsch, W. (2010). Acta Cryst. D66, 125–132. [DOI] [PMC free article] [PubMed]
- Lytle, B., Peterson, F., Kjer, K., Frederick, R., Zhao, Q., Thao, S., Bingman, C., Johnson, K., Phillips, G. Jr & Volkman, B. (2004). J. Biomol. NMR, 28, 397–400. [DOI] [PubMed]
- Marín, M., Heinz, D. W., Pieper, D. H. & Klink, B. U. (2009). J. Biol. Chem. 284, 32709–32716. [DOI] [PMC free article] [PubMed]
- McCoy, A. J., Grosse-Kunstleve, R. W., Adams, P. D., Winn, M. D., Storoni, L. C. & Read, R. J. (2007). J. Appl. Cryst. 40, 658–674. [DOI] [PMC free article] [PubMed]
- Schröder, J. (1999). Comprehensive Natural Products Chemistry, Vol. 2, edited by D. E. Cane, pp. 749–771. Oxford: Elsevier.
- Sciara, G., Kendrew, S. G., Miele, A. E., Marsh, N. G., Federici, L., Malatesta, F., Schimperna, G., Savino, C. & Vallone, B. (2003). EMBO J. 22, 205–215. [DOI] [PMC free article] [PubMed]
- Taura, F., Tanaka, S., Taguchi, C., Fukamizu, T., Tanaka, H., Shoyama, Y. & Morimoto, S. (2009). FEBS Lett. 583, 2061–2066. [DOI] [PubMed]
- Thompson, T. B., Katayama, K., Watanabe, K., Hutchinson, C. R. & Rayment, I. (2004). J. Biol. Chem. 279, 37956–37963. [DOI] [PubMed]
- Vagin, A. & Teplyakov, A. (2010). Acta Cryst. D66, 22–25. [DOI] [PubMed]