

Abstract
Direct measurements of particle–surface interactions are important for characterizing the stability and behavior of colloidal and nanoparticle suspensions. Current techniques are limited in their ability to measure pico-Newton scale interaction forces on submicrometer particles due to signal detection limits and thermal noise. Here we present a new technique for making measurements in this regime, which we refer to as nanophotonic force microscopy. Using a photonic crystal resonator, we generate a strongly localized region of exponentially decaying, near-field light that allows us to confine small particles close to a surface. From the statistical distribution of the light intensity scattered by the particle we are able to map out the potential well of the trap and directly quantify the repulsive force between the nanoparticle and the surface. As shown in this Letter, our technique is not limited by thermal noise, and therefore, we are able to resolve interaction forces smaller than 1 pN on dielectric particles as small as 100 nm in diameter.
Keywords: Force measurement, nanoparticle characterization, surface interactions, photonic crystals, optical tweezers, colloidal stability
Graphical abstract

The subtle balance of particle–particle and particle–surface force interactions that exist within nanoparticle and other colloidal suspensions plays a key role in determining long-term stability. Generally speaking these interactions encompass a complex and dynamic combination of electrostatic forces,1 van der Waals interactions,2 hydrodynamic interactions,3 particle coating,4 and steric exclusion effects.5 Stresses on stable suspensions, including changes in solution phase conditions such as ionic strength,6 pH, surfactant concentration7 and temperature, can lead to particle aggregation,8 adsorption onto surfaces,9 and flocculation. To assess the risk of a suspension becoming unstable or the effectiveness of a preventative stabilizing measure, it is desirable to measure these interactions directly in the native solution environment.
The most common technique to directly measure particle–surface interactions is atomic force microscopy (AFM). In what is known as the colloidal probe technique,10,11 a particle of known size and surface composition is physically attached to a cantilevered beam, which can then be moved close to the surface, allowing for the force to be measured at arbitrary particle-surface separation distances. Typically, the probes used are on the scale of ∼1–10 μm and the forces measured are on the order of nano-Newtons.12 Measurements made using colloidal AFM include studies on polymer bridging forces,13 repulsive van der Waals forces,14 depletion forces,15 and many others. While AFM has been used in low temperature and low pressure environments to make incredibly sensitive measurements of fundamental importance in physics and the life sciences,16 in colloidal environments the primary limitation of this technique is thermal noise. To illustrate this limitation, consider a typical V-shaped cantilever used in colloidal probe experiments with a nominal stiffness K = 0.1 N/m. The expected root-mean-square displacement (see eq 2.29 in Butt et al.17) of this cantilever due to thermal excitation at 298 K is about 0.17 nm; in other words, forces smaller than 17 pN will result in deflections smaller than the thermal motion of this device. Indeed, practical colloidal AFM measurements report force resolutions of about 10–50 pN.18
Another technique for measuring particle–surface interactions is total internal reflection microscopy19 (TIRM). First developed over 25 years ago,20 this technique has been used to measure interactions in many physical systems, as highlighted by a recent review article.21 Some notable examples include depletion interactions in polymer systems,22 specific ion effects,23 steric interactions,24 Casimir forces,25 and many others. As a statistical measurement based around the distribution of positions that a particle samples as it undergoes Brownian motion near a surface, unlike AFM, TIRM is not limited by thermal noise and is successful at measuring interactions with energies on the kBT scale and forces smaller than 1 pN. However, previous studies performed using TIRM have been limited in their focus to dielectric particles with diameters on the micrometer scale or larger. This is due to several practical limitations that occur when working with smaller particles. The traditional method for making these measurements involves balancing the repulsive force of the particle–surface interaction with the weight of the particle itself. For smaller particles the gravitational contribution to the potential well is much weaker relative to kBT so the particle does not stay near the surface. This has been addressed through the use of optical tweezers in TIRM26 that limit the lateral diffusion of small particles through the application of optical gradient forces as well influence the range of particle–surface separation heights sampled through the application of radiation pressure forces. However, the diffraction limit of light restricts minimum spot size of the optical tweezers, meaning that more power is needed to generate the necessary optical gradients to hold smaller particles, which can be damaging to sensitive samples. Another approach to addressing this limitation in TIRM has been to confine nanoparticles close enough to the illuminated surface to make a measurement by introducing a second wall. Previous researchers have used silica nanoparticles as spacers to create very thin channels. This approach has allowed for TIRM measurements on gold nanoparticles with27 and without28 protein coatings as well as multiwall carbon nanotubes29 in a confined region where the particles experience interaction potentials from both walls. As these metallic nanoparticles interact much more strongly with the evanescent field than dielectric particles of the same size, the scattered light signal is much stronger and is observable from gold particles as small as 100 nm. Generally, smaller particles scatter a much lower fraction of the available light, making scattering from these particles more difficult to discern from the background.
In this Letter we present a technique that overcomes these limitations by using a photonic crystal resonator structure to confine light into a small area. This greatly increases the optical intensity at the surface and generates an optical gradient force.30 In this near-field configuration31 the optical force acts to pull particles closer to the surface. The sharp optical intensity gradients in the evanescent field generated by a resonator allow for much smaller particles to be trapped and analyzed than the conventional free-space optical-tweezer configuration.32 Furthermore, because of the highly concentrated optical intensity on the surface, much more light is available for scattering by particles, which allows for signals from smaller particles to be detected.
Figure 1 shows a schematic illustration of the nanophotonic force microscopy (NFM) method. As Figure 1a illustrates, a nanoparticle trapped in the evanescent field above a photonic crystal resonator will undergo a confined Brownian motion, scattering more light when it is close to the surface and less when it is further away. As Figure 1b shows, the applied attractive optical gradient force balances the net particle–surface forces, resulting in an equilibrium position about which the particle undergoes Brownian fluctuations. For the case of strongly repulsive interactions (Figure 1bi) this equilibrium is farther from the surface than for weaker repulsion (Figure 1bii). Using the Boltzmann statistics, we obtain a map of the potential energy landscape that the particle interacts with from the distribution of scattered light intensities (Figure 1ci,cii). By subtracting the optical component that we have applied and taking the derivative, we obtain the force–distance curve (Figure 1ciii).
Figure 1.

Overview of the nanophotonic force microscopy setup and technique. (a) Light from a 1064 nm laser source is coupled into a photonic crystal resonator, creating a large optical intensity on the surface as well as a strong optical gradient force. As particles interact with the light in this evanescent field, they undergo Brownian motion, scattering more light when they are close to the surface. (b) The applied optical gradient force equilibrates the net effect of any surface forces. This equilibrium can be (i) farther from the surface if the interactions are strongly repulsive or (ii) closer if they are weakly repulsive. (c) (i) Measuring the scattered light intensity at many times gives us the probability distribution of intensities. (ii) Assuming that the probability of the particle occupying a given energy state follows the Boltzmann statistics, the potential energy landscape is mapped. (iii) Subtracting the optical component of the energy landscape and taking the derivative gives us the force–distance curve for the particle–surface interaction.
Figure 2 shows the procedure of the NFM data analysis technique. In this representative example measurement we are in a dilute solution of a 1:1 electrolyte (0.076 mM KCl, λD = 50 nm). Figure 2a shows the experimentally measured distribution of scattered light intensities. The particle will diffuse around equilibrium as it undergoes Brownian motion. Each position that the particle samples has an associated potential energy relative to equilibrium. As the available optical intensity exponentially decays away from the surface, each intensity state can be related to a position state using this exponential dependence. Following the procedure established in TIRM,33 we assume that the probability of finding the particle in a given intensity state follows the Boltzmann distribution and use this to derive a map of the potential energy landscape, as shown in Figure 2b.
Figure 2.

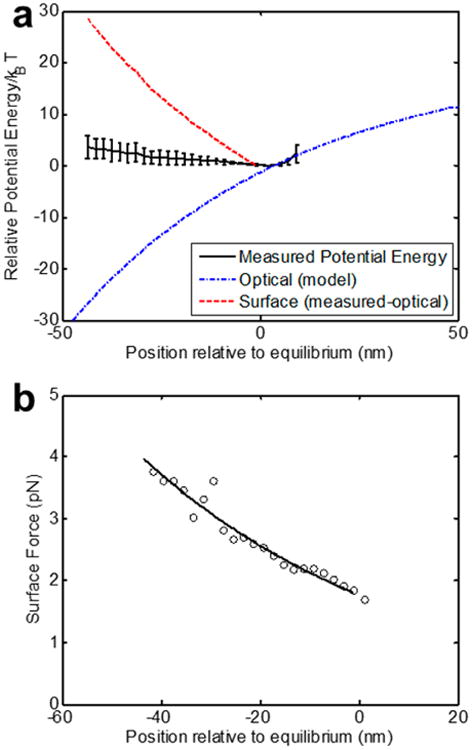
Summary and validation of the data analysis technique. Measurements performed on a 300 nm diameter polystyrene sphere in dilute KCl solution (λD = 50 nm). (a) Distribution of scattered light intensities for one representative measurement. (b) Potential energy map derived using Boltzmann statistics from experimental scattered light distributions. The solid line indicates the average of N = 5 independent measurements; error bars indicate standard deviations. (c) Subtraction of the optical component. The black solid lines indicate the experimentally measured potential energy wells (average of N = 5 data sets under constant experimental conditions; error bars indicate standard deviations). The blue dash-dot curves show the optical potential energy contribution calculated according to eq 3. The red open circles indicate the surface contribution as calculated by eq 2, while the red solid line indicates an exponentially decaying surface potential energy with 1/50 nm (1/λD) decay constant as predicted from the electrostatic model. (d) Force vs distance curve. The hollow circles represent the numerical derivative of the experimental data points on the dotted line in panel c. The solid line represents an exponentially decaying force with 1/50 nm (1/λD) decay constant.
The key difference between our technique and TIRM is that in addition to the particle–surface interaction potential energy our measurement also includes the contribution from the optical field that we have applied. This means that in order to measure the particle–surface interaction we must correct for this. Symbolically,
| (1) |
For a particle in the Rayleigh regime34 (valid when 2πnmeda ≪ λ, where a is the particle radius, nmed is the refractive index of the surrounding medium, and λ is the free-space wavelength of the incident light) Uoptical is provided by the well-known optical gradient force35 and can be computed as31
| (2) |
where Io is the surface intensity, α is the polarizibility of the particle, c is the speed of light, and d is the evanescent field penetration depth.36 For a Rayleigh particle
| (3) |
where V is the particle volume, and εp and εm are the permittivity of the particle and medium, respectively, at the optical wavelengths used. For materials with low optical absorption we assume ε ≈ n2 where n is the refractive index. Finite element simulations have confirmed that the optical force experienced by a 100 nm polystyrene sphere interacting with a photonic crystal resonator trap indeed follows this exponential decay.37 Note that in practice since the length scale of the evanescent field is often longer than the length scales associated with the surface forces, the exponential prefactor can be obtained by a fit to the data in the region where Uoptical ≫ Uparticle–surface. This means that our technique can be applied to situations where the Rayleigh point-dipole approximation is no longer valid, as long as the optical force is still proportional to the intensity gradient. This optical subtraction is shown in Figure 2c. Also, as the waveguide surface optical intensity is directly proportional to the optical power applied from the laser, the magnitude of optical component can be tuned allowing for the stable trapping of particles over a wide range of sizes.
The force exerted on the particle by the surface, Fparticle–surface, can be computed from these interaction energies by
| (4) |
where z is the spatial coordinate normal to the surface and Uparticle–surface is the particle–surface interaction potential energy. The hollow circles in Figure 2d represent this derivative applied numerically to our experimental data.
To validate our technique we seek to compare our measured force profile to a theoretical prediction. Most theoretical approaches for describing colloidal interactions come from the Derjaguin–Landau–Verway–Overbeek (DLVO) theory and its extensions.38 While the DLVO theory fails to accurately describe many complex systems,39,40 we look to simple limiting cases where we can expect the DLVO theory to make reasonable predictions. In the limit of a simple 1:1 electrolyte in a dilute solution relatively far from the surface, we expect that the van der Waals interactions should be negligible, and the electrostatic interactions can be approximated33 as
| (5) |
where εm is the DC permittivity of the medium, a is the radius, qe is the charge of an electron, and ψp and ψs are the Stern potentials of the particle and the surface, respectively, kB is the Boltzmann constant, T is the absolute temperature, and λD is the Debye screening length. This weak overlap approximation is considered valid for surface potentials less than ∼100 mV.41 In this limiting case, the surface force should decay exponentially with decay constant equal to 1/λD, the Debye screening length. This curve is shown by the solid line in Figure 2d. Note that the decay constant used in this solid line is the Debye length calculated from the known experimental parameters and not a fit to the experimental data. To test whether the magnitude of our measured force is correct, we measured the ζ-potentials (∼ψ)38 of 300 nm diameter polystyrene beads as well as the silicon nitride surfaces suspended in our experimental solution environment using laser-Doppler electrophoresis (Malvern Zetasizer Nano ZS, see also42), finding ζs = −43.8 mV and ζp = −54.2 mV. Using eq 5, this gives a pre-exponential factor of 4.3 pN. As Figure 2d shows, our measurements offer reasonable agreement with this prediction.
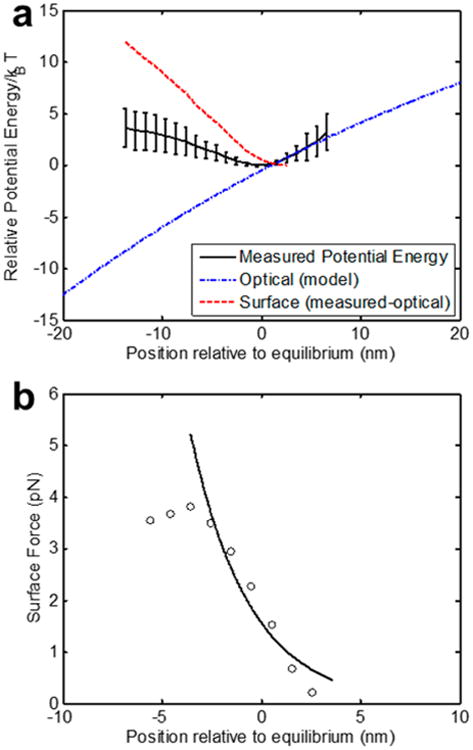
To demonstrate our ability to measure different types of surfaces, in Figures 3 and 4 we compare the interaction potentials of polystyrene beads to fused silica beads. Both of these materials have different refractive indices and have very different surface types. Both experiments shown here were performed in a buffered solution at the same pH and salt concentration. In Figures 3a and 4a, we show the potential energy landscape, highlighting our ability to perform the optical subtraction for particles of different indices. We subtract the optical component using the known refractive indices of each particle at 1064 nm (n = 1.59 and n = 1.44 for polystyrene and silica, respectively), which contribute to the polarizibility α in eq 2. Taking the derivative of the resulting surface potential energy (as in eq 4), we are able to distinguish the different force profiles for each case, as shown for polystyrene and silica in Figures 3b and 4b, respectively. In these plots, we show both the numerical derivative of the surface potential energy data points (open circles) as well as the computed analytical derivative of exponential fits of the surface potential energy. We attribute the greater measured forces for the silica beads to greater surface charge.43 As can be seen the measured interaction energies are on the order of a few kBT, while the measured forces are on the pico-Newton scale.
Figure 3.
Measurements on polystyrene spheres (300 nm diameter, refractive index n = 1.59). Experiments performed in 0.01× PBS (λD = 7.58 nm), N = 5 independent measurements. (a) Measured potential energy map showing subtraction of the optical component for polystyrene. Black line with error bars indicates the experimental measurement. The blue dash-dot curve indicates the model for the optical contribution. The red curve (shifted vertically for clarity) represents the surface component following subtraction. (b) Force curves for polystyrene. Solid lines indicate derivatives of fitted curves to the surface contribution to the potential energy calculated using eqs 1 and 2. Hollow circles indicate numerical derivatives of the unfitted experimental data.
Figure 4.
Measurements on silica spheres (310 nm diameter, n = 1.44). Experiments performed in 0.01× PBS (λD = 7.58 nm), N = 5 independent measurements. (a) Measured potential energy map showing subtraction of the optical component for silica. Black line with error bars indicates the experimental measurement. The blue dash-dot curve indicates the model for the optical contribution. The red curve (shifted vertically for clarity) represents the surface component following subtraction. (b) Force curves for silica. Solid lines indicate derivatives of fitted curves to the surface contribution to the potential energy calculated using eqs 1 and 2. Hollow circles indicate numerical derivatives of the unfitted experimental data.
One major advantage of our technique over conventional TIRM implementations is that by using a photonic crystal resonator we are able to create a large surface light intensity and a strong optical gradient force capable of holding very small particles near the surface. This allows us to measure our particles for long enough times to acquire thousands of scattered light images, allowing us to make a good statistical measurement. This also means that more light is available to be scattered by particles, allowing for observable signals to be measured even from very small dielectric particles with low refractive index contrast from the medium that would give too dim of a signal to otherwise be measured. In Figure 5, we show our experiments with 100 nm diameter polystyrene beads in high and low salt concentrations. Here we again see the expected result of stronger electrostatic repulsive forces in the case where the salt concentration is lower and there are fewer ions to screen the surface charges. In the lower salt experiments shown in Figure 5a, we find that the force decays with an exponential decay constant of 1/7.1 nm, in good agreement with the known Debye length for this solution of 7.58 nm. As we move to higher biologically relevant salt concentrations, as shown in Figure 5b, we experimentally measure decay constants that are no longer equal to 1/λD. This can likely be at least partially explained by ion–ion correlations and other finite ion size effects as the calculated screening lengths approach the hydrated ion sizes.44 As shown in the figure, we are able to measure forces smaller than 1 pN. This force regime is inaccessible to AFM due to thermal noise limitations.
Figure 5.

Effect of changing salt concentrations. Data are for 100 nm polystyrene spheres in (a) 0.01× phosphate buffered saline (PBS) solution, λD = 7.58 nm, and (b) 0.1× PBS, λD = 2.40 nm. Solid lines indicate derivatives of fitted curves to the surface contribution to the potential energy calculated using eqs 1 and 2. Hollow circles indicate numerical derivatives of the unfitted experimental data averaged for N = 4 (a) and N = 7 (b) independent measurements at each salt concentration, respectively.
We have established the application of our technique to dielectric spheres with diameters ranging from 100 to 310 nm. In general, any particle that can be optically trapped by our devices will scatter light. Previous and concurrent studies have demonstrated the trapping of polystyrene beads as small as 22 nm, quantum dots, various proteins,32 and DNA,45 as well as scattered light measurements on influenza viruses.46 An upper bound to the magnitude of forces that can be measured is the necessity of applying a large input optical power in order to generate a large optical gradient force to balance them. While previous studies have shown that silicon nitride photonic crystal traps operating with 1064 nm light generate much less heat than conventional free space optical tweezers,32 some sensitive samples can be damaged by very high optical powers.47 One major limitation of our technique is that the throughput is low. Because it is necessary to have only one particle interacting with the resonator at a time in order to obtain accurate measurements, our experiments have used low particle concentrations, and as a result the time spent waiting between measurements is much longer than the measurement time itself. Going forward, this technique can be applied to additional surfaces through the immobilization of macromolecules on the resonator surfaces as well as the deposition of thin dielectric films. Previous work in photonic crystal biosensors has demonstrated the immobilization of proteins on photonic crystal resonator devices similar to the ones used in this work,48 and we expect that similar procedures could be used to apply NFM to study interactions between particles and adsorbed macromolecules.
In conclusion we have demonstrated a technique capable of making direct measurements of particle–surface interaction potentials and forces. Our technique excels at measuring small particles and small forces in a regime previously inaccessible using conventional TIRM implementations and colloidal-probe AFM. By engineering photonic crystal structures capable of confining and concentrating light, we are able to detect scattered light from dielectric particles with diameters as small as 100 nm. This is important since many colloidal products rely on particles in this range. In the limits of a simplified system, we recover the predictions of the DLVO theory, validating our technique. However, our technique makes no assumptions about the physical mechanisms that generate the forces we are measuring; we are able to measure arbitrary forces and combinations of forces in a complex physical system.
Methods
Optical and Fluidic Setup
The experimental setup for our nanophotonic force microscopy (NFM) system consists of photonic crystal devices integrated into a microfluidic channel. In this work we use silicon nitride devices. Light from a 1064 nm wavelength diode laser (LU1064M400, Lumics, El Segundo, CA) is coupled into a single mode optical fiber with a tapered lensed tip (Oz Optics, TSNJ-3A-1064-6/125-0.25-18-2.5-12-3). This tip is brought into contact with the chip where a tapered input waveguide is used to couple the light into the device. The light is then guided through the waveguide to the photonic crystal resonator. A microfluidic channel is integrated on top of the photonic layer and used to transport suspended particles to the resonator, where they interact with the evanescent field. Additional experiments confirming the results presented here were performed using the Optofluidics NanoTweezer system (Optofluidics Inc., Philadelphia, PA).
The operating principles of photonic crystal resonator optical traps and procedures for designing them are detailed elsewhere in the literature.37 In this work, we use the same devices as in our previous paper,46 which were designed using finite difference time domain (FDTD) simulations (Lumerical FDTD Solutions package). Briefly, a set of holes in a silicon nitride waveguide form a structure with a periodically varying refractive index. This structure forms standing waves when excited by wavelengths that satisfy its resonance condition. A defect is added by having no hole at the center of this structure. This configuration is referred to as the “microcavity” design in the previous literature.37 Here the superposition of the evanescent tails of the standing waves forms a “hot-spot” with a strong local optical intensity, which exponentially decays away from the surface, resulting in a strong optical gradient force.
The microfluidic channels are fabricated from parafilm cut using a CO2 laser (VersaLaser VLS3.50). The parafilm is bonded between the chip and a glass microscope coverslide with holes for the inlet and outlet also patterned using the CO2 laser by heating on a hot plate at 140 °C. Punched PDMS is bonded to the glass at the inlet and outlet. Tygon tubing is used to deliver fluid into the channel from a syringe pump (New Era Pump Systems, Inc. NE-1000, Farmingdale, NY).
Imaging and Analysis
The scattered light is imaged using a CCD camera (Hamamatsu ORCA-ER CCD). Imaging is accomplished using a 40× microscopy objective (Olympus LUCPlanFL N, 0.60, ∞/0-2/FN22, UIS2). To optimize the imaging, the shortest possible exposure times (10–100 μs) are used. For particles that scatter enough light to saturate the images with this exposure time, imaging was optimized with Thorlabs Premium Bandpass (FLH1064-8) and Brightline Bandpass filters (FF01-641/75-25, FF02-628/40-25), which allow 90%, 2.6%, and 0.2% transmission at 1064 nm, respectively. Images were recorded with 16-bit pixel depth. For each particle, 2000–5000 images were captured to build a statistically valid distribution. A limited region of interest was used to optimize data transfer, allowing for image acquisition at a rate of ∼59 frames per second. As a result, data acquisition from an experiment consisting of 5000 images was accomplished in less than 90 s. Once acquired, images were cropped to include only the scattered light from the particle and integrated using ImageJ.
Solution Conditions and Sample Preparation
Salt concentrations were achieved by diluting phosphate buffered saline (Gibco, 10× concentrate, P5493, pH 7.2) in filtered deionized water. The experiments in KCl were performed by preparing a solution of 0.076 mM KCl in filtered deionized water. Samples of 100 and 300 nm diameter polystyrene spheres (Bangs Laboratories PS02N and ThermoScientific Fluoromax 09-980-464) and 310 nm diameter silica spheres (Bangs Laboratories SS02N) were prepared by diluting the samples in the desired solution environment by an amount necessary to create a mean distance between particles on the order of tens of micrometers. Working at too high of a concentration increases the risk of having multiple particles interact with the resonator simultaneously, while working at low concentrations lengthens the wait time for particle interactions to occur. Experimental concentrations of ∼100–200 particles/μm3 for the 100 nm particles and ∼1–10 particles/μm3 for the 300 and 310 nm particles resulted in typical wait times in the range of 10 min to 1 h. Dilutions were typically accomplished in 2 stages, with each stage sonicated for 5–10 min to prevent particle aggregation. Clean tygon tubing was used in each experiment. In between experiments the parafilm microfluidic channels were removed, and the chips were soaked in Nanostrip (Cyantek) for 12–24 h to clean the surfaces.
Acknowledgments
The theory developed above and most of the experimental work was supported by the U.S. Department of Energy Office of Basic Science under Grant DE-SC0003935. Parts of this work were also supported by the US National Institutes of Health under grant 1R01GM106420-01. The photonic crystal resonator devices used in this work were fabricated at the Cornell NanoScale Facility, a member of the National Nanotechnology Infrastructure Network, which is supported by the US National Science Foundation (Grant ECCS-0335765). Zeta potential measurements were performed in the Nanobiotechnology Center shared research facilities at Cornell. We would also like to thank Dr. Bernardo Cordovez and Dr. Christopher Earhart from Optofluidics, Inc., for useful discussions and confirmatory experiments.
Footnotes
Notes: The authors declare the following competing financial interest(s): D.E. has an equity interest in Optofluidics, Inc., a company commercializing technologies related to this work.
References
- 1.Liang Y, Hilal N, Langston P, Starov V. Adv Colloid Interface Sci. 2007;134–135:151–166. doi: 10.1016/j.cis.2007.04.003. [DOI] [PubMed] [Google Scholar]
- 2.Parsegian VA. Van der Waals Forces: A Handbook for Biologists, Chemists, Engineers, and Physicists. Cambridge University Press; Cambridge, U.K.: 2006. [Google Scholar]
- 3.Padding J, Louis A. Phys Rev E: Stat, Nonlinear, Soft Matter Phys. 2006;74:031402. doi: 10.1103/PhysRevE.74.031402. [DOI] [PubMed] [Google Scholar]
- 4.Caruso F. Adv Mater. 2001;13:11–22. [Google Scholar]
- 5.Trizac E, Raimbault JL. Phys Rev E: Stat, Nonlinear, Soft Matter Phys. 1999;60:6530–6533. doi: 10.1103/physreve.60.6530. [DOI] [PubMed] [Google Scholar]
- 6.French RA, Jacobson AR, Kim B, Isley SL, Penn RL, Baveye PC. Environ Sci Technol. 2009;43:1354–1359. doi: 10.1021/es802628n. [DOI] [PubMed] [Google Scholar]
- 7.Guyot A. Adv Colloid Interface Sci. 2004;108–109:3–22. doi: 10.1016/j.cis.2003.10.009. [DOI] [PubMed] [Google Scholar]
- 8.Iijima M, Kamiya H. KONA Powder Part J. 2009;27:119–129. [Google Scholar]
- 9.Bee JS, Davis M, Freund E, Carpenter JF, Randolph TW. Biotechnol Bioeng. 2010;105:121–129. doi: 10.1002/bit.22525. [DOI] [PMC free article] [PubMed] [Google Scholar]
- 10.Butt HJ. Biophys J. 1991;60:1438–1444. doi: 10.1016/S0006-3495(91)82180-4. [DOI] [PMC free article] [PubMed] [Google Scholar]
- 11.Ducker WA, Senden TJ, Pashley RM. Nature. 1991;353:239–241. [Google Scholar]
- 12.Kappl M, Butt HJ. Part Part Syst Charact. 2002;19:129–143. [Google Scholar]
- 13.Thormann E, Simonsen AC, Hansen PL, Mouritsen OG. Langmuir. 2008;24:7278–7284. doi: 10.1021/la8005162. [DOI] [PubMed] [Google Scholar]
- 14.Tabor RF, Manica R, Chan DYC, Grieser F, Dagastine RR. Phys Rev Lett. 2011;106:064501. doi: 10.1103/PhysRevLett.106.064501. [DOI] [PubMed] [Google Scholar]
- 15.Milling A, Biggs S. J Colloid Interface Sci. 1995;170:604–606. [Google Scholar]
- 16.Han W, Mou J, Sheng J, Yang J, Shao Z. Biochemistry. 1995;34:8215–8220. doi: 10.1021/bi00026a001. [DOI] [PubMed] [Google Scholar]
- 17.Butt HJ, Cappella B, Kappl M. Surf Sci Rep. 2005;59:1–152. [Google Scholar]
- 18.Borkovec M, Szilagyi I, Popa I, Finessi M, Sinha P, Maroni P, Papastavrou G. Adv Colloid Interface Sci. 2012;179–182:85–98. doi: 10.1016/j.cis.2012.06.005. [DOI] [PubMed] [Google Scholar]
- 19.Prieve DC, Luo F, Lanni F. Faraday Discuss Chem Soc. 1987;83:297–307. [Google Scholar]
- 20.Alexander BM, Prieve DC. Langmuir. 1987;3:788–795. [Google Scholar]
- 21.Gong X, Wang Z, Ngai T. Chem Commun. 2014;50:6556–6570. doi: 10.1039/c4cc00624k. [DOI] [PubMed] [Google Scholar]
- 22.Wei X, Gong X, Ngai T. Langmuir. 2013;29:11038–11045. doi: 10.1021/la401671m. [DOI] [PubMed] [Google Scholar]
- 23.Fernandes GE, Bevan MA. Langmuir. 2006;23:1500–1506. doi: 10.1021/la062557j. [DOI] [PubMed] [Google Scholar]
- 24.Bevan MA, Prieve DC. Langmuir. 2000;16:9274–9281. [Google Scholar]
- 25.Hertlein C, Helden L, Gambassi A, Dietrich S, Bechinger C. Nature. 2008;451:172–175. doi: 10.1038/nature06443. [DOI] [PubMed] [Google Scholar]
- 26.Prieve DC. Adv Colloid Interface Sci. 1999;82:93–125. [Google Scholar]
- 27.Eichmann SL, Bevan MA. Langmuir. 2010;26:14409–14413. doi: 10.1021/la1027674. [DOI] [PubMed] [Google Scholar]
- 28.Eichmann SL, Anekal SG, Bevan MA. Langmuir. 2008;24:714–721. doi: 10.1021/la702571z. [DOI] [PubMed] [Google Scholar]
- 29.Eichmann SL, Smith B, Meric G, Fairbrother DH, Bevan MA. ACS Nano. 2011;5:5909–5919. doi: 10.1021/nn2017149. [DOI] [PubMed] [Google Scholar]
- 30.Ashkin A. Biophys J. 1992;61:569–582. doi: 10.1016/S0006-3495(92)81860-X. [DOI] [PMC free article] [PubMed] [Google Scholar]
- 31.Erickson D, Serey X, Chen YF, Mandal S. Lab Chip. 2011;11:995–1009. doi: 10.1039/c0lc00482k. [DOI] [PubMed] [Google Scholar]
- 32.Chen YF, Serey X, Sarkar R, Chen P, Erickson D. Nano Lett. 2012;12:1633–1637. doi: 10.1021/nl204561r. [DOI] [PMC free article] [PubMed] [Google Scholar]
- 33.Prieve DC, Frej NA. Langmuir. 1990;6:396–403. [Google Scholar]
- 34.Harada Y, Asakura T. Opt Commun. 1996;124:529–541. [Google Scholar]
- 35.Ashkin A, Dziedzic JM, Bjorkholm JE, Chu S. Opt Lett. 1986;11:288–290. doi: 10.1364/ol.11.000288. [DOI] [PubMed] [Google Scholar]
- 36.Ng LN, Luff BJ, Zervas MN, Wilkinson JSJ. Lightwave Technol. 2000;18:388. [Google Scholar]
- 37.Serey X, Mandal S, Erickson D. Nanotechnology. 2010;21:305202. doi: 10.1088/0957-4484/21/30/305202. [DOI] [PubMed] [Google Scholar]
- 38.Hotze EM, Phenrat T, Lowry GV. J Environ Qual. 2010;39:1909–1924. doi: 10.2134/jeq2009.0462. [DOI] [PubMed] [Google Scholar]
- 39.Ninham BW. Adv Colloid Interface Sci. 1999;83:1–17. [Google Scholar]
- 40.Bostrom M, Williams DRM, Ninham BW. Phys Rev Lett. 2001;87:168103. doi: 10.1103/PhysRevLett.87.168103. [DOI] [PubMed] [Google Scholar]
- 41.Sokolov I, Ong QK, Shodiev H, Chechik N, James D, Oliver M. J Colloid Interface Sci. 2006;300:475–481. doi: 10.1016/j.jcis.2006.04.023. [DOI] [PubMed] [Google Scholar]
- 42.Corbett JCW, McNeil-Watson F, Jack RO, Howarth M. Colloids Surf, A. 2012;396:169–176. [Google Scholar]
- 43.von Grunberg HH, Helden L, Leiderer P, Bechinger C. J Chem Phys. 2001;114:10094–10104. [Google Scholar]
- 44.López-García JJ, Horno J, Grosse C. Langmuir. 2011;27:13970–13974. doi: 10.1021/la2025445. [DOI] [PubMed] [Google Scholar]
- 45.Serey X, Mandal S, Chen YF, Erickson D. Phys Rev Lett. 2012;108:048102. doi: 10.1103/PhysRevLett.108.048102. [DOI] [PubMed] [Google Scholar]
- 46.Kang P, Schein P, Serey X, O'Dell D, Erickson D. Nanophotonic detection of freely interacting molecules on a single influenza virus. doi: 10.1038/srep12087. Under review. [DOI] [PMC free article] [PubMed] [Google Scholar]
- 47.Ayano S, Wakamoto Y, Yamashita S, Yasuda K. Biochem Biophys Res Commun. 2006;350:678–684. doi: 10.1016/j.bbrc.2006.09.115. [DOI] [PubMed] [Google Scholar]
- 48.Mandal S, Goddard JM, Erickson D. Lab Chip. 2009;9:2924–2932. doi: 10.1039/b907826f. [DOI] [PubMed] [Google Scholar]