

Abstract
The positive association between alcohol outlet density and assault rates is well established, but little is known about how this association differs across victim subpopulations. We use spatial point process models on police data from Flint, Michigan, to test how the link between alcohol outlet density and assault rates changes as a function of three victim characteristics: age, gender, and race. We found that, although both on-premises and package outlet densities consistently emerge as risk factors for victimization, their relative effects are markedly larger in Whites than in African Americans. No analogous age- or gender-based differences were found. These results suggest the racial effects arise more from relative differences in the atmosphere in and around alcohol outlets than differences in drinking behavior alone.
Keywords: neighborhood, alcohol, assault, spatial, victim characteristics
Violent crime continues to be a significant public health problem in the United States, with more than 1.2 million violent crimes estimated to have occurred in 2011 (Federal Bureau of Investigation, 2011), making understanding the environmental drivers of violence a research priority. Research in this area has often focused on how the neighborhood atmosphere combines to produce crime (Lipton et al., 2013; Roncek & Maier, 1991; Sherman, Gartin, & Buerger, 1989). Neighborhood atmosphere, which is often unobservable without intensive surveillance, are typically characterized through place-based features that act as proxies, such as sociodemographic characteristics (Sampson, Raudenbush, & Earls, 1997), drug market activity (Lum, 2008), street geometry (Brantingham & Brantingham, 1981), and green space (Branas et al., 2011). Alcohol outlet density is another important place-based feature that has been the focus of a wide range of research on the spatial distribution of violent crime (Gruenewald, Freisthler, Remer, LaScala, & Treno, 2006; Gruenewald, Johnson, & Treno, 2002; Gruenewald & Remer, 2006; Lipton & Gruenewald, 2002; Lipton et al., 2013; Livingston, 2008; Mair, Gruenewald, Ponicki, & Remer, 2012; Norström, 2000; Resko et al., 2010; Romley, Cohen, Ringel, & Sturm, 2007) and is the focus of this work.
Alcohol Outlets and Violence
Violence has been widely observed to occur more frequently in areas proximate to alcohol outlets, both in terms of community-level violence rates (Gruenewald et al., 2006; Gruenewald et al., 2002; Gruenewald & Remer, 2006; Lipton & Gruenewald, 2002; Livingston, 2008; Norström, 2000; Romley et al., 2007) and an individual's propensity for violent behavior (Resko et al., 2010). Researchers have offered multiple, interrelated theories that explain the observed associations, all of which may differentially affect demographic subpopulations of victims. One theory is that larger numbers of alcohol outlets indicate greater availability of alcohol, which may lead to higher overall drinking rates (Stockwell & Gruenewald, 2001). The psychotropic effect of alcohol on the human brain is disinhibition, which can be manifested through aggressive or violent behavior, particularly for those with a history of aggressive behavior (Giancola, 2002). Thus, increased alcohol outlet density may create more opportunities for alcohol-related aggression. Victim sub-populations may be differentially affected by this dynamic if their alcohol use habits and/ or their exposure levels to alcohol outlets vary.
A second theory is that high alcohol outlet density may signify other social or environmental features of the community that are associated with violence (Lipton et al., 2013). In particular, alcohol outlet density has been widely hypothesized to signify a lack of social control (Gorman, Speer, Gruenewald, & Labouvie, 2001); empirical evidence supports this hypothesis, as alcohol outlet density has been linked to community-level measures of social disorganization, including socioeconomic disadvantage and residential instability (Nielsen, Hill, French, & Hernandez, 2010). In addition, areas of high alcohol outlet density often feature relaxed levels of police surveillance (LaScala, Freisthler, & Gruenewald, 2005) and a general lack of guardianship (Gruenewald et al., 2006). This reduced level of social control inhibits a community's ability to regulate the behavior of its members (Snowden & Pridemore, 2013b) which, combined with the widely hypothesized (e.g., Snowden & Pridemore, 2013a) tendency for areas with higher alcohol outlet density to draw individuals at elevated risk for criminal activity, creates a particularly vulnerable situation. Differences across neighborhoods in the link between alcohol outlets and violence have been observed (Mair et al., 2012; Pridemore & Grubesic, 2012a, 2012b; Snowden & Pridemore, 2013b), possibly indicating that alcohol outlets act differentially as markers under different circumstances. If there is notable demographic segregation in the areas of town frequented, these neighborhood differences may translate to differential risks at the individual level.
Our study is motivated largely by a third possible explanation for the link between alcohol outlets and violence: niche theory (Gruenewald, 2007). Niche theory suggests that greater alcohol outlet density provides consumers with more choices for drinking environments, which in turn, results in the formation of drinking subpopulations at certain alcohol outlets/parts of town (Gruenewald, 2007). This process, also known as assortative drinking, is reflected by the fact that different alcohol outlets cater to different populations (Gruenewald, 2007) and/or make different management choices (Madensen & Eck, 2008). These drinking niches correspond to different types of alcohol outlets, and the differences in the atmosphere, both in and nearby the outlet, may be reflected in their violence-producing potential (Gruenewald, 2007). This increased between-outlet variability explains how greater segmentation of the drinking population may facilitate the formation of drinking niches with particularly high violence-producing potential (Gruenewald, 2007). This theory partially explains not only why high alcohol outlet density tends to correspond to higher violence rates but also why a certain kind of heterogeneity—both in terms of the violence-producing potential of an outlet and the population this potential is likely to affect—in the relationship between alcohol outlets and violence rates is likely to exist. In particular, if drinking niches are divided along demographic lines, then this may indicate that victim subpopulations are differentially exposed to the “more violent” alcohol outlets.
Study Overview
Understanding the precise dynamics of the aforementioned theories, how their impacts differ across victim subpopulations, and their implications for the production of violence would require a costly ethnographic study; considering how individual-level characteristics of the victims relate to the level of risk of assault conferred by alcohol outlet density, however, will provide an important first look into these dynamics. If particular subsets of the population systematically experience differential risks of assault in relation to alcohol outlet density, it may imply a difference in those subpopulations’ use of alcohol, the types of alcohol outlets they frequent, and/or the role alcohol outlets play in the violent crime dynamics of their communities. A racial component to the segmentation of the drinking population appears plausible which, if true, would indicate differential exposure to outlets with greater violence-producing potential. Accordingly, we hypothesize racial differences in the risk conferred by alcohol outlets. Documented differences in drinking habits by race (Chartier & Caetano, 2010; Dawson, 1998; Jones-Webb, Snowden, Herd, Short, & Hannan, 1997; Sempos, Rehm, Wu, Crespo, & Trevisan, 2003) may also contribute to these differential risks. Analogously divergent drinking habits in men versus women (Holmila & Raitasalo, 2005) and probable differences in exposure to alcohol outlets in juveniles versus adults because of age-restrictions and curfews suggest possible age- and gender-based disparity in the risk of violence conferred by alcohol outlets. However, because of the notable racial segmentation in housing present in Flint, Michigan (U.S. Census, 2010), we expect relatively less (in comparison to race) age- and gender-based segregation in the types of alcohol outlets individuals are exposed to, thus we expect the corresponding differences in relative risks associated with alcohol outlets to be smaller.
In this study, we attempt to test the given hypotheses by quantifying the heterogeneous effects of alcohol outlet density on assault rates. We analyze data composed of the locations of all assaults reported to Flint, Michigan, police department in 2010, in addition to the age, gender, and racial characteristics of each victim. We combine these data with locations of all on-premises and package alcohol outlets in Flint, Michigan, and 2010 U.S. Census demographic data and employ a point-level spatial modeling framework to examine how alcohol outlet density—both in terms of on-premises and package outlet density—differentially affects subsets of the victim population. Recent work has explored heterogeneity in the association between alcohol outlet density and assault rate, showing that the strength of this association is modulated by neighborhood characteristics (Mair et al., 2012), community organization (Pridemore & Grubesic, 2012a), and land use (Pridemore & Grubesic, 2012b). The strength of the association also varies across different categories of violent crime (Toomey et al., 2012) and by alcohol outlet type (Lipton et al., 2013). Yet, the extent to which victim subpopulations are differentially affected by alcohol outlet density remains unstudied. As a second innovation, the analytic approach here treats space continuously and thus does not rely on the use of discrete spatial units (e.g., census tracts), demonstrating an approach to studying spatial dynamics when practical considerations (e.g., a relatively small area) prohibit the use of census-based spatial units.
Methods
Police Data
The dependent variable in this analysis is the assault rate. We treat assault locations at the point level instead of using aggregated areal units (e.g., census tracts) because of the relatively small size of Flint (e.g., there are only 41 census tracts). Crime data from 2010 was provided by the Flint Police Department and included addresses for every crime incident reported to the police. In addition to crime locations, the gender, race, and age of each victim (when applicable) is recorded, which will be used to identify victim sub-populations. The characteristics of the offenders are not available in these data. Addresses were geocoded and converted to Universal Transverse Mercator (UTM) for spatial referencing. Assaults were characterized by the National Incident Based Reporting System category (Federal Bureau of Investigation, 2010) used by the police and those recorded as “assault offenses” were included in the analysis. In cases where there were multiple victims associated with a single incident, that incident is counted once for each victim. Because more than 99% of racial categories recorded by the police were either African American or White, only victims reporting one of these two races were included in the analysis. Victim age was categorized into juvenile (younger than 18 years old) and adult. In geocoding crime locations, there was an error rate of less than 1%; those cases were omitted from the analysis.
Alcohol Outlet Data
The primary explanatory variable in this analysis is alcohol outlet density. Alcohol outlet data was acquired from the Michigan Liquor Control Commission in 2012, which provided the alcohol license types and addresses for all alcohol outlets in Genesee County. All addresses were successfully geocoded and converted to UTM coordinates. Using the alcohol license information, each alcohol outlet was categorized as either an establishment that permits drinking on the premises (on-premises) or one that only sells packaged alcohol. Businesses that sell both packaged alcohol and serve alcohol on the premises were classified as on-premises. A Gaussian kernel density estimate is used to continuously represent density for each type of alcohol outlet across the space. Prior to computing the density, the UTM coordinates were scaled so that distances between points are in miles. On this scale, the standard deviation of the smoothing kernel is 0.6, which was chosen to visually match the layout of alcohol outlets shown in Figure 1.
Figure 1.
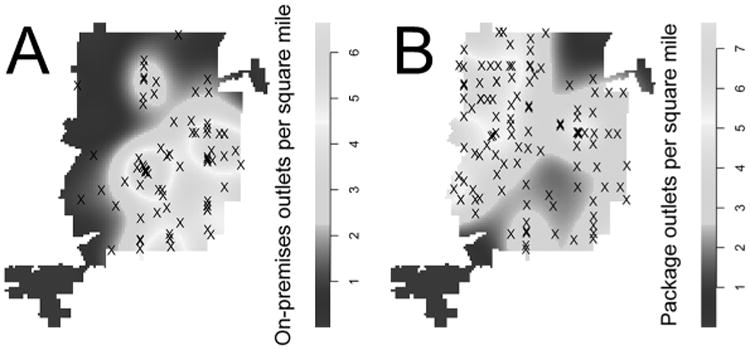
Panels A and B show on-premises and package alcohol outlet densities, respectively, with Xs referring to exact alcohol outlet locations.
Community-Level Demographic Data
Community-level demographics were obtained from the 2010 census. To achieve an appropriate resolution for the community demographics, census block group was chosen as the unit of measurement. Relevant demographic variables were chosen based on those noted as correlates of violence by Sampson et al. (1997). We included all that were available at the block group level in the 2010 census: % African American, % vacant housing, % female-headed households, and % younger than 18 years old. Because these variables are only available in discrete spatial units (e.g., census units), and crime locations are observed at the point level, the demographic variables are smoothed across block groups using the predicted values from a generalized additive model (Wood, 2006), with the demographic variables being nonparametrically estimated as a function of the spatial coordinates using thin-plate splines. Specifically, we reference each of the 125 census block groups in the city by the location of their centroid and fit the demographic variables (one at a time) as a nonparametric function of those spatial coordinates, effectively transforming the discretely observed demographic variables into a smoothed, continuous surface. From this fitted model, we can calculate this smoothed surface at any point in the city, making its representation analogous to the continuous nature of the crime rates, which are the target of our estimation and inference. This data processing was done for practical reasons and did not change the qualitative demographic layout of the city. The only exception here was population size; some areas in Flint have little or no population, leading to empty spaces of crime, which may be concealed by smoothing. Population size at a particular point was therefore defined as the population size of block group whose centroid is nearest.
Statistical Modeling
We model the assault rate using a marked Poisson point process (Diggle, 2003) with intensity function, λ(s), which is interpreted as the assault density at the point, s. The integral of the intensity function of an area gives the expected number of crimes within that region. Under our model, the intensity function depends on (a) X(s), the vector of community demographic variables corresponding to location s; (b) A1(s) the on-premises alcohol outlet density at location s; and (c) A2(s), the package alcohol outlet density at location s. Different intensity functions are fit for different victim subpopulations to assess differential effects of alcohol outlet densities as predictors. Specifically, we model the intensity function within subpopulation k, λk(s), as
| (1) |
where the regression coefficients, θk, ϑk, βk, are estimated by the model. The last term, fk(s), is a parametrically estimated function of the spatial coordinates used to absorb any residual spatial trend. This is done to eliminate any unmodeled spatial dependence in the data, analogously to removing spatial trend from the residuals in an ordinary regression model, which is required for proper statistical inference; for this purpose, a quartic polynomial in the spatial coordinates worked well. As in Poisson regression, the exponentiated regression coefficients are interpreted as rate ratios: multiplicative changes in the crime rate associated with a one-unit increase in the predictor value, at fixed values of the other covariates. These models are fit using the spatstat package (Baddeley & Turner, 2005) Version 1.31-1 from the R statistical computing environment, Version 2.15.3.
Our substantive hypotheses are formulated as statistical hypotheses by testing whether particular regression coefficients vary across subpopulations. For example, to test whether on-premises outlets have differential effects for males versus females, we fit model (1) under the constraint that θmale = θfemale and compare this with the unconstrained model. These models are nested and fit by maximum likelihood, so twice the difference in the maximized log-likelihoods is approximately distributed (Casella & Berger, 2002), which is used for inference. This inference process is conducted separately for each stratifying variable (gender, age, race)—primarily for practical reasons, because multidimensional marks present a computational burden. Because African Americans appear to be overrepresented in the juvenile group (see “Descriptive Statistics” section), we also compared races within the juvenile and adult groups. The effect of each alcohol outlet type is tested separately, with the effect of the other type allowed to vary freely across the subpopulations. The vector of community demographic variables, X(s), is included in all models to guard against confounding in assessing the effects of the alcohol outlet densities but is not of substantive interest in this work and so is not reported.
To assess goodness of fit, we compare kernel densities of the observed point processes in each subpopulation with the fitted intensity function, graphically and numerically. To obtain a numerical measure of fit analogous to R2, we must numerically compare the observed densities with the predicted densities, which requires discretizing space. For this purpose, we divide the study region using a 128 × 128 pixelated grid and compute the observed density and the predicted density within each pixel. We then calculate the squared correlation coefficient between these two values, forming a kind of pseudo-R2. The “observed” densities are calculated using a Gaussian kernel with bandwidth chosen to empirically match the observed point process and are the same densities shown in Figure 2.
Figure 2.
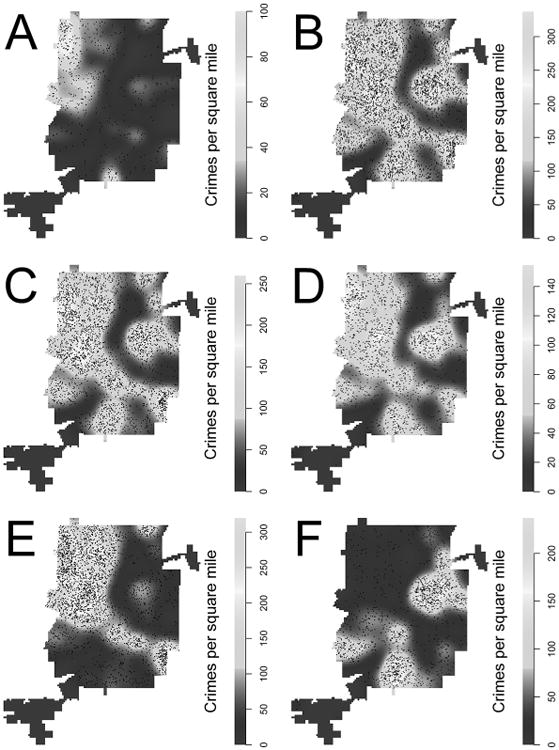
Assault victimization densities for juvenile victims (Panel A), adult victims (Panel B), female victims (Panel C), male victims (Panel D), African American victims (Panel E), and White victims (Panel F). Points are crime locations, slightly displaced to prevent overlap.
Results
Descriptive Statistics
Our database included 4,384 assault victimizations in Flint, Michigan, in 2010. Most victims of assault were female (64.3%), African American (65.9%), and adult (88.6%). Each of these trends was consistent within each subpopulation, although African Americans were overrepresented in the juvenile group; 81.2% of juvenile victims were African American, whereas only 64.0% of adult victims were. The complete breakdown of assault crime counts for each combination of victim characteristics is shown in Table 1.
Table 1. Summary of Assault Victimization Counts in Flint, Michigan, in 2010, Stratified by Victim Characteristics.
| Female | Male | Total | |||||||
|---|---|---|---|---|---|---|---|---|---|
|
|
|
|
|||||||
| Juvenile | Adult | Total | Juvenile | Adult | Total | Juvenile | Adult | Total | |
| African American | 216 | 1,718 | 1,934 | 191 | 766 | 957 | 407 | 2,484 | 2,891 |
| White | 34 | 853 | 887 | 60 | 546 | 606 | 94 | 1,399 | 1,493 |
| Total | 250 | 2,571 | 2,821 | 251 | 1,312 | 1,563 | 501 | 3,883 | 4,384 |
The spatial distribution of assaults within each victim subpopulation is shown in Figure 2. Notable features include an area of increased density in the northwestern corner of the city that appears in all victim subgroups except for Whites (Figure 2, Panel F). With the exception of juvenile victims (Figure 2, Panel A), this area of increased density includes a ridge that tracks southeast to connect with a second area of increased density in the southeastern area of the city. This pattern largely coincides with areas of larger African American population and female-headed households. There are two additional areas of increased crime density—in the central eastern and in the central southern part of the city—which are most pronounced in the White victim population (Figure 2, Panel F); these areas are the predominantly White neighborhoods in the city. Some overlap between these crime density patterns and alcohol outlet densities (Figure 1) is visually apparent.
Crime Density Modeling
Overall, the intensity functions estimated by the model in each victim subpopulation were in reasonable agreement with the observed intensities, with pseudo-R2 values ranging from .71 to .86 (Table 2), alleviating any major concerns about misspecification of the mean structure. Qualitatively, the observed and fitted densities match closely, in agreement with the pseudo-R2 values, although there is some evidence of overestimation in the east central assault hot spot. Potential reasons for this overestimation are explored in the discussion, but the highly localized nature of the overestimation minimizes concerns about model specification.
Table 2. Summary of Spatial Modeling of Assault Crimes in Flint, Michigan, 2010.
| Gender | Crimes/Mile2 | On-Premises Outlets | Package Outlets | R2 |
|---|---|---|---|---|
| Female | 82.79 | 1.31(1.21–1.40) | 1.63(1.52–1.75) | .75 |
| Male | 45.87 | 1.23(1.12–1.35) | 1.64(1.50–1.79) | .71 |
| χ2 = 0.89 | χ2 = 0.01 | |||
| Age | ||||
| Juvenile | 14.70 | 1.17(0.97–1.42) | 1.46(1.24–1.72) | .80 |
| Adult | 113.96 | 1.32(1.24–1.40) | 1.65(1.56–1.75) | .71 |
| χ2 = 1.27 | χ2 = 1.87 | |||
| Race | ||||
| African American | 84.84 | 1.19(1.10–1.29) | 1.46(1.36–1.57) | .86 |
| White | 43.82 | 1.41(1.28–1.56) | 1.77(1.58–1.99) | .78 |
| χ2 = 6.86** | χ2 = 7.55** | |||
| Race(Juvenile) | ||||
| African American | 11.94 | 1.19(0.94–1.51) | 1.31(1.08–1.59) | .84 |
| White | 2.76 | 1.15(0.71–1.86) | 1.74(1.00–3.05) | .76 |
| χ2 = 0.02 | χ2 = 0.89 | |||
| Race(Adult) | ||||
| African American | 72.90 | 1.18(1.08–1.29) | 1.51(1.39–1.63) | .86 |
| White | 41.06 | 1.42(1.28–1.57) | 1.78(1.58–2.01) | .78 |
| χ2 = 7.08** | χ2 = 5.09* |
Note. Each of the five sections corresponds to comparisons between the corresponding subpopulations on the relative effect of alcohol outlet density on assault victimization rates, controlling for all other demographic variables. The “On-Premises Outlets” column displays the estimated assault rate ratio associated with a one-unit increase in on-premises outlet density, with 95% confidence intervals (e.g., a one-unit increase in on-premises outlet density corresponds to 31% higher rates of victimization among females). The χ2 statistics correspond to tests for the difference between the two associated rate ratios (e.g., χ2 = 0.89 corresponds to a test of the difference between the female and male rate ratios, which are estimated as 1.31 and 1.23, respectively). The “Package Outlets” column displays the analogous information regarding package outlets. The first column displays the overall average crimes per square mile in each victim subpopulation and is there to contextualize the relative rates of increase. The final column displays the pseudo-R2 value for the model fit within the corresponding sub-population (e.g., the model fit for female assault density corresponds to pseudo-R2 = .75). The pseudo-R2 values correspond to the model where all demographic and alcohol outlet variables are included.
p < .01.
p <.05.
The effect estimates of both on-premises and package alcohol outlet density on crime rates within each victim demographic, controlling for area demographic variables, are shown in Table 2. Both types of alcohol outlets correspond to greater assault rates across all subsets of the population studied, with one exception: Juveniles incur a nonsignificant increase in risk associated with on-premises alcohol outlet density. This null finding may be a result of the relatively small sample size corresponding to juvenile victimization. Package alcohol outlets were found to confer greater relative risk than on-premises alcohol outlets, with the effect estimates being larger for package alcohol outlets in all strata. For both alcohol outlet types, we found no significant differences between males and females or between juveniles and adults in terms of the effect on assault victimization rates. Regarding on-premises alcohol outlets, a one-unit increase in density resulted in a significantly larger percentage increase in the victimization rate for Whites (41%) than for African Americans (19%) at fixed values of the other covariates. Putting these effects in perspective is aided by referring back to Figure 1. For example, the highest density areas correspond to a density of about 6 on-premises outlets/mile2; comparing this to a lower density area with 4 on-premises outlets/mile2, the model estimates 99% (1.412 ≈ 1.99) and 39% (1.192 ≈ 1.39) higher rates of victimization in Whites and African Americans, respectively. This effect was only present in the adult population, as the effect of a one-unit increase in on-premises alcohol outlet density on juvenile victimization rate in Whites (a 15% increase) was very similar to the corresponding rate for African Americans (a 19% increase). We found a similar pattern regarding package alcohol outlets; the increase in victimization rate corresponding to a one-unit increase in density was significantly higher for Whites (77%) than for African Americans (46%).
Discussion
The prevailing approaches to studying the relationship between alcohol outlets and assaults have focused on the total population. Our results, however, suggest that such approaches are effectively averaging over heterogeneous groups and potentially missing important differences in the relationship between alcohol outlet density and rates of assault victimization. Specifically, we found that alcohol outlet density confers a greater relative increase in the rate of assault victimization among Whites than among African Americans, and this signal appeared for both on-premises and package alcohol outlets. These differences point to variation in the role of alcohol use habits and/or alcohol outlets in the etiology of violence among these subsets. As elaborated in the following text, we propose that differences in the atmosphere in and around (i.e., how alcohol outlets act as markers) alcohol outlets—rather than differences in drinking habits alone—explain our results. Our results suggest that efforts to more thoroughly clarify heterogeneities using more ethnographic methods (e.g., intensive surveillance of selected alcohol outlets to identify which have a more violent culture associated with them) would be a useful next step for understanding why contexts around alcohol outlets may produce different violent outcomes. As a secondary contribution, our work has also demonstrated an approach to analyzing spatial drivers of violence that treats space continuously, which proves useful when the study region is relatively small, prohibiting the use of predetermined discrete spatial units (e.g., census tracts) or when a given phenomenon is more naturally envisioned in continuous space.
Our results give evidence against differences in drinking habits being the primary explanation for the differential risks incurred by Whites and African Americans. Researchers have found, for example, that African Americans, in addition to having higher rates of non-social drinking than Whites (Jones-Webb et al., 1997), tend to have lower overall drinking rates than Whites (Chartier & Caetano, 2010; Dawson, 1998; Sempos et al., 2003). This suggests African Americans may be less likely to frequent alcohol outlets than Whites. Similarly, some researchers have found that African Americans have lower rates of binge drinking (Chartier & Caetano, 2010), suggesting a decreased propensity for involvement in altercations resulting from the disinhibitory psychotropic effects of alcohol. The fact that the racial differences were primarily driven by the differences among adults is consistent with this explanation, as the increased availability of alcohol is likely to be more salient for those of sufficient age to purchase alcohol. Yet, analogous differences in drinking behavior by gender (Holmila & Raitasalo, 2005; Nolen-Hoeksema, 2004) are accompanied by nearly identical relative increases in the risk of assault associated with alcohol outlet density, giving evidence against this dynamic's importance in our study region. Similarly, the decreased presence of juveniles around alcohol outlets only results in a small—and nonsignificant—reduction in the relative increase in the victimization rate associated with alcohol outlet density.
For an alternative explanation, we refer back to niche theory, which hypothesizes that the positive relationship between alcohol outlet density and violent crime rates is that increased alcohol outlet density leads to parceling of the drinking population, making it more likely for niches of problem drinking, and subsequent violence, to arise (Gruenewald, 2007). This idea implies that the atmosphere around some alcohol outlets is more violent than others, and if these drinking niches have any racial component, then this provides a potential explanation. In particular, our results indicate that Whites in our sample were more likely to be affected by these problematic alcohol outlets than African Americans, making proximity to bars a greater risk factor in terms of their relative impact on the victimization rate. In other words, it is not necessarily differences in frequency of exposure to alcohol outlets that explain the racial effects but differences in the atmosphere of the alcohol outlets to which individuals are exposed. Clearly, some threshold of exposure is required for these differences in atmosphere to be relevant, as can be seen by the fact that we found no evidence of racial differences in the relative effect of alcohol outlets on victimization rates among juveniles, who are presumably less likely to be found in and around alcohol outlets. Determining the veracity of this explanation would require more intensive ethnographic investigation; our results suggest this would be worthwhile.
More generally, these results may signal an overall difference in the role that alcohol outlets play in the etiology of assault victimization in African Americans when compared to Whites. From Table 2, we can see that the overall number of victimization incidents among African Americans is nearly 94% higher than the corresponding rate for Whites. This, combined with the increased relative effect of alcohol outlets among Whites, indicates that African Americans are victimized in areas of low alcohol outlet density far more often than Whites. Therefore, alcohol outlets act less as localized foci of violence in the African American population, indicating a difference in the etiological process underlying assault victimization in these two subpopulations. Prior researchers have suggested that the increased risk of violence associated with alcohol outlets partially arises from the fact that they tend to coexist with traits associated with violence (Lipton et al., 2013), making alcohol outlets effectively “markers” for other violence producing place-based features. These results suggest a differential in how alcohol outlets act as markers in areas where African Americans are victimized as opposed to where Whites are victimized.
Limitations
Our research, however, is not without limitations. First, our research focuses on Flint, Michigan, and our results may not be generalizable to other cities and populations. Nonetheless, Flint is consistently among the U.S. leaders in per capita crime, making the study of crime in this setting a priority. Ideally, these hypotheses would be tested in other areas where police provide victim demographics in their crime reports. Either consistency, or variability, in these effects across cities would be of interest. Second, different types of alcohol outlets confer different levels and types of risks (Lipton et al., 2013), and these data only allow us to distinguish between on-premises and package alcohol outlets. Further stratification, such as distinguishing between a bar and a restaurant, or between a liquor store and a supermarket, could uncover further important heterogeneity we could not measure. For example, if the on-premises alcohol outlet hot spot on the east central section of the city and the one in the south central section of the city (which both coincide with White victimization hot spots) both reflected two different types of outlets (e.g., one spot is all restaurants and one is all bars), then this could explain the previously mentioned overestimation. Similarly, demographic factors beyond those available here, such as poverty, unemployment, and college graduation rates, would provide a clearer contextual picture. Third, the proportion of crimes reported is known to depend on demographic characteristics of the victims (Levitt, 1998) and—as with any data of this type—there is no way to account for this with the data used. Therefore, this should be considered when interpreting the results, as they may be reflective of some combination of differences in reporting rates and victimization rates. Fourth, our analysis did not include more serious violent crimes (e.g., homicide and sexual assault) because (a) there were far too few nonassault incidents to execute an analogous analysis for each crime time and (b) differences in their etiology and susceptible populations contraindicate combining them with assaults in a single analysis. However, as assaults are often precursors to more serious crimes, the results here likely carry implications about the etiology of violence generally, beyond only assaults.
Finally, it is likely that some assumptions of the statistical modeling framework were not strictly met in these data. In particular, under the model used here, it is assumed that the number of points of type k falling into a region, R denoted by Nk(R), follows a Poisson distribution with parameter μ = ∫Rλk(s) ds and conditional on Nk(R), the locations of those points in R are independent of each other. Furthermore, we assume the point processes corresponding to the distinct subpopulations are independent of each other, conditional on the covariates in the model. Despite potential departure from these assumptions in this setting for reasons such as crime locations being confined to street networks and the existence of empirical evidence for clustering of certain kinds of crime (Mohler, Short, Brantingham, Schoenberg, & Tita, 2011), the marked Poisson process can serve as a flexible and effective approximation to very complex data-generating models (Taddy, 2010) and, as we have shown here, does fit our data reasonably well. Related to this, the Poisson assumption of the model is an alternative explanation of the overestimation: Under this model, the number of crimes in any region has variance proportional to its mean, which is maximized in these areas. Therefore, it is plausible that this overestimation is the result of locally high variation in the model-based predictions. These shortcomings point to the need for the development, and widely available implementation, of more general continuous space models for this type of data.
Conclusions
Despite these limitations, our analysis provides evidence that alcohol outlet density cannot be properly conceived of as a static risk factor for assault victimization, as it is often treated. The large racial differences in the relationship between outlet density, both on-premises and package stores, and assault victimization rates indicate differences between these two subpopulations in terms of the role of alcohol outlets in the etiology of assault victimization. The lack of analogous findings by age and gender possibly suggests the racial effects can be explained by differences in the atmosphere of alcohol outlets to which they are exposed and/or the place-based features that alcohol outlets act as markers for rather than differences in drinking habits or frequency of exposure to alcohol outlets. This research provides further motivation for investigations of this dynamic relationship through further data analysis and perhaps more in-depth ethnographic studies of alcohol outlets and assault victimization.
Acknowledgments
NIDA R01 DA007484-14 (PI: Zimmerman). September 30, 2007 to August 31, 2014.
References
- Baddeley A, Turner R. Spatstat: An R package for analyzing spatial point patterns. Journal of Statistical Software. 2005;12:1–42. [Google Scholar]
- Branas CC, Cheney RA, MacDonald JM, Tam VW, Jackson TD, Ten Have TR. A difference-in-differences analysis of health, safety, and greening vacant urban space. American Journal of Epidemiology. 2011;174(111):1296–1306. doi: 10.1093/aje/kwr273. [DOI] [PMC free article] [PubMed] [Google Scholar]
- Brantingham PJ, Brantingham PL. Notes on the geometry of crime. In: Brantingham PJ, Brantingham PL, editors. Environmental criminology. Beverly Hills, CA: Sage; 1981. pp. 27–54. [Google Scholar]
- Casella G, Berger RL. Statistical inference. 2nd. Pacific Grove, CA: Duxbury Press; 2002. [Google Scholar]
- Chartier K, Caetano R. Ethnicity and health disparities in alcohol research. Alcohol Research & Health. 2010;33(1-2):152–160. [PMC free article] [PubMed] [Google Scholar]
- Dawson DA. Beyond black, white and Hispanic: Race, ethnic origin and drinking patterns in the United States. Journal of Substance Abuse. 1998;10(4):321–339. doi: 10.1016/s0899-3289(99)00009-7. [DOI] [PubMed] [Google Scholar]
- Diggle PJ. Statistical analysis of spatial point patterns. 2nd. London, United Kingdom: Hodder Education; 2003. [Google Scholar]
- Federal Bureau of Investigation. National Incident Based Reporting System (NIBRS) categories. 2010 Retrieved from http://www.fbi.gov/about-us/cjis/ucr/nibrs/nibrscategories.pdf.
- Federal Bureau of Investigation. Crime in the United States 2011: Uniform Crime Report 2011. 2011 Retrieved from http://www.fbi.gov/about-us/cjis/ucr/crime-in-the-u.s/2011/crime-in-the-u.s.-2011/violent-crime/violent-crime.
- Giancola PR. The influence of trait anger on the alcohol-aggression relation in men and women. Alcoholism. 2002;26(9):1350–1358. doi: 10.1097/01.ALC.0000030842.77279.C4. [DOI] [PubMed] [Google Scholar]
- Gorman DM, Speer PW, Gruenewald PJ, Labouvie EW. Spatial dynamics of alcohol availability, neighborhood structure and violent crime. Journal of Studies on Alcohol. 2001;62(5):628–636. doi: 10.15288/jsa.2001.62.628. [DOI] [PubMed] [Google Scholar]
- Gruenewald PJ. The spatial ecology of alcohol problems: Niche theory and assortative drinking. Addiction. 2007;102(6):870–878. doi: 10.1111/j.1360-0443.2007.01856.x. [DOI] [PubMed] [Google Scholar]
- Gruenewald PJ, Freisthler B, Remer L, LaScala EA, Treno A. Ecological models of alcohol outlets and violent assaults: Crime potentials and geospatial analysis. Addiction. 2006;101(5):666–677. doi: 10.1111/j.1360-0443.2006.01405.x. [DOI] [PubMed] [Google Scholar]
- Gruenewald PJ, Johnson FW, Treno AJ. Outlets, drinking and driving: A multilevel analysis of availability. Journal of Studies on Alcohol. 2002;63(4):460–468. doi: 10.15288/jsa.2002.63.460. [DOI] [PubMed] [Google Scholar]
- Gruenewald PJ, Remer L. Changes in outlet densities affect violence rates. Alcoholism: Clinical and Experimental Research. 2006;30(7):1184–1193. doi: 10.1111/j.1530-0277.2006.00141.x. [DOI] [PubMed] [Google Scholar]
- Holmila M, Raitasalo K. Gender differences in drinking: why do they still exist? Addiction. 2005;100(12):1763–1769. doi: 10.1111/j.1360-0443.2005.01249.x. [DOI] [PubMed] [Google Scholar]
- Jones-Webb R, Snowden L, Herd D, Short B, Hannan P. Alcohol-related problems among black, Hispanic and white men: The contribution of neighborhood poverty. Journal of Studies on Alcohol and Drugs. 1997;58:539–545. doi: 10.15288/jsa.1997.58.539. [DOI] [PubMed] [Google Scholar]
- LaScala E, Freisthler B, Gruenewald P. Population ecologies of drug use, drinking and related problems. In: Stockwell T, Gruenewald P, Toumbourou J, Loxley W, editors. Preventing harmful substance use: The evidence base for policy and practice. New York, NY: Wiley; 2005. pp. 67–78. [Google Scholar]
- Levitt SD. The relationship between crime reporting and police: Implications for the use of Uniform Crime Reports. Journal of Quantitative Criminology. 1998;14(1):61–81. [Google Scholar]
- Lipton R, Gruenewald P. The spatial dynamics of violence and alcohol outlets. Journal of Studies on Alcohol. 2002;63(2):187–195. doi: 10.15288/jsa.2002.63.187. [DOI] [PubMed] [Google Scholar]
- Lipton R, Yang X, Braga A, Goldstick J, Newton M, Rura M. The geography of violence, alcohol outlets and drug arrests in Boston. American Journal of Public Health. 2013;103(4):657–664. doi: 10.2105/AJPH.2012.300927. [DOI] [PMC free article] [PubMed] [Google Scholar]
- Livingston M. A longitudinal analysis of alcohol outlet density and assault. Alcoholism. 2008;32(6):1074–1079. doi: 10.1111/j.1530-0277.2008.00669.x. [DOI] [PubMed] [Google Scholar]
- Lum C. The geography of drug activity and violence: Analyzing spatial relationships of non-homogenous crime event types. Substance Use and Misuse. 2008;43(2):179–201. doi: 10.1080/10826080701690573. [DOI] [PubMed] [Google Scholar]
- Madensen TD, Eck JE. Violence in bars: Exploring the impact of place manager decision-making. Crime Prevention & Community Safety. 2008;10:111–125. [Google Scholar]
- Mair C, Gruenewald PJ, Ponicki WR, Remer L. Varying impacts of alcohol outlet densities on violent assaults: Explaining differences across neighborhoods. Journal of Studies on Alcohol and Drugs. 2012;74(1):50–59. doi: 10.15288/jsad.2013.74.50. [DOI] [PMC free article] [PubMed] [Google Scholar]
- Mohler GO, Short MB, Brantingham PJ, Schoenberg FP, Tita GE. Self-exciting point process modeling of crime. Journal of the American Statistical Association. 2011;106(493):100–108. [Google Scholar]
- Nielsen AL, Hill TD, French MT, Hernandez MN. Racial/ethnic composition, social disorganization, and offsite alcohol availability in San Diego County, California. Social Science Research. 2010;39(1):165–175. doi: 10.1016/j.ssresearch.2009.04.006. [DOI] [PMC free article] [PubMed] [Google Scholar]
- Nolen-Hoeksema S. Gender differences in risk factors and consequences for alcohol use and problems. Clinical Psychology Review. 2004;24:981–1010. doi: 10.1016/j.cpr.2004.08.003. [DOI] [PubMed] [Google Scholar]
- Norström T. Outlet density and criminal violence in Norway, 1960–1995. Journal of Studies on Alcohol and Drugs. 2000;61(6):907–911. doi: 10.15288/jsa.2000.61.907. [DOI] [PubMed] [Google Scholar]
- Pridemore WA, Grubesic TH. Community organization moderates the effect of alcohol outlet density on violence. The British Journal of Sociology. 2012a;63(4):680–703. doi: 10.1111/j.1468-4446.2012.01432.x. [DOI] [PubMed] [Google Scholar]
- Pridemore WA, Grubesic TH. A spatial analysis of the moderating effects of land use on the association between alcohol outlet density and violence in urban areas. Drug and Alcohol Review. 2012b;31(4):385–393. doi: 10.1111/j.1465-3362.2011.00329.x. [DOI] [PubMed] [Google Scholar]
- Resko SM, Walton MA, Bingham CR, Shope JT, Chermack ST, Zimmerman M, et al. Cunningham RM. Alcohol availability and youth violence: A multi-level analysis of the role of outlet density. American Journal of Community Psychology. 2010;46(3):252–262. doi: 10.1007/s10464-010-9353-6. [DOI] [PMC free article] [PubMed] [Google Scholar]
- Romley JA, Cohen D, Ringel J, Sturm R. Alcohol and environmental justice: The density of liquor stores and bars in urban neighborhoods in the United States. Journal of Studies on Alcohol and Drugs. 2007;68(1):48–55. doi: 10.15288/jsad.2007.68.48. [DOI] [PubMed] [Google Scholar]
- Roncek DW, Maier PA. Bars, blocks, and crimes revisited—Linking the theory of routine activities to the empiricism of hot spots. Criminology. 1991;29(4):725–753. [Google Scholar]
- Sampson RJ, Raudenbush SW, Earls F. Neighborhoods and violent crime: A multilevel study of collective efficacy. Science. 1997;277(5328):918–924. doi: 10.1126/science.277.5328.918. [DOI] [PubMed] [Google Scholar]
- Sempos CT, Rehm J, Wu T, Crespo CJ, Trevisan M. Average volume of alcohol consumption and all-cause mortality in African Americans: The NHEFS cohort. Alcoholism. 2003;27(1):88–92. doi: 10.1097/01.ALC.0000046597.92232.73. [DOI] [PubMed] [Google Scholar]
- Sherman LW, Gartin PR, Buerger ME. Hot spots of predatory crime: Routine activities and the criminology of place. Criminology. 1989;27(1):27–56. [Google Scholar]
- Snowden AJ, Pridemore WA. Alcohol and violence in a nonmetropolitan college town: Alcohol outlet density, outlet type, and assault. Journal of Drug Issues. 2013a;43(3):357–373. [Google Scholar]
- Snowden AJ, Pridemore WA. Alcohol outlets, social disorganization, land use, and violence in a large college town: Direct and moderating effects. Criminal Justice Review. 2013b;38(1):29–49. [Google Scholar]
- Stockwell T, Gruenewald P. Controls on the physical availability of alcohol. In: Heather N, Stockwell T, editors. The essential handbook of treatment and prevention of alcohol problems. New York, NY: Wiley; 2001. pp. 213–235. [Google Scholar]
- Taddy MA. Autoregressive mixture models for dynamic spatial Poisson processes: application to tracking intensity of violent crime. Journal of the American Statistical Association. 2010;105(492):1403–1417. [Google Scholar]
- Toomey TL, Erickson DJ, Carlin BP, Lenk KM, Quick HS, Jones AM, Harwood EM. The association between density of alcohol establishment and violent crime within urban neighborhoods. Alcoholism. 2012;36(8):1468–1473. doi: 10.1111/j.1530-0277.2012.01753.x. [DOI] [PMC free article] [PubMed] [Google Scholar]
- U.S. Census. Flint, Michigan segregation: Dissimilarity indices. 2010 Retrieved from http://www.censusscope.org/us/m2640/chart_dissimilarity.html.
- Wood S. Generalized additive models: An introduction with R. Boca Raton, FL: CRC Press/Chapman and Hall; 2006. [Google Scholar]