Abstract
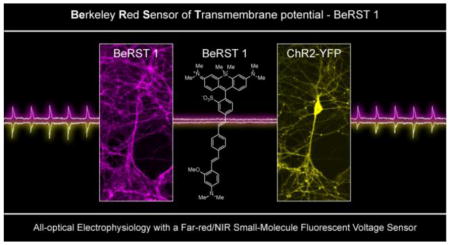
This paper describes the design and synthesis of a photostable, far-red to near-infrared (NIR) platform for optical voltage sensing. We developed a new, sulfonated silicon rhodamine fluorophore and integrated it with a phenylenevinylene molecular wire to create a Berkeley Red Sensor of Transmembrane potential, or BeRST 1 (“burst”). BeRST 1 is the first member of a class of farred to NIR voltage sensitive dyes that make use of a photoinduced electron transfer (PeT) trigger for optical interrogation of membrane voltage. We show that BeRST 1 displays bright, membrane-localized fluorescence in living cells, high photostability, and excellent voltage sensitivity in neurons. Depolarization of the plasma membrane results in rapid fluorescence increases (24% ΔF/F per 100 mV). BeRST 1 can be used in conjunction with fluorescent stains for organelles, Ca2+ indicators, and voltage-sensitive fluorescent proteins. In addition, the red-shifted spectral profile of BeRST 1, relative to commonly employed optogenetic actuators like ChannelRhodopsin2 (ChR2), which require blue light, enables optical electrophysiology in neurons. The high speed, sensitivity, photostability and long-wavelength fluorescence profiles of BeRST 1 make it a useful platform for the non-invasive, optical dissection of neuronal activity.
Introduction
Rapid changes in the membrane potential (Vmem) of excitable cells like neurons and cardiomyocytes play a central role in defining cellular signaling and physiological profiles of these specialized cells. Classically, Vmem is monitored and measured via patch clamp electrophysiology, in which a microelectrode attached to the cell of interest enables highly sensitive recordings of membrane voltage with exquisite temporal resolution.1 However, the use of electrodes is highly invasive, limits records to the soma of a single cell (space clamp error),2 and is extremely low throughput. Optical techniques for recording voltage represent a feasible solution to these problems, because they are minimally invasive, requiring delivery of a sensor and photons, and can be high throughput.3,4 Ca2+ imaging has long been used a surrogate for direct optical measurement of voltage, in part because the robust imaging agents, whether based on small molecules5–7 or on fluorescent proteins,8 are sensitive, applicable to a wide range of biological contexts, and come in a variety of colors.9 The use of Ca2+ imaging provides only an imperfect approximation of Vmem changes, since intracellular [Ca2+] ([Ca2+]i) rises are triggered by the depolarization of Vmem.10 Additionally, because [Ca2+]i transients last for hundreds of milliseconds and because the Ca2+ sensors themselves can buffer the rise and fall of [Ca2+]i, resolving fast spiking neuronal events becomes impossible or difficult, requiring extensive deconvolution protocols.11,12
Direct voltage imaging, therefore, is attractive, because it can provide a direct readout of Vmem while still achieving the spatial resolution, high throughput and minimal invasiveness of Ca2+ imaging.3,4 Recently, there has been renewed interest in the development fluorescent voltage sensors, through the use of small molecules,13–17 fluorescent proteins,18,19 combinations of the two,20,21 or opsins.22
Our lab is developing VoltageFluors,23 or VF dyes, a small molecule platform for voltage sensing that relies on photoinduced electron transfer (PeT)24 modulated by changes in Vmem to achieve fast, sensitive, non-disruptive voltage sensing. While the original VF dyes13,23 have already proved useful in cultured neurons,13,23 brain slices,23 ex vivo leech nervous system25 and mouse pancreatic models,26 a significant limitation is an excitation and emission profile that lies in the blue/green region of the electromagnetic spectrum. Because VF dyes are excited in the 480 to 515 nm range and emit around 530 nm, this significantly overlaps with a number of useful optical tools, such as GFP, robust Ca2+ sensors like Oregon Green BAPTA27 and the GCaMP family,8,28,29 and optogenetic tools like ChannelRhodopsin2 (ChR2).30,31 Additionally, for imaging in thicker biological samples like tissue slices or whole animals, excitation and emission profiles (650 to 900 nm) are desirable because lower energy photons reduce tissue damage, scatter less, are absorbed by fewer endogenous chromophores, and produce lower levels of autofluorescence.32 Voltage sensitive dyes that possess excitation and emission profiles in the near-infrared (NIR) window would enable integration with current optical tools and avoid complications associated with imaging at shorter wavelengths.
Result and Discussion
Design and Synthesis of Sulfonated Silicon Rhodamine
Here, we report the design and development of Berkeley Red Sensor of Transmembrane potential 1 (BeRST 1, “burst”), a new voltage-sensitive sulfonated silicon-rhodamine (Si-rhodamine) fluorophore. Si-rhodamines have gained attention recently because they display photostable, far-red to NIR fluorescence that can be readily modulated by PeT.33 BeRST 1 features a Si-rhodamine33,34 core bearing a sulfonic acid on the meso aryl ring. This sulfonated Si-rhodamine, which we term Berkeley Red, or BR (Scheme 1), provides far-red to NIR excitation and emission profiles on account of the Si-substituted xanthene, and improved retention of the dye at the extracellular surface of cell membranes, due to the anionic sulfonate (see below).13,23
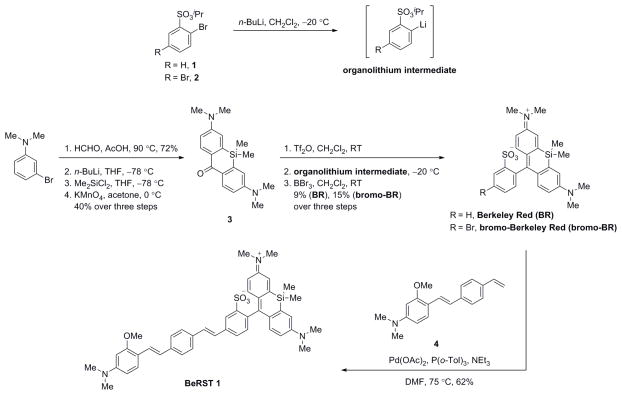
Scheme 1.
Synthesis of Berkeley Red Sensor of Transmembrane Potential 1 (BeRST 1)
BR was synthesized in three steps from intermediates 1 and 3, which are available in 1 and 4 steps, respectively, from reported procedures.35,36 The key step in the synthesis of BR core with attendant sulfonate is the nucleophilic addition of an organolithium intermediate, derived from lithium-halogen exchange on 1, to xanthone 3 that had been activated with triflic anhydride. Deprotection of the isopropyl ester with BBr3 provided BR in 9%, over three steps (Scheme 1).
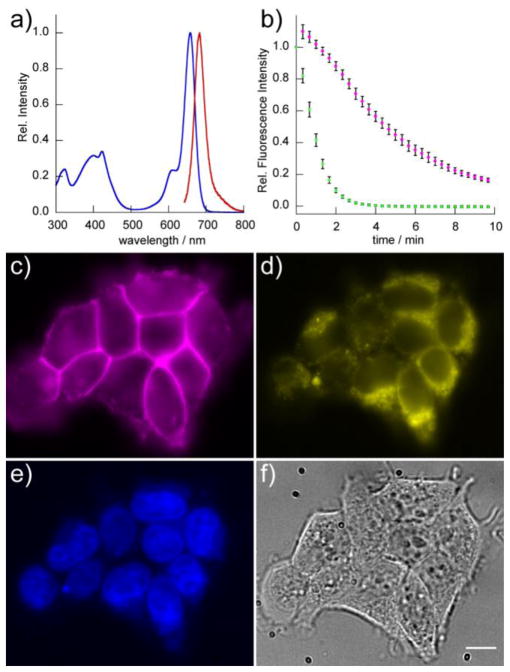
BR displays an absorbance profile centered at 658 nm and an extinction coefficient of 150,000 M−1 cm−1 in aqueous buffer (Fig. 1a, 50 mM TBS, pH 7.5, 0.1% SDS). BR features far-red to NIR fluorescence, emitting strongly at 681 nm (Φfl = 0.24 in TBS/SDS buffer and 0.32 in methanol). A key requirement for the use of BR in voltage sensing applications is that BR not cyclize to the non-fluorescent state in low dielectic environments like the cell membrane. Although this spirocylization is a useful property for superresolution microscopy,37,38 cyclization leads to a more hydrophobic conformation and encourages the passage of the voltage sensor through the plasma membrane. Staining of internal membranes and cytosol then sharply increases background fluorescence and limits the useful signal one can extract from an imaging experiment. As predicted, placement of a sulfonate group on the meso aryl ring prevented spirocyclization, with no change in absorbance observed in either acidic or basic environments (pH 2.5 to 9) (SI Fig. 1c and e). BR absorbance remains unchanged (SI Fig. 1b and d) through a range of solvent dielectric constants from ε = 6 (10% water/dioxane v/v) to ε = 71 (90% water/dioxane v/v),39 confirming that BR conformation displays minimal dependence on solvent polarity. The environmental insensitivity of BR stands in stark contrast to carboxy Si-Rhodamine derivatives, which display massive absorbance fluctuations upon changes in the dielectric constant of the solvent.37 The spirocyclization is effectively minimized by replacement of carboxyl with sulfonate. We further confirmed that BR’s sulfonic acid renders it cell-impermeant, as HEK cells bathed in BR showed negligible cytosolic fluorescence. (SI Fig. 2)
Figure 1.
In vitro and cellular characterization of BeRST 1. Absorbance (blue) and emission (red) spectra of a) BeRST 1 in aqueous buffer (50 mM TBS, pH 7.5, 0.1% SDS). Excitation was provided at 635 nm. b) Photostability of BeRST 1 and VF2.1.Cl dyes in HEK cells. Cells were loaded with 200 nM BeRST 1 or VF2.1.Cl and then illuminated continuously for 10 min at either 631 nm (BeRST 1) or 475 nm (VF2.1.Cl) at 162 W/cm2. Images were acquired at 20 second intervals. The normalized fluorescence intensity from dye-loaded cells was plotted vs. time. Magenta circles represent BeRST 1-stained cells and green circles represent VF-2.1.Cl-stained cells. Error bars are standard error of the mean for n = 6 separate experiments. Multi-color epifluorescence imaging with BeRST 1. HEK cell were loaded with 1 μM BeRST 1, 1 μM Hoechst 33342, and 5 μM Rhodamine 123. c) BeRST 1 fluorescence localized to the cell membrane, d) Rhodamine 123 fluorescence localized to mitochondria, e) Hoechst 33342 fluorescence localized to the nucleus, and f) transmitted light DIC of HEK cells. Scale bar is 10 μm.
Design and Synthesis of BeRST 1
Having established that sulfonated Si-rhodamine BR possesses bright, long-wavelength fluorescence and absorbance that does not vary with pH or solvent dielectric, we further elaborated BR with a phenylenevinylene molecular wire to generate BeRST 1. The key brominated Berkeley Red (bro-mo-BR, Scheme 1) was synthesized in 15% yield via chelation-assisted lithiation of 2. Lithiation was accomplished in CH2Cl2 at −20 °C, with triflic anhydride used to activate 3 for addition of the organolithium species. A variety of other conditions involving different combinations of solvents (THF, CH2Cl2), reagents (nBuLi, iPrMgCl·LiCl40), additives (MgSO4), and temperatures (−78 °C, −40 °C and 22 °C) all gave no reaction, insufficient yield, or complicated mixtures.
Regio-selective lithiation under the optimized reaction conditions was confirmed by quenching the generated lithium species with acid to give a product consistent by 1H NMR with ortho–lithiation (SI Spectrum 10).41 Pd-catalyzed Heck coupling of bromo-BR with methoxy-substituted phenylenevinylene dimethyl aniline molecular wire 4 available in 3 steps according to established procedures23 provided BeRST 1 in 62% yield, after purification on silica gel. BeRST 1 exhibits spectral properties similar to the parent BR dye, with excitation and emission centered at 658 nm and 683 nm (Fig. 1a compare to SI Fig. 1a). Compared to BR, the quantum yield of BeRST 1 is substantially reduced, at 0.017 and 0.022 in aqueous buffer and MeOH, respectively.
Cellular Characterization of BeRST 1
BeRST 1 localizes to cell membranes when bath applied to HEK cells (Fig. 1c). Importantly, BeRST 1 fluorescence remained localized to the cell membrane throughout the course of imaging experiments. This is in contrast to the BR fluorophore in isolation, which displays negligible cellular fluorescence after loading under identical conditions further establishing the ability of the sulfonate in BeRST 1 and BR to prevent dye internalization (SI Fig. 2a vs. c).
BeRST 1 shows excellent photostability (Fig. 1b), with a bleaching half-life of approximately 5 minutes under intense illumination conditions (I = 162 W/cm2, 631 nm LED). Which is approximately an order of magnitude higher than intensities used for BeRST 1 imaging in concert with other optical tools (see Figures 4, 7 and 8). By comparison, VF2.1.Cl, which has a similar voltage sensitivity, 27% ΔF/F per 100 mV, has a bleaching half-life of <60 seconds under identical illumination intensities (I = 162 W/cm2, 475 nm LED). Since BeRST 1 has a larger extinction coefficient than VF2.1.Cl at the incident irradiation (150,000 vs 98,000), this comparison slightly underestimates the photostability of BeRST 1 (Si-rhodamine) relative to VF2.1.Cl (fluorescein).
Figure 4.
Spontaneous voltage imaging in GFP-labeled cells with BeRST 1. Epifluorescence images of rat hippocampal neurons expressing a) GFP and b) stained with BeRST 1. Scale bar is 20 μm. c) Optical traces of spontaneous activity in neurons from panels a and b. Numbers next to traces correspond to indicated cells in panel b. Optical sampling rate is 500 Hz.
Figure 7.
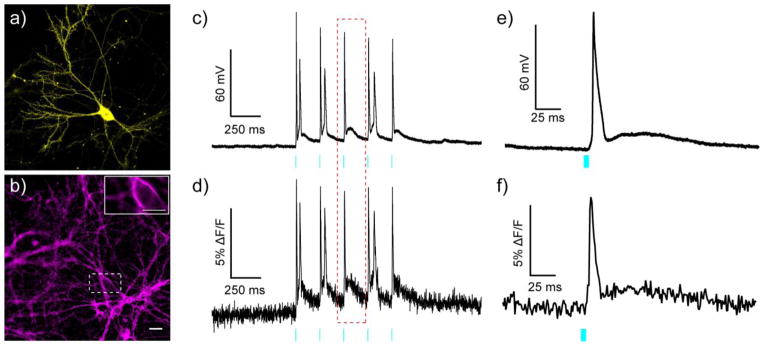
All optical electrophysiology with BeRST 1 and ChR2. Epifluorescence images of rat hippocampal neurons expressing a) YFP-ChR2 and b) stained with BeRST 1. Inset on panel b is the region inscribed by the dotted white box. The inset image is single frame used to acquire data for panels d and f. Scale bars are 20 μm (panel a/b) and 10 μm (panel b, inset). Simultaneous c) electrophysiological and d) optical recording of membrane potential changes evoked by optogenetic stimulation of the neuron expressing YFP-ChR2 and stained with BeRST 1. Cyan light (475 nm LED, 80 mW/cm2) was provided in 5 ms pulses at a rate of 5 Hz. Magnified view of e) electrophysiological and f) optical recording of the action potential highlighted in the red, dotted box from panels c and d. Optical sampling rate was 1 kHz.
Figure 8.
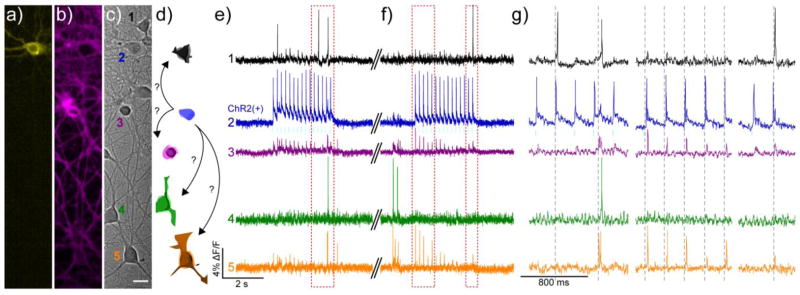
Using BeRST 1 and ChR2 to perturb network activity. Cultured rat hippocampal c) neurons transfected with a) YFP-ChR2 and stained with b) BeRST 1 were stimulated with 475 nm light (80 mW/cm2, 5 ms, 5 Hz, cyan bars) during two separate 3 second periods to evoke activity in the YFP-ChR2-expressing cell. Scale bar is 20 μm. d) Schematic representation of neurons from DIC image in panel c), color-coded to match the corresponding traces in e–g). The blue ChR2(+) cell is depicted making possible connections to other neurons in the field of view. Optical records of BeRST 1 responses were acquired at 500 Hz with an sCMOS camera during e) an optical recording session and f) subsequent trial, separated by approximately 30 seconds (double hash). Numbers and colors of traces refer to specific neurons in panels a–d. Red boxes indicate areas of the trace that have been magnified for clarity in panel g). Dotted grey lines are provided in panel g) to help visually estimate the spike timing of BeRST 1-stained neurons.
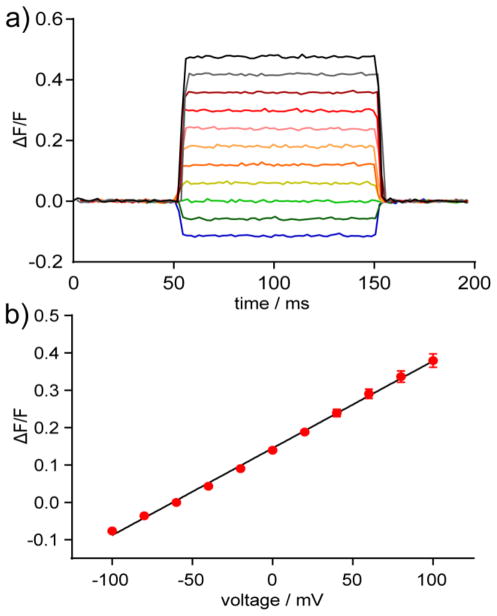
To determine the voltage sensitivity of BeRST 1, we performed whole-cell patch clamp electrophysiology on HEK cells loaded with 1 μM BeRST 1 (Fig. 2a and b). Depolarization of voltage-clamped HEK cells with BeRST 1 results in prompt increases in fluorescence, while hyperpolarization gives fluorescence decreases (Fig. 2b, SI Movie 1). BeRST 1 has a voltage sensitivity of approximately 24% ± 5% ΔF/F per 100 mV comparable to first generation blue light-excitable VoltageFluors and is linear over a physiologically relevant range spanning ± 100 mV (Fig. 2b).
Figure 2.
Voltage sensitivity of BeRST 1 in HEK cells. a) Plot of fractional change in fluorescence (ΔF/F) vs time from BeRST 1-stained HEK cells under whole-cell, voltage-clamp conditions. Cells were held at −60 mV and stepped to hyper- or de-polarizing potentials (± 100 mV) in 20 mV increments. b) Plot of ΔF/F vs. final membrane potential. Error bars are ± standard error of the mean for n = 15 cells from 3 different cultures).
Voltage Imaging with BeRST 1 in Neurons
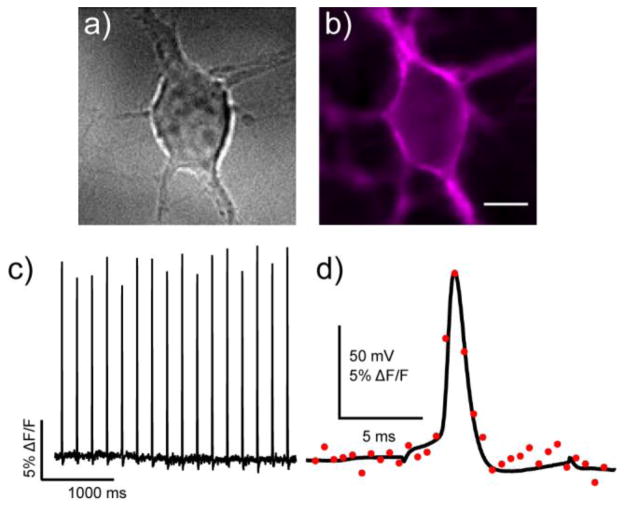
BeRST 1 stained cell membranes of cultured hippocampal neurons equally well (Fig. 3a and b). Whole-cell patch-clamp electrophysiology on cultured neurons loaded with BeRST 1 established that BeRST 1 can detect action potentials (APs) in single trials. Action potentials were evoked under current clamp mode, and the resulting optical response matched the recorded Vmem changes exactly (Fig. 3d). Optically recorded action potentials (1.8 kHz optical sampling) were indistinguishable from a simultaneously recorded traditional electrophysiological trace. When measured electro-physiologically, the FWHM duration of action potentials were 1.65 ± 0.15 ms, while optical action potential records gave values of 1.97 ± 0.14 ms (n = 7 cells each condition). The difference of 0.32 ms is far less than our optical sampling interval of 0.56 ms, and therefore within the error of measurement for our current imaging apparatus. Optical responses from BeRST 1 for action potentials under these conditions were approximately 9.5% ΔF/F (± 1.2%, n = 7 cells).
Figure 3.
Action potential (AP) visualization with BeRST 1. a) Rat hippocampal neurons were b) stained with 1 μM BeRST 1 and field stimulated to evoke action potentials that were c) recorded optically. Optical sampling frequency is 500 Hz, acquired with an EMCCD camera under 63× magnification. Scale bar is 10 μm. In a separate experiment, neurons were subjected to whole-cell current clamp and stimulated to induce action potential firing. Dual electrical and optical recording (1.8 kHz frame rate) are shown in panel (d). Black trace is the electrophysiological recording and red circles represent the optical response. A small stimulus artifact is apparent before and after the action potential in the black trace.
Using whole-cell patch clamp electrophysiology without imaging, we established that the presence of BeRST 1 has no discernable effect on the ability of neurons to fire action potentials or on the measured properties of the action potentials. We found no difference in peak action potential amplitude, duration, rise time, decay time or cellular capacitance when comparing the electrophysiological response to stimulation in neurons with or without 1 μM BeRST 1 (n = 12 and 11 dye-free and dye-loaded neurons, SI Fig. 3). Action potentials were readily detectable under field stimulation conditions as well, giving 17.8% ΔF/F (± 1.6%, n = 5 cells) (Fig. 3c). In most cases, a repolarization is visible following the action potential, further highlighting the utility of BeRST 1 to detect and report on full action potential waveforms.
Multi-color Imaging with BeRST 1
One of the benefits of voltage sensors in the far-red to NIR window is that these new tools can be interfaced with a wide variety of blue, green, and red optical tools. Of particular interest are the genetically encoded optical tools based on GFP, since on the whole, these fluorescent proteins are more widely used and exhibit more predictable cellular and photophysical behavior than their red fluorescent counterparts.42,43 We first established that BeRST 1 can perform multi-color imaging with some commonly used molecular probes for cellular organelles: the nucleus and mitochondria. We performed simultaneous three-color live cell imaging with BeRST 1 (Fig. 1c), rhodamine 123 mitochondrial stain (Fig. 1d),44 and Hoescht 33342 nuclear stain (Fig. 1e).45 Under these conditions distinct cellular components were clearly visible in 3 colors, establishing the utility of BeRST 1 for multicolor imaging. (Fig. 1c–f)
Functional information is often required from a sub-set of cells, which are typically identified by the targeted expression of a fluorescent protein. We next sought to establish the ability of BeRST 1 to provide multi-color functional imaging, by pairing BeRST 1 staining with GFP labeling. Neurons expressing cytosolic GFP were loaded with BeRST 1 and then action potentials were evoked via field stimulation (SI Fig 4). Under these conditions, BeRST 1 gave large changes in fluorescence in cells not expressing GFP, approximately 9.2% ΔF/F per action potential (± 1.6 %), with a SNR of 62:1. GFP-expressing cells in the same field of view gave virtually identical responses (8.7 ± 0.8% ΔF/F, SNR = 63:1, n = 5 pairs of cells) establishing that the response of BeRST 1 is not diminished by the presence of GFP, nor by optical bleedthrough or cross-excitation of GFP (SI Fig. 4). We envision this methodology could be used to label cells or sub-cellular locales of interest with an optically orthogonal fluorescent protein (GFP) and then record from regions of interest (ROIs) defined by the fluorescent protein. Although extracellular field stimulation confirmed that the presence of GFP does not attenuate the BeRST 1 optical response, it did not allow us to interrogate independent signals coming from GFP-positive and negative cells, since all neurons respond to extracellular field stimulation.
To demonstrate that we could spatially segregate individual neuronal activity in cultures expressing GFP, we imaged spontaneous activity in the same cultures expressing GFP and labeled with BeRST 1. Using GFP to define regions of interest, we could clearly distinguish the activity of the cell of interest from the surrounding cells. In Figure 4, the ROIs defined by the GFP-positive neurons (#3 and #6) clearly display activity strikingly different from the other four cells in the field of view. Taken together, these experiments demonstrate the ability of BeRST 1 to provide multisite optical recording of neuronal activity in parallel with a GFP counter-stain.
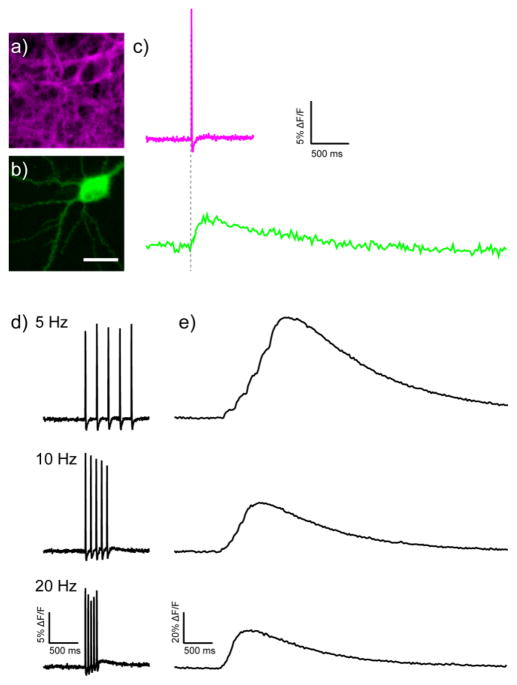
We next determined the ability of BeRST 1 to participate in two-color, multi-functional imaging, that is, combining voltage imaging with either Ca2+ imaging, voltage imaging, or optogenetic manipulation via ChR2. The GCaMP28,29 family of Ca2+ sensors are one of the most widely used functional probes for systems and cellular neuroscience. However, because the excitation and emission spectrum of GCaMP lies squarely within the regime of previous generations of VoltageFluors13,23 (as well as other functional probes), this has precluded the use of GCaMPs with PeT-based voltage sensitive dyes. Neurons expressing the genetically encoded Ca2+ sensor, GCaMP6s,29 which provides the largest fluorescence response to Ca2+, were stained with BeRST 1 (Fig. 5a and b). GCaMP6s-positive neurons (Fig. 5b) displayed bright green cytosolic fluorescence, while membranes were clearly labeled with BeRST 1 (Fig. 5a). We evoked action potentials via field stimulation and obtained optical recordings, first in the green channel for GCaMP6s and then in the far-red to NIR channel for BeRST 1, from a single cell expressing GCaMP6s and stained with BeRST 1 (Fig. 5a and b). In sequential optical traces, both the rise in Vmem and rise in [Ca2+]i are clearly visible (Fig. 5c). Dual BeRST 1 and GCaMP6s imaging enables discrimination of voltage and Ca2+ transients, with the voltage transient (approximately 15% ΔF/F) preceding the measured GCaMP6s signal (approximately 5% ΔF/F) for a single evoked action potential (Fig. 5c). One of the advantages of voltage imaging is the ability to deconvolve fast spiking that Ca2+ imaging, with its slower intrinsic signals and slow probe unbinding kinetics, often cannot resolve. When neurons expressing both GCaMP6s and stained with BeRST 1 were stimulated to evoke trains of action potentials at 5, 10, and 20 Hz, discrete Vmem responses corresponding to individually evoked action potentials were visible in the BeRST 1 channel at all frequencies (Fig. 5d), while Ca2+ response as measured by GCaMP6s were only discernable at 5 Hz, as measured by small changes in on the rising edge of GCaMP6s fluorescence (Fig. 5e). Due to the intrinsic response speed of BeRST 1, two-color functional imaging should be generalizable to many other types of Ca2+ indicators. These experiments highlight the ability of BeRST 1 to participate in functional imaging experiments in which multiple signals need to be interpreted in the same system.
Figure 5.
Dual voltage and Ca2+ imaging with BeRST 1 and GCaMP6s. Epifluorescence images of a rat hippocampal neuron stained a) with BeRST 1 and expressing b) GCaMP6s. Scale bar is 20 μm. c) Sequential Ca2+ and voltage imaging during field stimulation of the neuron in panels a and b. Voltage- (upper) and Ca2+- (lower) induced changes in fluorescence. d) Voltage- (left) and e) Ca2+- (right) induced fluorescence response to trains of action potentials at the indicated frequency. Optical sample rate is 500 Hz for BeRST 1 and 40 Hz for GCaMP6s.
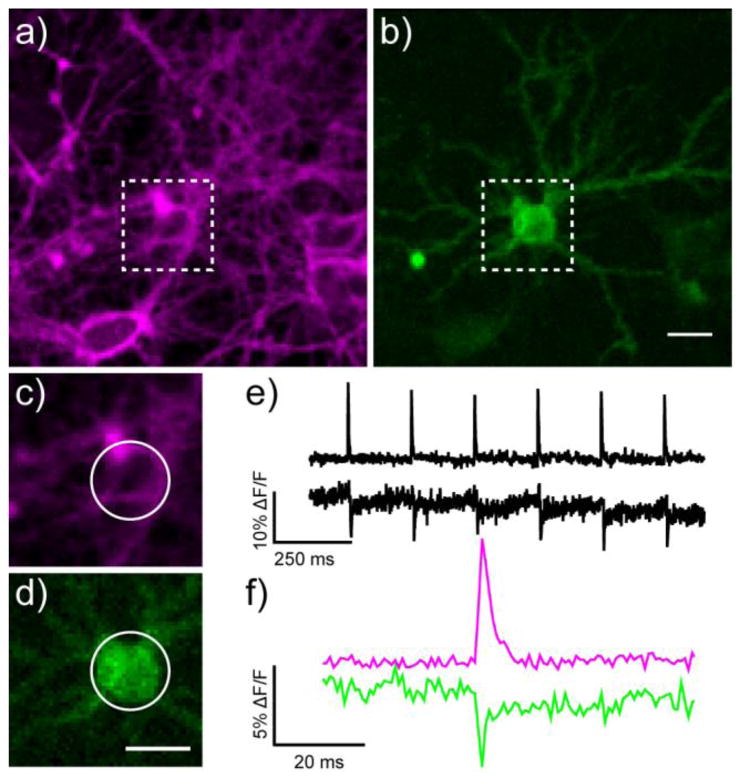
The non-overlapping signals emanating from BeRST 1 and GFP-based fluorophores provide a unique opportunity to perform two-color voltage imaging. We expressed the genetically-encoded voltage sensor, ASAP1,19 in cultured neurons and stained these neurons, as before, with BeRST 1 (Fig. 6a–d). In response to an evoked train of action potentials (Fig. 6e), ASAP1 provides decreases in relative fluorescence of about 6% ± 1.4 % (S.E.M., with a signal to noise ratio, SNR, of 8:1, n = 4 cells), which is consistent with the reported value of −4.8% ΔF/F.19 BeRST 1, in the same cell, under identical stimulation parameters (Fig. 6e), gives a 15% ± 2.1% increase (S.E.M., SNR of 41:1, n = 4 cells), highlighting the utility of BeRST 1 for measurement of fast spiking events and for two-color voltage imaging with complementary genetically-encoded voltage sensors based on GFP.18
Figure 6.
Two-color voltage imaging with genetically encoded voltage-fluorescent proteins and small molecule voltage-sensitive dyes. Epifluorescence images of rat hippocampal neurons a) stained with BeRST 1 and b) expressing the voltage-sensitive fluorescent protein ASAP1. Zoomed-in region for functional imaging of voltage via c) BeRST 1 staining or d) ASAP1 fluorescence. The magnified regions correspond to the white boxes in panels a and b. All scale bars are 20 μm. Trains of action potentials evoked by field stimulation at 5 Hz detected by changes in e) BeRST 1 fluorescence (upper trace) or ASAP1 fluorescence (lower trace). f) A single action potential, magnified from panel e. Magenta is BeRST 1 and green is ASAP1 fluorescence. The optical sampling rate was 1.25 kHz.
Optical Electrophysiology with BeRST 1 and ChR2
Finally, we hoped to interface BeRST 1 with optogenetic tools like ChannelRhodopsin2 (ChR2) in order to demonstrate the feasibility of using light to both actuate and record the Vmem of living cells in an “all-optical” electrophysiology methodology.4,22,46 The action spectrum of ChR2 (470 nm peak response),47 one of the more heavily-used optogenetic tools, contains significant overlap with the first generation of VoltageFluor dyes. Although red-shifted variants of ChR have been reported, all of them contain significant response peaks in the blue region of the spectrum.48–51 For this reason, it is advantageous to move the voltage-imaging component into the far-red to NIR region of the spectrum to avoid crosstalk in the optical channels for activation and recording.
Before carrying out optical recording of light-induced action potentials, we investigated whether any optical cross-talk exists between BeRST 1 and ChR2. We found a small amount of cross excitation of BeRST 1. When excited at 475 nm, BeRST 1-stained cells show fluorescence that is approximately 4% the intensity achieved with excitation at 631 nm (9.7 W/cm2, 475 nm and 631 nm, SI Fig. 5a–d). Because ChR2 requires much lower light intensity relative to typical imaging light intensities for BeRST 1 (80 mW/cm2, 475 nm vs 20 W/cm2, 631 nm for multicellular imaging), we estimate that less than 0.1% of BeRST 1 signal comes from cross excitation of ChR2 in actual imaging experiments.
Cross excitation is also observed upon excitation of BR and BeRST 1 derivatives in vitro (SI Fig. 6a and b). Excitation of BR or BeRST 1 derivatives in aqueous buffer with cyan light (475 nm) gives approximately 1% or 7% of the total emission when compared to excitation at 630 nm, respectively (SI Fig. 6c). Violet excitation (390 nm) in vitro gives 16% (BR) and 35% (BeRST 1) of full emission (SI Fig. 6c), which is consistent with cross excitation of BeRST 1 in cellular membranes (approximately 47% with 9.7 W/cm2 390 nm excitation) (SI Fig. 5c and d). HEK cells stained with BeRST 1 are voltage sensitive when imaged under violet illumination (SI Fig. 5e, 390 nm excitation, 3.3 W/cm2, 680 nm emission). Studies are underway to probe the nature of this exceptionally long pseudo-Stokes shift (290 nm) which may involve energy transfer from the conjugated molecular wire.36
Having established that negligible cross excitation of BeRST 1 occurs (<0.1%) under experimental conditions, we next sought to establish that BeRST 1 and ChR2 represent optically orthogonal tools for probing and perturbing neuronal activity. Neurons transiently expressing a YFP-ChR2 fusion52 [REF-Zhang Nature 2007] (Fig. 7a and SI Fig. 7b) and loaded with BeRST 1 gave bright membrane staining, as expected (Fig. 7b and SI Fig. 7a). Stimulation of ChR2 with brief pulses of cyan light (5 ms, 475 nm, 80 mW/cm2) resulted in light-induced spikes in membrane potential, as measured via patch clamp electrophysiology in either whole cell (Fig. 7c and d) or cell-attached (SI Fig. 7d) configurations. Control experiments in cells lacking ChR2 show no spiking (data not shown). Optical recording of light-induced spikes with BeRST 1 matched the electrophysiologically recorded activity (Fig. 7c vs. d and e vs. f; SI Fig. 7d and e). Of note is the high SNR achieved by BeRST 1 during optical recordings. Although the SNR of BeRST 1 is low compared to the highly sensitive whole-cell patch clamp method (Fig. 7c–f), optical sensitivity of BeRST 1 compares favorably with records acquired by the less sensitive on-cell patch clamp technique (SI Fig. 7d and e).
As a final demonstration of the efficacy of using BeRST 1 in conjunction with optogenetic tools, we sought to optically probe network behavior in cultured hippocampal neurons. Analysis of neuronal connectivity and function with cellular resolution in intact brains remains an outstanding challenge, making cultured hippocampal neurons an attractive model system for studying both connectivity and function. Indeed, experimental evidence shows that neurons in culture make specific synaptic connections,53 mirroring connectivity encountered in vivo.
We imaged a large area of hippocampal neurons (370 × 62 μm, 20× magnification) stained with BeRST 1 and containing just a single neuron expressing YFP-ChR2 (Fig. 8a–c and SI Fig 8). Continuous optical recording over a period of several seconds demonstrated, as before (Fig. 4) that most neurons remain relatively silent during the recording epoch. Activation of the YFP-ChR2-expressing neuron with cyan light (475 nm, 80 mW/cm2, 5 ms at 5 Hz, Fig. 8e–g, cyan bars) resulted, as before (Fig. 7), in bursts of spikes from the ChR2(+) neuron (Fig. 8, blue trace) that exactly followed the optical stimulation pattern. Unlike previous experiments, in which the optical response of only the ChR(+) cell was captured (Fig. 7 and SI Fig 7), the larger recording area, allowed us to observe how activation of a single neuron affected the surrounding cells (Fig. 8 and SI Movies 2 and 3).
During the first optical stimulation (Fig. 8e and f, cyan bars; SI Movie 2), Neuron 1 (Fig. 8c–e, black cell and trace) the closest neighbor to YFP-ChR2-expressing Neuron 2 (Fig. 8c–e, blue cell and trace) fires a single AP in response to the second AP in Neuron 2 (Fig. 8e, first red box and Fig. 8g, first region). Neurons 3 (Fig. 8c–e, purple cell and trace) and 5 (Fig. 8c–e, orange cell and trace) are only weakly coupled to Neuron 2’s firing and appear to initiate their own doublet of spikes that propagate into Neuron 4 (Fig. 8c–e, green cell and trace) and interrupt the optically induced firing pattern of Neuron 2 (Fig. 8d and e, first red box). This spike doublet is separated by approximately 12 ms and would be difficult to resolve with slower Ca2+ imaging.
During the second epoch of light stimulation, the response of Neuron 1 (Fig. 8d and f, black cell and trace; SI Movie 3) is suppressed, and no longer appears strongly coupled to cues from optically-controlled Neuron 2 (Fig. 8d and f, blue cell and trace). The response of Neurons 3 and 5 are more strongly correlated to the firing of Neuron 2 (Fig. 8f and g, first red box), while Neuron 4 (Fig. 8d and f, green cell and trace) remains silent with the exception of several spontaneous bursts prior to optical activation of Neuron 2. Even in this “simple” cultured hippocampal model, a high degree of in-terconnectedness exists, which would not be observable through methods like Ca2+ imaging. Together, these experiments establish the ability of BeRST 1 to work in concert with classic optogenetic tools to optically interrogate the complexity of neuronal connectivity and function.
Concluding Remarks
We have described the design, synthesis, and characterization of a new sulfonated Si-rhodamine for use in voltage sensing applications. The first member of this new class of sulfonated far-red to NIR fluorophores, Berkeley Red Sensor of Transmembrane potential 1, or BeRST 1, displays bright, membrane-localized fluorescence, is highly photostable, and extremely voltage-sensitive. We show that BeRST 1 can detect action potentials in cultured hippocampal neurons and that BeRST 1 interfaces readily with a number of other optical tools, making BeRST 1 ideally suited for multicolor imaging with GFP, Ca2+ indicators like GCaMP, voltage sensors based on cpGFP such as ASAP1, as well as optogenetic tools like ChR2. Use of BeRST 1 alongside ChR2 permits non-invasive recording and control of membrane potential in single cells and in neuronal microcircuits.
There has been a resurgence, of late, in methods to optically monitor membrane potential, with many promising candidates arriving in the form of new genetically encoded voltage sensitive fluorescent proteins and opsins. Small molecule probes of membrane potential fill a vital role in this regard, as molecular wire PeT voltage sensors require no genetic manipulation, can be delivered to all cell types, respond rapidly to fast voltage changes, and as we show here, can be tuned across a wide color range. We have established that molecular wire PeT voltage sensing based on a phenylenevinylene molecular wire platform accommodates multiple types of fluorophores and that new far-red to NIR voltage sensors provide a convenient interface with well-established optical tools. We anticipate that BeRST 1 will prove to be a valuable tool in efforts to map membrane potential dynamics in a variety of systems.
Experimental Section
General methods for chemical synthesis
Chemical reagents and solvents (dry) were purchased from commercial suppliers and used without further purification. All reactions were carried out in oven-dried flasks under N2. Thin layer chromatography (TLC) (Silicycle, F254, 250 μm) and preparative thin layer chromatography (PTLC) (Silicycle, F254, 1000 μm) were performed on glass backed plates pre-coated with silica gel were visualized by fluorescence quenching under UV light. Flash column chromatography was performed on Silicycle Silica Flash F60 (230 400 Mesh) using a forced flow of air at 0.5 1.0 bar. NMR spectra were measured on Bruker AVB-400 MHz, 100 MHz, AVQ-400 MHz, 100 MHz, Bruker AV-600 MHz, 150 MHz. NMR spectra measured on Bruker AVII-900 MHz, 225 MHz, equipped with a TCI cryoprobe accessory, were performed by Dr. Jeffrey Pelton (QB3). Chemical shifts are expressed in parts per million (ppm) and are referenced to CDCl3 7.26 ppm, 77.0 ppm. Coupling constants are reported as Hertz (Hz). Splitting patterns are indicated as follows: s, singlet; d, doublet; sep, septet dd, doublet of doublet; ddd, doublet of double of doublet; dt, doublet of triplet; td, triplet of doublet; m, multiplet. High-resolution mass spectra (ESI EI) were measured by the QB3/Chemistry mass spectrometry service at University of California, Berkeley.
Isopropyl 2,5-dibromobenzenesulfonate (2)
1,4-Diazabicyclo[2.2.2]octane (0.81 g, 7.2 mmol, 1.2 equiv) was added to 2,5-dibromobenzenesulfonyl chloride54 (2.0 g, 6.0 mmol, 1.0 equiv) in 3:2 CH2Cl2/iPrOH (v/v) (5.0 mL) slowly at 0°C. White precipitate started to form. The reaction mixture was warmed to RT and stirred for 30 min. After the precipitate was removed by filtration, the filtrate was concentrated under reduced pressure and purified by flash column chromatography (5:1 hexanes/EtOAc) to afford the product as a white solid (1.3 g, 3.7 mmol, 62%). 1H NMR (400 MHz, CDCl3) δ 8.25 (d, J = 2.3 Hz, 1H), 7.63 (d, J = 8.4 Hz, 1H), 7.57 (dd, J = 8.4, 2.3 Hz, 1H), 4.86 (sep, J = 6.3 Hz, 1H), 1.38 (d, J = 6.3, 6H); 13C NMR (150 MHz, CDCl3) δ 138.8, 137.2, 136.8, 134.3, 121.4, 119.5, 79.3, 22.8; HRMS (EI) calcd for C9H10Br2O3S+ [M]+ 355.8712, found, 355.8717.
5-bromo-2-(7-(dimethylamino)-3-(dimethyliminio)-5,5-dimethyl-3,5-dihydrodibenzo[b,e]silin-10-yl) benzenesulfonate (bromo-Berkeley Red)
To a CH2Cl2 (1.0 mL) solution of 336 (0.10 g, 0.31 mmol, 1.0 equiv), trifluoromethanesulfonic anhydride (0.10 mL, 0.59 mmol, 1.9 equiv) was added. This solution was stirred at RT for 30 min (Solution A). In another flask, 2 (0.33 g, 0.93 mmol, 3.0 equiv) was dissolved in CH2Cl2 (2.0 mL). The solution was cooled to −20°C and n-BuLi (1.6 M in hexane, 0.58 mL, 0.93 mmol, 3.0 equiv) was added slowly. After 10 min, Solution A was added to the reaction mixture and stirred for 1 h. The crude isopropyl ester protected-product was obtained by PTLC (5:1:1 hexanes/EtOAc/CH2Cl2) and subjected to 1.0 M BBr3 in CH2Cl2 (2.0 mL). The reaction mixture was stirred at RT overnight and purified by PTLC (10:1 CH2Cl2/CH3OH) to afford the desired product as a dark blue solid (25 mg, 0.046 mmol, 15%). 1H NMR (600 MHz, CDCl3) δ 8.51 (d, J = 2.0 Hz, 1H), 7.53 (dd, J = 8.1, 2.0 Hz, 1H), 7.32 (d, J = 9.5 Hz, 2H), 6.99 (d, J = 2.8 Hz, 2H), 6.89 (d, J = 8.1 Hz, 1H), 6.58 (dd, J = 9.5, 2.8 Hz, 2H), 3.25 (s, 12H), 0.55 (apparent s, 3H), 0.53 (apparent s, 3H); 13C NMR (225 MHz, CDCl3) δ 173.6, 153.9, 148.3, 148.2, 143.5, 134.3, 132.2, 131.1, 130.2, 129.0, 122.9, 119.4, 113.3, 40.6, −0.9, −1.2; HRMS (ESI) calcd for C25H27BrN2NaO3SSi+ [M + Na]+ 565.0587, found, 565.0590.
(2-(7-(dimethylamino)-3-(dimethyliminio)-5,5-dimethyl-3,5-dihydrodibenzo[b,e]silin-10-yl) benzenesulfonate) (Berkeley Red)
Berkeley Red was prepared according to the same procedure described above from 3 (50 mg, 0.15 mmol, 1.0 equiv), tri-fluoromethanesulfonic anhydride (26 μL, 0.15 mmol, 1.0 equiv), 155 (83 mg, 0.30 mmol, 1.5 equiv) and n-BuLi (1.6 M in hexane, 0.19 mL, 0.30 mmol, 1.5 equiv). The product was obtained as a dark blue solid (6.3 mg, 0.014 mmol, 9%). 1H NMR (600 MHz, CDCl3) δ 8.35 (dd, J = 8.4, 1.3 Hz, 1H), 7.54 (ddd, J = 8.4, 7.5, 1.3 Hz, 1H), 7.39 (apparent td, J = 7.5, 1.3 Hz, 1H), 7.36 (d, J = 9.6 Hz, 2H), 6.99 (dd, J = 7.5, 1.3 Hz, 1H), 6.98 (d, J = 2.9 Hz, 2H), 6.56 (dd, J = 9.6, 2.9 Hz, 2H), 3.23 (s, 12H), 0.56 (apparent s, 3H), 0.53 (apparent s, 3H); 13C NMR (150 MHz, CDCl3) δ 175.8, 153.9, 148.2, 146.8, 143.8, 135.3, 129.4, 129.4, 128.9, 128.6, 127.9, 119.2, 113.3, 40.5, −0.9, −1.2; HRMS (ESI) calcd for C25H28N2NaO3SSi+ [M + Na]+ 487.1482, found, 487.1478. (5-((E)-4-((E)-4-(dimethylamino)-2-methoxystyryl)styryl)-2-(7-(dimethylamino)-3-(dimethyliminio)-5,5-dimethyl-3,5-dihydrodibenzo[b,e]silin-10-yl)benzenesulfonate) (BeRST 1) Bromo-Berkeley Red (5.0 mg, 9.2 μmol, 1.0 equiv), 4 (2.6 mg, 9.3 μmol, 1.0 equiv), Pd(OAc)2 (1.1 mg, 4.5 μmol, 0.50 equiv), P(o-tol)3 (2.8 mg, 9.2 μmol, 1.0 equiv) and NEt3 (50 μL) were dissolved in DMF (0.10 mL). The solution was stirred at 75°C and the progress of the reaction was monitored by TLC. After the reaction was complete, the crude mixture was purified by PTLC (10:1 CH2Cl2/CH3OH) to afford the product as a dark green solid (4.2 mg, 5.7 μmol, 62%). 1H NMR (900 MHz, 10;1 CDCl3/CD3OD (v/v)) δ 8.34 (d, J = 1.8 Hz, 1H), 7.53 (dd, J = 7.8, 1.8 Hz, 1H), 7.46 (apparent s, 4H), 7.43 (d, J = 8.5 Hz, 1H), 7.39 (d, J = 16.4 Hz, 1H), 7.27−7.21 (m, 3H), 7.14 (d, J = 16.4 Hz, 1H), 6.99−6.94 (m, 3H), 6.91 (d, J = 16.4 Hz, 1H), 6.55 (dd, J = 9.7, 2.8 Hz, 2H), 6.31 (dd, J = 8.5, 2.4 Hz, 1H), 6.19 (d, J = 2.4 Hz, 1H), 3.85 (s, 3H), 3.21 (s, 12H), 2.95 (s, 6H), 0.50 (apparent s, 3H) 0.48 (apparent s, 3H); 13C NMR (225 MHz, 10;1 CDCl3/CD3OD (v/v)) δ 173.3, 158.0, 153.9, 151.4, 148.1, 145.2, 143.3, 138.7, 138.5, 134.9, 134.4, 130.4, 129.6, 128.8, 127.1, 126.9, 126.2, 126.2, 126.2, 125.9, 124.1, 123.7, 119.3, 115.0, 113.2, 105.2, 95.6, 55.3, 40.3, −1.2, −1.4; HRMS (ESI) calcd for C44H48N3O4SSi+ [M + H]+ 742.3129, found, 742.3118.
Spectroscopic measurements
Stock solutions of BR and BeRST 1 were prepared in DMSO (1.0−10 mM) and diluted with TBS (50 mM Tris-HCl, pH 7.5, 0.15 M NaCl) solution containing 0.10 % (w/w) SDS (1:100 −1:1000 dilution). UV absorbance spectra were acquired on a Shimadzu 2501 Spectrophotometer (Shimadzu). Fluorescence spectra were recorded on a Quantamaster Master 4 L-format scanning spectrofluorometer (Photon Technologies International) equipped with an LPS-220B 75-W xenon lamp and power supply, A-1010B lamp housing with integrated igniter, switchable 814 photon-counting/analog photomultiplier detection unit, and MD5020 motor driver. Samples for absorption and fluorescence measurements were contained in 1-cm pathlength quartz cuvettes (Starna Cells). Relative quantum yields were measured in TBS solution containing 0.10 % (w/w) SDS or in CH3OH and referenced to cresyl violet in CH3OH, which has a quantum yield of 0.54.56
Cell culture and imaging
All animal procedures were approved by the UC Berkeley Animal Care and Use Committees and conformed to the NIH Guide for the Care and Use and Laboratory Animals and the Public Health Policy.
Human embryonic kidney 293T (HEK) cells were passaged and plated onto 12 mm glass coverslips pre-coated with Poly-D-Lysine (PDL; 1 mg/ml; Sigma-Aldrich) to provide a confluency of ~15% and 50% for electrophysiology and imaging, respectively. HEK cells were plated and maintained in Dulbecco’s modified eagle medium (DMEM) supplemented with 4.5 g/L D-glucose, 10% FBS and 1% Glutamax. Hippocampi were dissected from embryonic day 18 Sprague Dawley rats (Charles River Laboratory) in cold sterile HBSS (zero Ca2+, zero Mg2+). All dissection products were supplied by Invitrogen, unless otherwise stated. Hippocampal tissue was treated with trypsin (2.5%) for 15 min at 37 °C. The tissue was triturated using fire polished Pasteur pipettes, in minimum essential media (MEM) supplemented with 5% fetal bovine serum (FBS; Thermo Scientific), 2% B-27, 2% 1M D-glucose (Fisher Scientific) and 1% glutamax. The dissociated cells were plated onto 12 mm diameter coverslips (Fisher Scientific) pre-treated with PDL (as above) at a density of 30–40,000 cells per coverslip in MEM supplemented media (as above). Neurons were maintained at 37 °C in a humidified incubator with 5 % CO2. At 3 days in vitro (DIV) half of the MEM supplemented media was removed and replaced with Neurobasal media containing 2% B-27 supplement and 1% glutamax. Transfection of genetic tools was carried out using Lipofectamine 3000 at 7 DIV. Functional imaging was performed on mature neurons 13–20 DIV, except electrophysiological experiments which were performed on 12–15 DIV neurons.
Unless stated otherwise, for loading of HEK cells and hippocampal neurons, BeRST 1 was diluted in DMSO to 1 mM, and then diluted 1:1000 in HBS (in mM) 140 NaCl, 2.5 KCl, 10 HEPES, 10 D-glucose 1.3 MgCl2 and 2 CaCl2; pH 7.3 and 290 mOsmol. All imaging experiments were performed in HBS.
General Imaging Parameters
Epifluorescence imaging was performed on an AxioExaminer Z-1 (Zeiss) equipped with a Spectra-X Light engine LED light (Lumencor), controlled with Slidebook (v6, Intelligent Imaging Innovations). Co-incident excitation with multiple LEDs was controlled by Lumencor software triggered through a Digidata 1332A digitizer and pCLAMP 10 software (Molecular Devices). Images were acquired with either a W-Plan-Apo 20x/1.0 water objective (20x; Zeiss) or a W-Plan-Apo 63x/1.0 water objective (63x: Zeiss). Images were focused onto either an Or-caFlash4.0 sCMOS camera (sCMOS; Hamamatsu) or an eVolve 128 EMCCD camera (EMCCD; Photometrix). More detailed imaging information for each experimental application are detailed in the Supporting Information.
Supplementary Material
Acknowledgments
This work was generously supported by start-up funds from the University of California and by the NIH (R00NS078561). We thank Ms. Danxun Li and Mr. Kaveh Karbasi for assistance with automated analysis routines.
Footnotes
Experimental details, including HPLC spectra, NMR spectra, imaging parameters, electrophysiology data, and supporting figures as referenced in the main text. This material is available free of charge via the Internet at http://pubs.acs.org.
References
- 1.Hamill OP, Marty A, Neher E, Sakmann B, Sigworth FJ. Pflugers Arch. 1981;391:85. doi: 10.1007/BF00656997. [DOI] [PubMed] [Google Scholar]
- 2.Spruston N, Jaffe DB, Williams SH, Johnston D. J Neurophysiol. 1993;70:781. doi: 10.1152/jn.1993.70.2.781. [DOI] [PubMed] [Google Scholar]
- 3.Peterka DS, Takahashi H, Yuste R. Neuron. 2011;69:9. doi: 10.1016/j.neuron.2010.12.010. [DOI] [PMC free article] [PubMed] [Google Scholar]
- 4.Scanziani M, Hausser M. Nature. 2009;461:930. doi: 10.1038/nature08540. [DOI] [PubMed] [Google Scholar]
- 5.Paredes RM, Etzler JC, Watts LT, Zheng W, Lechleiter JD. Methods. 2008;46:143. doi: 10.1016/j.ymeth.2008.09.025. [DOI] [PMC free article] [PubMed] [Google Scholar]
- 6.Adams SR. Cold Spring Harb Protoc. 2010;2010:pdb top70. doi: 10.1101/pdb.top70. [DOI] [PubMed] [Google Scholar]
- 7.Oheim M, van ‘t Hoff M, Feltz A, Zamaleeva A, Mallet JM, Collot M. Biochim Biophys Acta. 2014;1843:2284. doi: 10.1016/j.bbamcr.2014.03.010. [DOI] [PubMed] [Google Scholar]
- 8.Rose T, Goltstein PM, Portugues R, Griesbeck O. Front Mol Neurosci. 2014;7:88. doi: 10.3389/fnmol.2014.00088. [DOI] [PMC free article] [PubMed] [Google Scholar]
- 9.Zhao Y, Araki S, Wu J, Teramoto T, Chang YF, Nakano M, Abdelfattah AS, Fujiwara M, Ishihara T, Nagai T, Campbell RE. Science. 2011;333:1888. doi: 10.1126/science.1208592. [DOI] [PMC free article] [PubMed] [Google Scholar]
- 10.Grienberger C, Konnerth A. Neuron. 2012;73:862. doi: 10.1016/j.neuron.2012.02.011. [DOI] [PubMed] [Google Scholar]
- 11.Vogelstein JT, Packer AM, Machado TA, Sippy T, Babadi B, Yuste R, Paninski L. J Neurophysiol. 2010;104:3691. doi: 10.1152/jn.01073.2009. [DOI] [PMC free article] [PubMed] [Google Scholar]
- 12.Grewe BF, Langer D, Kasper H, Kampa BM, Helmchen F. Nat Methods. 2010;7:399. doi: 10.1038/nmeth.1453. [DOI] [PubMed] [Google Scholar]
- 13.Miller EW, Lin JY, Frady EP, Steinbach PA, Kristan WB, Jr, Tsien RY. Proc Natl Acad Sci U S A. 2012;109:2114. doi: 10.1073/pnas.1120694109. [DOI] [PMC free article] [PubMed] [Google Scholar]
- 14.Yan P, Acker CD, Zhou WL, Lee P, Bollensdorff C, Negrean A, Lotti J, Sacconi L, Antic SD, Kohl P, Mansvelder HD, Pavone FS, Loew LM. Proc Natl Acad Sci U S A. 2012;109:20443. doi: 10.1073/pnas.1214850109. [DOI] [PMC free article] [PubMed] [Google Scholar]
- 15.Matiukas A, Mitrea BG, Qin M, Pertsov AM, Shvedko AG, Warren MD, Zaitsev AV, Wuskell JP, Wei MD, Watras J, Loew LM. Heart Rhythm. 2007;4:1441. doi: 10.1016/j.hrthm.2007.07.012. [DOI] [PMC free article] [PubMed] [Google Scholar]
- 16.Bradley J, Luo R, Otis TS, DiGregorio DA. J Neurosci. 2009;29:9197. doi: 10.1523/JNEUROSCI.1240-09.2009. [DOI] [PMC free article] [PubMed] [Google Scholar]
- 17.Fromherz P, Hubener G, Kuhn B, Hinner MJ. Eur Biophys J. 2008;37:509. doi: 10.1007/s00249-007-0210-y. [DOI] [PMC free article] [PubMed] [Google Scholar]
- 18.Jin L, Han Z, Platisa J, Wooltorton JR, Cohen LB, Pieribone VA. Neuron. 2012;75:779. doi: 10.1016/j.neuron.2012.06.040. [DOI] [PMC free article] [PubMed] [Google Scholar]
- 19.St-Pierre F, Marshall JD, Yang Y, Gong Y, Schnitzer MJ, Lin MZ. Nat Neurosci. 2014;17:884. doi: 10.1038/nn.3709. [DOI] [PMC free article] [PubMed] [Google Scholar]
- 20.Sjulson L, Miesenbock G. J Neurosci. 2008;28:5582. doi: 10.1523/JNEUROSCI.0055-08.2008. [DOI] [PMC free article] [PubMed] [Google Scholar]
- 21.Ghitani N, Bayguinov PO, Ma Y, Jackson MB. J Neurophysiol. 2015;113:1249. doi: 10.1152/jn.00691.2014. [DOI] [PMC free article] [PubMed] [Google Scholar]
- 22.Hochbaum DR, Zhao Y, Farhi SL, Klapoetke N, Werley CA, Kapoor V, Zou P, Kralj JM, Maclaurin D, Smedemark-Margulies N, Saulnier JL, Boulting GL, Straub C, Cho YK, Melkonian M, Wong GK, Harrison DJ, Murthy VN, Sabatini BL, Boyden ES, Campbell RE, Cohen AE. Nat Methods. 2014;11:825. doi: 10.1038/nmeth.3000. [DOI] [PMC free article] [PubMed] [Google Scholar]
- 23.Woodford CR, Frady EP, Smith RS, Morey B, Canzi G, Palida SF, Araneda RC, Kristan WB, Jr, Kubiak CP, Miller EW, Tsien RY. J Am Chem Soc. 2015;137:1817. doi: 10.1021/ja510602z. [DOI] [PMC free article] [PubMed] [Google Scholar]
- 24.Li LS. Nano Lett. 2007;7:2981. doi: 10.1021/nl071163p. [DOI] [PubMed] [Google Scholar]
- 25.Moshtagh-Khorasani M, Miller EW, Torre V. Physiol Rep. 2013;1:e00089. doi: 10.1002/phy2.89. [DOI] [PMC free article] [PubMed] [Google Scholar]
- 26.Dolensek J, Stozer A, Skelin Klemen M, Miller EW, Slak Rupnik M. PLoS One. 2013;8:e82374. doi: 10.1371/journal.pone.0082374. [DOI] [PMC free article] [PubMed] [Google Scholar]
- 27.Gee KR, Poot M, Klaubert DH, Sun W-C, Haugland RP, Mao F. Molecular Probes, Inc; USA: 1997. p. 79. [Google Scholar]
- 28.Nakai J, Ohkura M, Imoto K. Nat Biotechnol. 2001;19:137. doi: 10.1038/84397. [DOI] [PubMed] [Google Scholar]
- 29.Chen TW, Wardill TJ, Sun Y, Pulver SR, Renninger SL, Baohan A, Schreiter ER, Kerr RA, Orger MB, Jayaraman V, Looger LL, Svoboda K, Kim DS. Nature. 2013;499:295. doi: 10.1038/nature12354. [DOI] [PMC free article] [PubMed] [Google Scholar]
- 30.Nagel G, Szellas T, Huhn W, Kateriya S, Adeishvili N, Berthold P, Ollig D, Hegemann P, Bamberg E. Proc Natl Acad Sci U S A. 2003;100:13940. doi: 10.1073/pnas.1936192100. [DOI] [PMC free article] [PubMed] [Google Scholar]
- 31.Zhang F, Vierock J, Yizhar O, Fenno LE, Tsunoda S, Kianianmomeni A, Prigge M, Berndt A, Cushman J, Polle J, Magnuson J, Hegemann P, Deisseroth K. Cell. 2011;147:1446. doi: 10.1016/j.cell.2011.12.004. [DOI] [PMC free article] [PubMed] [Google Scholar]
- 32.Weissleder R. Nat Biotechnol. 2001;19:316. doi: 10.1038/86684. [DOI] [PubMed] [Google Scholar]
- 33.Koide Y, Urano Y, Hanaoka K, Terai T, Nagano T. Acs Chemical Biology. 2011;6:600. doi: 10.1021/cb1002416. [DOI] [PubMed] [Google Scholar]
- 34.Fu MY, Xiao Y, Qian XH, Zhao DF, Xu YF. Chemical Communications. 2008:1780. doi: 10.1039/b718544h. [DOI] [PubMed] [Google Scholar]
- 35.Murugesan N, Gu Z, Stein PD, Bisaha S, Spergel S, Girotra R, Lee VG, Lloyd J, Misra RN, Schmidt J, Mathur A, Stratton L, Kelly YF, Bird E, Waldron T, Liu ECK, Zhang R, Lee H, Serafino R, Abboa-Offei B, Mathers P, Giancarli M, Seymour AA, Webb ML, Moreland S, Barrish JC, Hunt JT. Journal of Medicinal Chemistry. 1998;41:5198. doi: 10.1021/jm970872k. [DOI] [PubMed] [Google Scholar]
- 36.Pastierik T, Sebej P, Medalova J, Stacko P, Klan P. J Org Chem. 2014;79:3374. doi: 10.1021/jo500140y. [DOI] [PubMed] [Google Scholar]
- 37.Lukinavicius G, Umezawa K, Olivier N, Honigmann A, Yang GY, Plass T, Mueller V, Reymond L, Correa IR, Luo ZG, Schultz C, Lemke EA, Heppenstall P, Eggeling C, Manley S, Johnsson K. Nature Chemistry. 2013;5:132. doi: 10.1038/nchem.1546. [DOI] [PubMed] [Google Scholar]
- 38.Uno SN, Kamiya M, Yoshihara T, Sugawara K, Okabe K, Tarhan MC, Fujita H, Funatsu T, Okada Y, Tobita S, Urano Y. Nat Chem. 2014;6:681. doi: 10.1038/nchem.2002. [DOI] [PubMed] [Google Scholar]
- 39.Akerlof G, Short OA. J Am Chem Soc. 1936;58:1241. [Google Scholar]
- 40.Krasovskiy A, Knochel P. Angew Chem Int Ed Engl. 2004;43:3333. doi: 10.1002/anie.200454084. [DOI] [PubMed] [Google Scholar]
- 41.Cho CH, Kim IS, Park KY. Tetrahedron. 2004;60:4589. [Google Scholar]
- 42.Abe T, Fujimori T. Dev Growth Differ. 2013;55:390. doi: 10.1111/dgd.12062. [DOI] [PubMed] [Google Scholar]
- 43.Shen Y, Lai T, Campbell RE. Neurophotonics. 2015;2:031203. doi: 10.1117/1.NPh.2.3.031203. [DOI] [PMC free article] [PubMed] [Google Scholar]
- 44.Johnson LV, Walsh ML, Chen LB. Proc Natl Acad Sci U S A. 1980;77:990. doi: 10.1073/pnas.77.2.990. [DOI] [PMC free article] [PubMed] [Google Scholar]
- 45.Loewe H, Urbaniet J. Arzneimittel-Forschung/Drug Research. 1974;24:1927. [PubMed] [Google Scholar]
- 46.Park SA, Lee SR, Tung L, Yue DT. Sci Rep. 2014;4:6125. doi: 10.1038/srep06125. [DOI] [PMC free article] [PubMed] [Google Scholar]
- 47.Lin JY, Lin MZ, Steinbach P, Tsien RY. Biophys J. 2009;96:1803. doi: 10.1016/j.bpj.2008.11.034. [DOI] [PMC free article] [PubMed] [Google Scholar]
- 48.Zhang F, Prigge M, Beyriere F, Tsunoda SP, Mattis J, Yizhar O, Hegemann P, Deisseroth K. Nat Neurosci. 2008;11:631. doi: 10.1038/nn.2120. [DOI] [PMC free article] [PubMed] [Google Scholar]
- 49.Prigge M, Schneider F, Tsunoda SP, Shilyansky C, Wietek J, Deisseroth K, Hegemann P. J Biol Chem. 2012;287:31804. doi: 10.1074/jbc.M112.391185. [DOI] [PMC free article] [PubMed] [Google Scholar]
- 50.Klapoetke NC, Murata Y, Kim SS, Pulver SR, Birdsey-Benson A, Cho YK, Morimoto TK, Chuong AS, Carpenter EJ, Tian Z, Wang J, Xie Y, Yan Z, Zhang Y, Chow BY, Surek B, Melkonian M, Jayaraman V, Constantine-Paton M, Wong GK, Boyden ES. Nat Methods. 2014;11:338. doi: 10.1038/nmeth.2836. [DOI] [PMC free article] [PubMed] [Google Scholar]
- 51.Lin JY, Knutsen PM, Muller A, Kleinfeld D, Tsien RY. Nat Neurosci. 2013;16:1499. doi: 10.1038/nn.3502. [DOI] [PMC free article] [PubMed] [Google Scholar]
- 52.Zhang F, Wang LP, Brauner M, Liewald JF, Kay K, Watzke N, Wood PG, Bamberg E, Nagel G, Gottschalk A, Deisseroth K. Nature. 2007;446:633. doi: 10.1038/nature05744. [DOI] [PubMed] [Google Scholar]
- 53.Williams ME, Wilke SA, Daggett A, Davis E, Otto S, Ravi D, Ripley B, Bushong EA, Ellisman MH, Klein G, Ghosh A. Neuron. 2011;71:640. doi: 10.1016/j.neuron.2011.06.019. [DOI] [PMC free article] [PubMed] [Google Scholar]
- 54.Nakamura T, Yonesu K, Mizuno Y, Suzuki C, Sakata Y, Takuwa Y, Nara F, Satoh S. Bioorg Med Chem. 2007;15:3548. doi: 10.1016/j.bmc.2007.02.048. [DOI] [PubMed] [Google Scholar]
- 55.Murugesan N, Gu Z, Stein PD, Bisaha S, Spergel S, Girotra R, Lee VG, Lloyd J, Misra RN, Schmidt J, Mathur A, Stratton L, Kelly YF, Bird E, Waldron T, Liu EC, Zhang R, Lee H, Serafino R, Abboa-Offei B, Mathers P, Giancarli M, Seymour AA, Webb ML, Hunt JT, et al. J Med Chem. 1998;41:5198. doi: 10.1021/jm970872k. [DOI] [PubMed] [Google Scholar]
- 56.Magde D, Brannon JH, Cremers TL, Olmsted J. Journal of Physical Chemistry. 1979;83:696. [Google Scholar]
Associated Data
This section collects any data citations, data availability statements, or supplementary materials included in this article.


