Abstract
Purpose
To assess reproducibility in measuring left ventricular (LV) myocardial stiffness in volunteers throughout the cardiac cycle using magnetic resonance elastography (MRE) and to determine its correlation with age.
Methods
Cardiac MRE (CMRE) was performed on 29 normal volunteers, with ages ranging from 21 to 73 years. For assessing reproducibility of CMRE-derived stiffness measurements, scans were repeated per volunteer. Wave images were acquired throughout the LV myocardium, and were analyzed to obtain mean stiffness during the cardiac cycle. CMRE-derived stiffness values were correlated to age.
Results
Concordance correlation coefficient revealed good inter-scan agreement with rc of 0.77, with p-value<0.0001. Significantly higher myocardial stiffness was observed during end-systole (ES) compared to end-diastole (ED) across all subjects. Additionally, increased deviation between ES and ED stiffness was observed with increased age.
Conclusion
CMRE-derived stiffness is reproducible, with myocardial stiffness changing cyclically across the cardiac cycle. Stiffness is significantly higher during ES compared to ED. With age, ES myocardial stiffness increases more than ED, giving rise to an increased deviation between the two.
Keywords: Myocardial Stiffness, Magnetic Resonance Elastography, MR Elastography, MRE, Cardiac MRE
Introduction
In the United States, heart failure accounts for 40–70% of reported deaths (1, 2). While increasing with age, left ventricular (LV) stiffness is considered a significant contributing factor to heart failure (3–5). Therefore, early detection of abnormal myocardial stiffness in patients of all ages may aid in the understanding and management of heart failure.
Currently, invasive catheter-based pressure-volume techniques are the standard clinical method for measuring LV chamber stiffness. These techniques require technical precision and provide only global estimates, rather than true intrinsic properties of the myocardium (3, 5–7).
There are multiple non-invasive methods to study myocardial deformation (strain), including echocardiographic strain imaging (8), magnetic resonance imaging (MRI) myocardial tagging (9), and MRI phase-contrast techniques that measure deformation over a cardiac cycle, such as displacement encoding with stimulated echoes (DENSE) (10) and strain encoding (SENC) (11). However, because there is no non-invasive way to measure stress, these non-invasive measures of strain provide a very incomplete measure of cardiac mechanics.
Magnetic resonance elastography (MRE) is a novel non-invasive MRI technique allowing spatial estimation of shear stiffness of soft tissues (12, 13). In MRE, external vibrations are applied to the body, and shear wave images are produced based on a phase-contrast imaging technique that uses directionally sensitive motion encoding gradients (MEGs) synchronized to external vibrations. These measured wave images are subsequently inverted to produce stiffness maps.
Cardiac magnetic resonance elastography (CMRE) (14–16) was recently described and has been used to study differences in myocardial stiffness across the cardiac cycle in animal models (15, 17–19), as well as in humans (14, 20–25). To date, CMRE-derived myocardial stiffness maps have assumed the LV myocardium to be elastic (18), isotropic (15, 18, 19) and infinite (18, 24), in order to simplify the equation of motion for estimating effective stiffness. However, none of the earlier studies have established normal effective LV stiffness values in volunteers as a function of age.
The goals of this study were to: 1. apply CMRE repetitively to human volunteers to confirm inter-scan reproducibility of myocardial stiffness measurements; 2. evaluate variations of LV myocardial stiffness over the cardiac cycle using CMRE; and 3. assess age-dependent differences in CMRE-determined myocardial stiffness.
Methods
Prior to this study, approval from the Institutional Review Board was obtained. With informed consent from subjects, CMRE and conventional cardiac MRI were successfully performed on 29 healthy volunteers (11 female, 18 male), evenly distributed in age from 21 to 73 years (average 39.9±15.3 years). Volunteers were screened and considered healthy, by reviewing their medical history and excluding the subjects from the study if any major health issue was discovered. The exclusion criteria included any type of cardiac disease, hypertension, as well as lifestyle choices e.g. a history of smoking and excessive alcohol consumption.
Image Acquisition
Imaging was performed using a clinical 1.5T MRI system (Magnetom Avanto, Siemens Healthcare, Erlangen, Germany), with a 32-element phased-array cardiac receive coil. The subjects were positioned head-first supine in the scanner. Peripheral, retrospective gating was used for acquiring CMRE/MRI images.
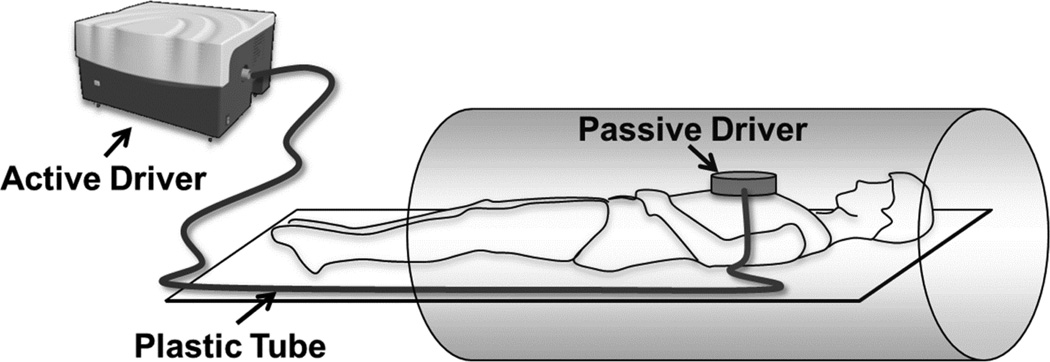
Mechanical waves were introduced into the heart using a pneumatic driver system (Resoundant, Rochester, MN, USA). This system consists of two parts: a remote, acoustic component acting as the active driver, and a passive component which is placed on the sternum of the subject. The passive driver is connected to the active portion through a rigid plastic tube of specified length to send 80 Hz vibrations into the heart as shown in Figure 1.
Figure 1.
Schematic of the MRE driver setup. Acoustic waves are transmitted from the active to the passive driver through a plastic tube to induce noninvasive vibrations into the myocardium.
Balanced steady-state free precession (bSSFP) sequences were performed to acquire scout images of vertical and horizontal long-axis views covering the heart. A retrospectively cardiac gated, multi-phase gradient recalled echo (GRE) MRE sequence was developed (15, 18, 19, 26) and used to obtain five short-axis slices covering the LV. CMRE imaging parameters were as follows: repetition time (TR)=12.5 ms, echo time (TE)=8.7 ms, field of view (FOV)=400×400 mm2acquisition matrix=256×64, slice thickness=10 mm, flip angle=25°, generalized autocalibrating partially parallel acquisition (GRAPPA) acceleration factor=2 with 16 reference lines collected in the same scan, 8 cardiac phases, and 8 segments (positive and negative motion encodings). Flow-compensated motion-encoding gradients (MEG) of 160 Hz (period of 6.25 ms) were applied separately in the x, y, and z directions to encode all directions of external motion in the tissue. The motion sensitivity from 160 Hz MEG is 1.2 radians per 100µm of displacement compared to 5.6 radians per 100µm of displacement for an 80 Hz MEG matched to the external vibration frequency. Four MRE time offsets were collected to obtain wave propagation. Each acquisition was performed in a separate end-expiration breath-hold ranging from 18–24 seconds depending on the heart rate. For all 5 slices and 3 encoding directions (i.e. x, y, z) a total of 15 breathholds were performed. To complete one exam of CMRE component, an average of 5 minutes were required.
To study reproducibility, each volunteer was asked to step out of the scanner room and then return for passive driver repositioning for a second scan with all imaging parameters remaining the same. Additionally, reproducibility study was also performed in 10 randomly selected volunteers who were scanned on day 1 and day 3 with same imaging parameters.
Image Analysis
The acquired short-axis CMRE images in all volunteers were traced with epicardial and endocardial contours to segment the LV myocardium. Visual inspection was used to screen datasets for appropriate levels of image quality (i.e. phase contrast). Individual results for each volunteer were evaluated and any non-diagnostic images due to flow, or breathing artifacts from inadequate breath-holding, were not considered for analysis. Only in two cases the data were excluded due to lack of appropriate phase-contrast image quality.
Conventional MRI images were analyzed off-line on an advanced post-processing workstation (Leonardo, Siemens Healthcare, Erlangen, Germany). The LV cavity was manually traced in all cardiac phases, with trabeculations and papillary muscles included in the blood pool. LV volumes and mass were calculated using a modified Simpson’s method (27). End-diastolic and end-systolic volumes were used to calculate ejection fraction and cardiac output.
The CMRE wave images were analyzed using a 2D and 3D local frequency estimation (LFE) (28) inversion algorithm to determine shear stiffness, using MRE-Lab (Mayo Clinic, Rochester, MN, USA). First, wave images were directionally filtered (29) in 8 directions to remove reflected waves, and band-pass filtered (0.4m (1 Wave/FOV) to 0.01m (40 Waves/FOV) as cutoffs) to remove longitudinal waves. Then, a temporal Fourier transform was performed to obtain the first harmonic displacement field in each encoding direction. Next, the first harmonic components of the displacement fields were processed to obtain the weighted stiffness map. Weighting in each orthogonal direction was calculated by performing ratio of square of first harmonic amplitude in that particular direction to the sum of squares of amplitudes in all orthogonal directions. Finally, the weighted stiffness map was obtained by sum of the weights in each direction multiplied by stiffness maps in that corresponding direction. Finally, an erosion operation was performed to remove edge errors in the stiffness maps stemming from the inversion, by removing three pixels around the boundaries of the regions of interest. Means and standard deviations of the effective shear stiffness were automatically calculated and reported using Matlab (Mathworks, Natick, MA, USA) for the center slice, and compared between cardiac phases and subjects. The images with smallest and largest LV cavity were used to identify end-systole (ES) and end-diastole (ED) for reporting respective stiffness values.
Statistical Analysis
Reproducibility of the CMRE technique was evaluated by the concordance correlation coefficient rc (30) using STATA13 (StataCorp LP, College Station, TX, USA). A paired Student’s t-test was performed to determine the significance in difference between ES and ED stiffness measurements in the overall study population and also between 2D and 3D LFE stiffness measurements. Additionally, similar to an earlier study (31), a linear regression model was used to determine a correlation between myocardial stiffness and age in general, as well as separately between ES stiffness and ED stiffness and age. Furthermore, a linear regression model was performed to determine correlation between 2D and 3D LFE shear stiffness measurements. Data were analyzed using Minitab 16 (Minitab Inc., State College, PA, USA).
Results
Cardiac Function
During imaging, the heart rates of the 29 subjects ranged from 52–79 beats per minute, with an average of 65.5±8.2. LV mass was in a normal range (77.3–174.6 g) (32), with an average of 115.7±26.7 g. Average ejection fractions (57.8±6.3%), and average cardiac output (4.0±0.8 L/min) for all subjects were also normal.
2D vs 3D LFE Shear Stiffness Measurements
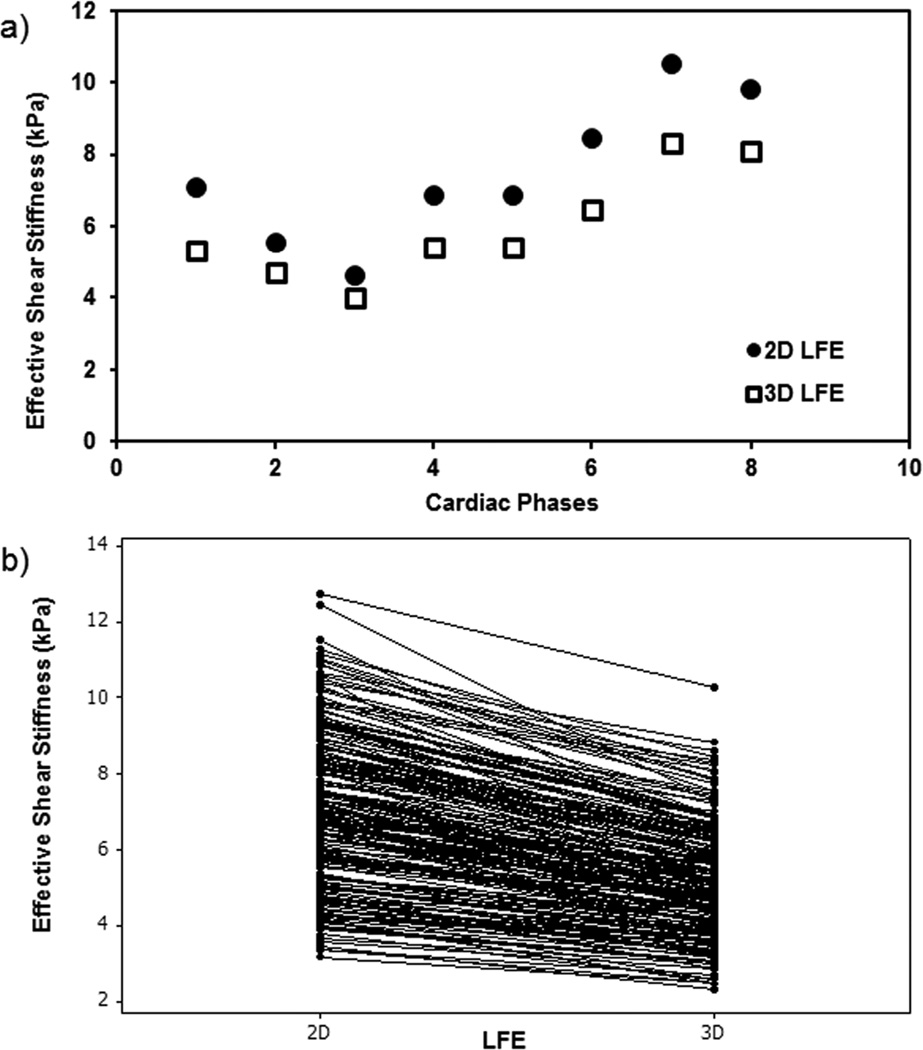
2D LFE stiffness measurements were systematically and significantly higher than the 3D LFE measurements. Figure 2a shows an example in one of the volunteers where 2D LFE stiffness measurements were higher than 3D LFE measurements while preserving the cyclic trend across the cardiac cycle. Figure 2b shows that 2D LFE shear stiffness measurements were significantly higher (p<0.0001) than 3D LFE measurements and also 2D LFE showed a systematic linear increase in shear stiffness measurements compared to 3D LFE with a significant (p<0.0001) correlation of r = 0.91. Therefore, all other results presented in this manuscript are based on 3D LFE inversion.
Figure 2.
Left ventricular myocardial shear stiffness measurements obtained using 2D and 3D LFE inversion. a) Shows cyclic variation of stiffness measurements using 2D and 3D LFE in one of the volunteers. b) Plot shows that 2D LFE measurements are significantly higher than 3D LFE measurements.
CMRE Reproducibility
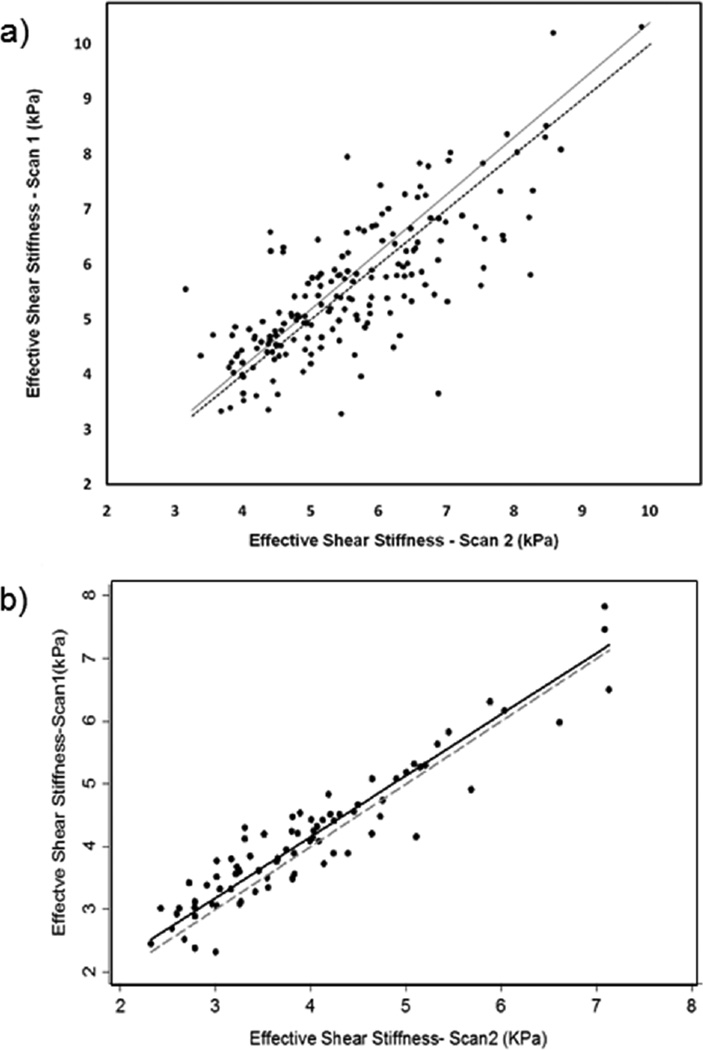
Good agreement in myocardial stiffness measurements was found between repetitive scans within the same volunteer. A concordance plot for all repeat measurements performed on the same day is shown in Figure 3a, which demonstrates good inter-scan reproducibility, with a concordance correlation coefficient rc=0.77 (p<0.0001) and narrow confidence interval (95%: 0.71–0.83). Furthermore, a concordance plot for all repeat measurements performed on different days (i.e. day 1 and 3) is shown in Figure 3b, which demonstrates good inter-scan reproducibility in a small sample size (10 volunteers), with a concordance correlation coefficient of rc=0.93 (p<0.0001) and narrow confidence interval (95%: 0.90–0.96).
Figure 3.
Concordance plot demonstrating the correlation of stiffness measurements between inter-scans. a) Concordance correlation coefficient rc=0.77 with p<0.0001 and narrow confidence interval (95%: 0.71–0.83) when performed on same day. b) Concordance correlation coefficient rc=0.93 with p<0.0001 and narrow confidence interval (95%: 0.90–0.86) when performed on separate days (day 1 and 3). Solid: regression line; dotted: line of perfect concordance.
CMRE-derived ES vs. ED Stiffness
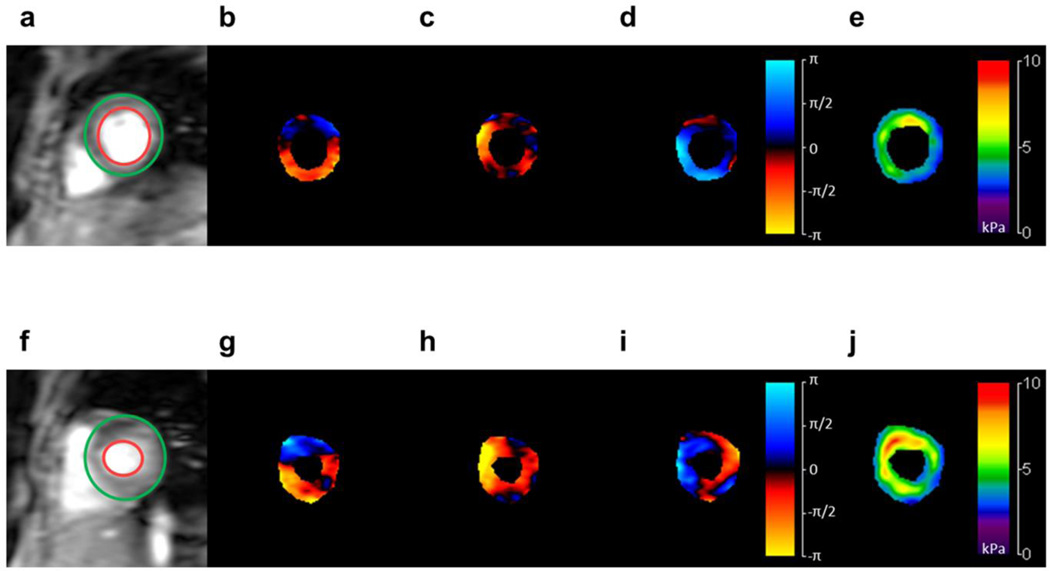
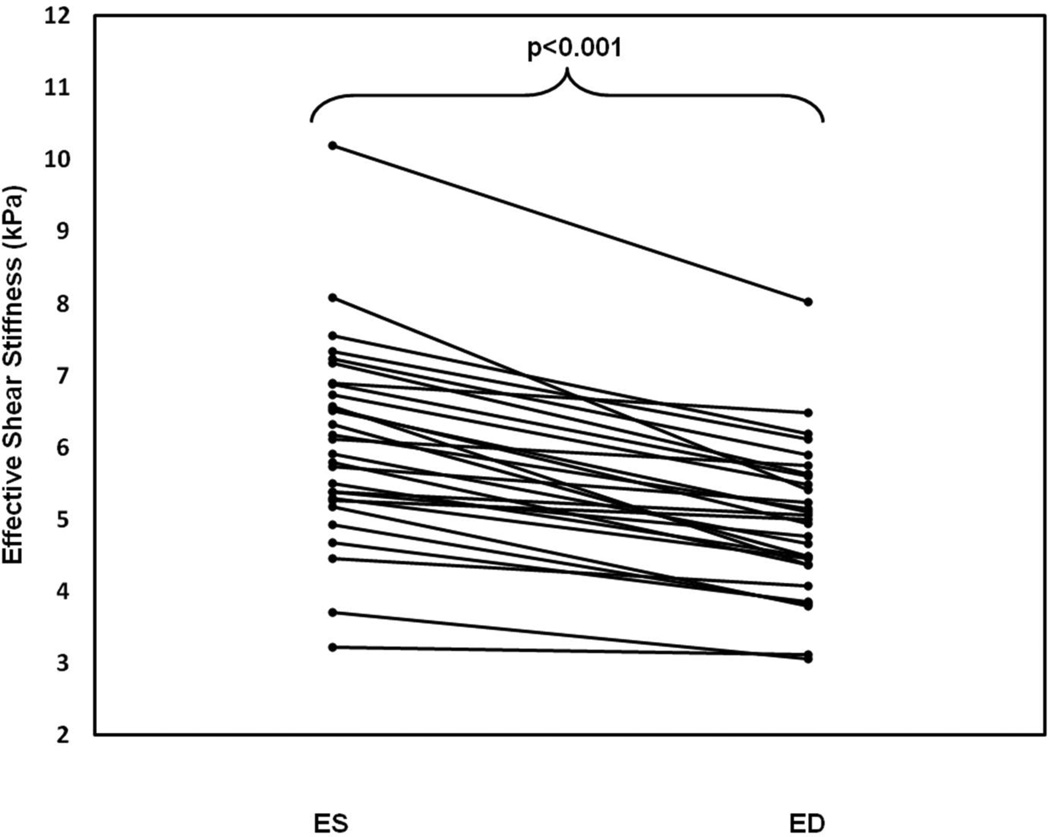
ES myocardial stiffness was significantly higher than ED stiffness. Figure 4 shows stiffness values and corresponding wave images during ED and ES (top and bottom respectively). Mean values across the population were measured to be 6.10±1.38 kPa for ES, and 4.99±1.05 kPa for ED, as shown in Figure 5, representing a significant difference (p<0.0001).
Figure 4.
Short axis magnitude images of the LV myocardium (a, f), and snapshots of waves traveling in the three orthogonal planes (b–d, g–i), during ED (top) and ES (bottom) respectively. CMRE-derived stiffness maps are shown on the right (e,j). Increased stiffness is visible during ES compared to ED. Colorbar: displacement field in radians; stiffness map in kPa.
Figure 5.
Plot of CMRE-derived stiffness values during ES and ED. Mean ES stiffness (6.10±1.38 kPa) in all volunteers was significantly higher than ED stiffness (4.99±1.05 kPa).
CMRE-derived Stiffness over Cardiac Cycle
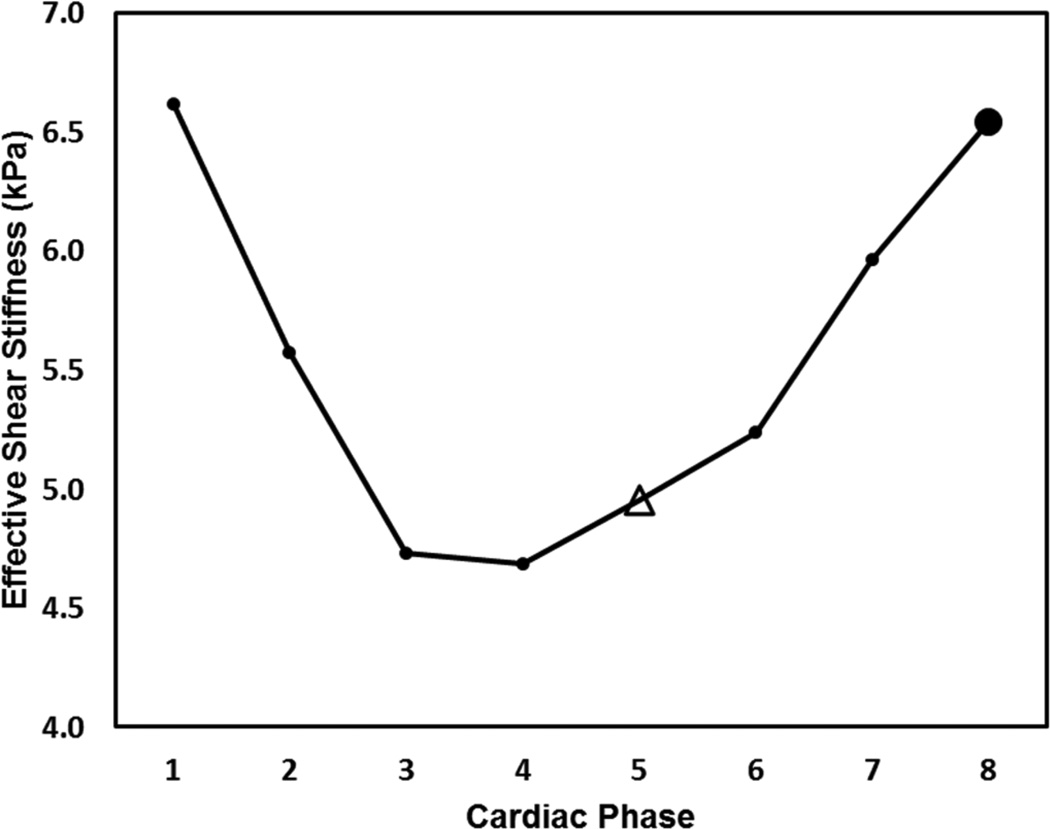
Cyclic variation of CMRE-derived myocardial stiffness was observed throughout the cardiac cycle. Figure 6 shows an example in one of the volunteers, with a higher mean myocardial effective stiffness measured at ES than at ED.
Figure 6.
Plot shows cyclic variation of CMRE-derived LV stiffness over the cardiac cycle in a 71 year-old female volunteer. ED is marked as an open triangle, ES as a solid circle.
CMRE-derived Stiffness vs. Age
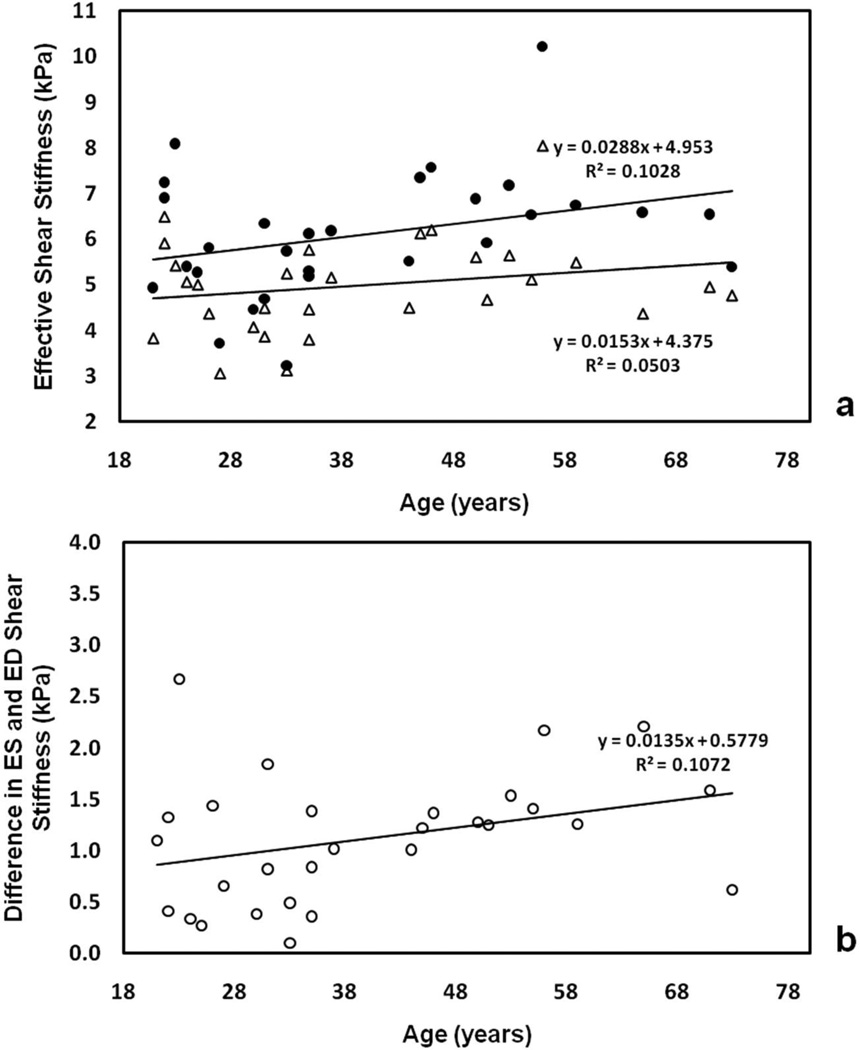
While no significant correlations between age and CMRE-derived stiffness at either ES (p=0.18) or ED (p=0.24) were observed increasing deviation between ES and ED stiffness (i.e. difference in ES and ED stiffness) was observed with a linear correlation(r=0.33, p=0.08). Figure 7 shows ES and ED stiffness as a function of age (a), as well as the within-subject difference between the two (b). It was observed that the separation between ES and ED stiffness increased approximately 0.014 kPa per year, with a mean separation of 1.12±0.63 kPa.
Figure 7.
Plot of CMRE-derived ES stiffness (solid circles) and ED stiffness (open triangles) in all volunteers as a function of age (a), and difference in ES/ED stiffness as a function of age (b).
Discussion
Overall Summary
This study has demonstrated that CMRE is a reproducible technique to estimate myocardial stiffness, and displays cyclic variation across the cardiac cycle in all volunteers with significantly higher stiffness during ES compared to ED. A weak linear correlation was observed between stiffness and age, as well as increasing deviation between ES and ED stiffness with age. This study is the first of its kind to establish noninvasive normal stiffness values in LV myocardium, and has laid a foundation for establishing normal stiffness values in volunteers across age groups.
2D vs 3D LFE Shear Stiffness Measurements
As described earlier, the wave propagation in the LV is not planar and is oblique (18); thereby necessitating 3D data to estimate the shear stiffness of the LV myocardium. The oblique wave propagation in the LV myocardium causes 2D inversion to overestimate the wavelength and thus causing stiffness values to be considerably higher than 3D stiffness measurements as shown in Figure 2; this has been previously demonstrated by Yin et al. (33) in estimating liver stiffness. Furthermore, in MRE, shear waves are of primary interest and therefore longitudinal waves should be removed when processing the data. Applying curl would eliminate longitudinal waves, which would work very effectively in 3D isotropic data with many slices. However, since our data is not isotropic and consists of few slices, we chose instead to apply Butterworth bandpass filter to remove the longitudinal waves, as implemented in earlier studies (18, 34, 35). Additionally, the filter cutoff’s for bandpass filter for cardiac application were chosen based on the previous work (18). However, our future studies will involve developing 3D isotropic acquisition techniques under free breathing, which would enable us applying curl to remove longitudinal waves.
CMRE Reproducibility
This study demonstrated good reproducibility of the CMRE technique to estimate myocardial stiffness between repeat scans within the same volunteer. The variation in stiffness estimates between the two scans is within the acceptable range associated with physiological change, such as variations in heart rate. Minor differences in heart rate between repeat scans in a volunteer will have slight variation in stiffness during systolic phases because of lower temporal resolution in our CMRE sequence.
CMRE-derived Stiffness over Cardiac Cycle
Our findings demonstrated cyclic behavior of LV myocardial stiffness throughout the cardiac cycle, with significantly higher stiffness measured at ES compared to ED. This cyclic variation fits within the framework of changing mechanical properties of contracting myocardium, and changing intra-ventricular pressure – the foundation of pressure-volume based measurements. During the systolic phase, an increase in intra-ventricular pressure causes LV to contract, thereby increasing stiffness. Similarly, the pressure drops during diastole, allowing the LV to relax, thereby decreasing the stiffness for refilling with blood. Our findings are consistent with invasive catheter-based measurements of stiffness and previous reports in animal models (15, 17, 20, 36). Also earlier studies by Elgeti, et al. (17, 20, 21) confirmed that ES stiffness is significantly higher than ED stiffness.
CMRE-derived Stiffness vs. Age
A weak linear correlation was observed between CMRE-derived stiffness and age. A previous study on contractility by Merino, et al. (37), described a decrease in systolic function in older subjects compared to younger ones. At the same time, a study by Villari, et al. found that LV diastolic function is more impaired in elderly patients, while systolic function is preserved, in a population with aortic stenosis (31). These and other studies with different patient populations have shown no consistent relationship of ED/ES stiffness to age (38, 39). Interestingly, in our study an increase in deviation between ES and ED stiffness was observed with increasing age. We believe this is because the systolic stiffness increases more than the diastolic stiffness, which is due to the heart having to work harder because of increase in afterload during systole associated with changes in aortic compliance with increasing age(35). Furthermore, Elgeti, et al. (21) showed no correlation of CMRE-derived displacements (i.e. stiffness) to age which agrees with our results.
Viscoelasticity
The current inversion technique (i.e. LFE) used in our study assumes that waves are propagating in a purely elastic material, while myocardium is actually viscoelastic in nature. Viscoelasticity refers to materials exhibiting both viscous (ability to absorb energy) and elastic properties when subjected to stress; these properties are frequency dependent. It is possible to report complex modulus using direct inversion (DI), where the real part refers to storage modulus (elastic component) and the imaginary part refers to loss modulus (viscous component). However, with DI more sensitive to image noise present compared to LFE (28) (observed in our preliminary analysis of a few samples), we have performed LFE to estimate only storage modulus (i.e. ‘shear stiffness’), our primary interest in this study. Our future studies will incorporate inversion technique (40) that estimate viscoelastic properties of the heart.
Comparison to Previous Studies
Our results cannot be easily compared to previous volunteer studies. Elgeti, et al. have reported first harmonic amplitudes of the displacement field in a single-slice instead of spatial stiffness maps (14, 17, 20–23, 41). Additionally, they have applied different mechanical frequencies compared to that used in this study. However, Elgeti, et al had demonstrated that ES stiffness (based on shear wave amplitudes) is significantly higher than ED and showed a good correlation of stiffness to pressure with no significant correlation of stiffness to age. Overall, our results agree with the results shown by Elgeti, et al. This study is first to demonstrate application of 3D inversion in normal volunteers to establish normal stiffness values in volunteers for comparison against cardiac disease states that would alter myocardial stiffness.
Limitations
There are a few limitations in our study. First, LV is considered to be isotropic in the inversion. However, LV myocardium is known to be anisotropic and the current spatial resolution in our experiments using current methodology does not allow us to estimate anisotropic stiffness; unless we perform waveguide MRE (i.e. Diffusion tensor imaging and MRE) to resolve fiber direction with high spatial resolution to obtain anisotropic stiffness. Second, the inversion also assumes that the LV is purely elastic to estimate effective shear stiffness. As mentioned above, LV is always viscoelastic and other inversion such as DI can report both shear and loss modulus, but is very sensitive to noise compared to LFE. Additionally, earlier studies have used LFE (assuming purely elastic media) to estimate the stiffness of liver (34), brain (42), breast (43), and aorta (35) because of its insensitivity to noise, despite them being viscoelastic similar to that applied in the LV in this study. Third, the geometry of the heart is not taken into account in inversion. Shear waves propagate in a complex pattern through the LV myocardium (i.e. neither parallel nor transverse to fibers) due to: 1. the heart’s inherently complex geometry, with time-dependent shape changes; 2. changing myocardial stiffness over the cardiac cycle; and 3. influence of variable positioning of the vibration source. This affords LFE a distinct advantage in quantitating effective shear stiffness of the myocardium. However, to study the effect of LFE on geometry, finite element modeling (FEM) was performed in a viscoelastic spherical shell phantom with varying diameter and thickness as described elsewhere (18) with varying input stiffness estimates (1–20kPa) to generate displacement field at 80Hz. It was observed that LFE produced robust stiffness estimates up to thickness of ~1cm (Figure S1: Supporting material). At 0.5cm thickness the stiffness measurements started to deviate from true value when the input stiffness values were ~>10kPa (results shown as supplemental material). In the current study, only 2 volunteers had thickness of 0.6cm and 0.7cm during ED which is near 0.5cm. However, in general the stiffness measurements in our study are far below 10kPa to have any significant variation in stiffness estimates when using LFE even in these two volunteers. Hence, for all the above reasons the reported stiffness values are not absolute but termed “effective”. Fourth, only the center slice was used to report the effective stiffness measurements in order to avoid the effects stemming from the lognormal filters being used in the LFE algorithm. Finally, variation in blood pressure (not obtained during scan) between repeat scans is not accounted for in understanding the variation in stiffness. However, extensive medical screening was performed, which included excluding subjects with a history of hypertension. Furthermore, any variation in heart rate between repeat scans in a volunteer will have slight variation in stiffness during systolic phases because of lower temporal resolution in our CMRE sequence. Despite these limitations we have observed 1) relative robustness of our technique; 2) cyclic variation of stiffness throughout the cardiac cycle; and 3) stiffer myocardium during ES compared to ED, consistent with previously reported results.
Future work should include developing an inversion algorithm that could incorporate geometry of the LV and viscoelastic behavior and anisotropy to report absolute stiffness. Additionally, the development of a 3D-CMRE sequence that acquires all components of the displacement field in 3 breath-holds using advanced parallel imaging strategies in contrast to the current 2D sequence which requires 15 breath-holds for 5 slices is sought. Furthermore, it would be of interest to study different cardiac disease states, such as systolic and diastolic heart failure, using CMRE-derived stiffness measurements and compare it against established normal values reported in this study.
In conclusion, it was found that cyclic stiffness changes are observed in the human heart during the cardiac cycle with significantly higher ES stiffness compared to ED. While a diverging trend between ES and ED stiffness is seen as a function of age, future studies are warranted to further study age-related stiffness in specific populations. This study is first of its kind to establish normal stiffness values of the LV myocardium for ED and ES phases.
Supplementary Material
Acknowledgements
The authors acknowledge Siemens Healthcare for their support. Funding was received from the American Heart Association: 13SDG14690027, National Institute of Health-NHLBI: R01HL24096 and Center for Clinical & Translational Sciences: UL1TR000090.
References
- 1.Murphy SL, Xu J, Kochanek KD. Deaths: Final Data for 2010. National Vital Statistics Reports. 2013;61(4):1–118. [PubMed] [Google Scholar]
- 2.The World Health Report 2004 - Changing history. Journal of Advanced Nursing. 2004;48(5):542. [Google Scholar]
- 3.Burkhoff D, Mirsky I, Suga H. Assessment of systolic and diastolic ventricular properties via pressure-volume analysis: a guide for clinical, translational, and basic researchers. Am J Physiol Heart Circ Physiol. 2005;289(2):H501–H512. doi: 10.1152/ajpheart.00138.2005. [DOI] [PubMed] [Google Scholar]
- 4.Mirsky I, Cohn PF, Levine JA, Gorlin R, Herman MV, Kreulen TH, Sonnenblick EH. Assessment of left ventricular stiffness in primary myocardial disease and coronary artery disease. Circulation. 1974;50(1):128–136. doi: 10.1161/01.cir.50.1.128. [DOI] [PubMed] [Google Scholar]
- 5.Zile MR, Baicu CF, Gaasch WH. Diastolic heart failure--abnormalities in active relaxation and passive stiffness of the left ventricle. N Engl J Med. 2004;350(19):1953–1959. doi: 10.1056/NEJMoa032566. [DOI] [PubMed] [Google Scholar]
- 6.Mirsky I, Pasipoularides A. Clinical assessment of diastolic function. Prog Cardiovasc Dis. 1990;32(4):291–318. doi: 10.1016/0033-0620(90)90018-w. [DOI] [PubMed] [Google Scholar]
- 7.Mirsky I, Rankin JS. The effects of geometry, elasticity, and external pressures on the diastolic pressure-volume and stiffness-stress relations. How important is the pericardium? Circ Res. 1979;44(5):601–611. doi: 10.1161/01.res.44.5.601. [DOI] [PubMed] [Google Scholar]
- 8.Perk G, Kronzon I. Non-Doppler two dimensional strain imaging for evaluation of coronary artery disease. Echocardiography (Mount Kisco, NY) 2009;26(3):299–306. doi: 10.1111/j.1540-8175.2008.00863.x. [DOI] [PubMed] [Google Scholar]
- 9.Zerhouni EA, Parish DM, Rogers WJ, Yang A, Shapiro EP. Human heart: tagging with MR imaging--a method for noninvasive assessment of myocardial motion. Radiology. 1988;169(1):59–63. doi: 10.1148/radiology.169.1.3420283. [DOI] [PubMed] [Google Scholar]
- 10.Aletras AH, Ding S, Balaban RS, Wen H. DENSE: displacement encoding with stimulated echoes in cardiac functional MRI. J Magn Reson. 1999;137(1):247–252. doi: 10.1006/jmre.1998.1676. [DOI] [PMC free article] [PubMed] [Google Scholar]
- 11.Pan L, Stuber M, Kraitchman DL, Fritzges DL, Gilson WD, Osman NF. Real-time imaging of regional myocardial function using fast-SENC. Magn Reson Med. 2006;55(2):386–395. doi: 10.1002/mrm.20770. [DOI] [PubMed] [Google Scholar]
- 12.Muthupillai R, Lomas DJ, Rossman PJ, Greenleaf JF, Manduca A, Ehman RL. Magnetic resonance elastography by direct visualization of propagating acoustic strain waves. Science (New York, NY) 1995;269(5232):1854–1857. doi: 10.1126/science.7569924. [DOI] [PubMed] [Google Scholar]
- 13.Rouviere O, Yin M, Dresner MA, Rossman PJ, Burgart LJ, Fidler JL, Ehman RL. MR elastography of the liver: preliminary results. Radiology. 2006;240(2):440–448. doi: 10.1148/radiol.2402050606. [DOI] [PubMed] [Google Scholar]
- 14.Elgeti T, Beling M, Hamm B, Braun J, Sack I. Cardiac Magnetic Resonance Elastography: Toward the Diagnosis of Abnormal Myocardial Relaxation. Invest Radiol. 2010;45(12):782–787. doi: 10.1097/RLI.0b013e3181ec4b63. [DOI] [PubMed] [Google Scholar]
- 15.Kolipaka A, Araoz PA, McGee KP, Manduca A, Ehman RL. Magnetic resonance elastography as a method for the assessment of effective myocardial stiffness throughout the cardiac cycle. Magn Reson Med. 2010;64:862–870. doi: 10.1002/mrm.22467. [DOI] [PMC free article] [PubMed] [Google Scholar]
- 16.Sinkus R, Robert B, Gennisson J-L, Tanter M, Fink M. Single Breath Hold Transient MR-Elastography of the Heart - Imaging Pulsed Shear Wave Propagation Induced by Aortic Valve Closure. 2006; Seattle, USA; Proceedings of the 14th Annual Meeting of ISMRM; p. 77. [Google Scholar]
- 17.Elgeti T, Laule M, Kaufels N, Schnorr J, Hamm B, Samani A, Braun J, Sack I. Cardiac MR elastography: comparison with left ventricular pressure measurement. J Cardiovasc Magn Reson. 2009;11:44. doi: 10.1186/1532-429X-11-44. [DOI] [PMC free article] [PubMed] [Google Scholar]
- 18.Kolipaka A, Aggarwal SR, McGee KP, Anavekar N, Manduca A, Ehman RL, Araoz PA. Magnetic resonance elastography as a method to estimate myocardial contractility. J Magn Reson Imaging. 2012;36(1):120–127. doi: 10.1002/jmri.23616. [DOI] [PMC free article] [PubMed] [Google Scholar]
- 19.Kolipaka A, McGee KP, Manduca A, Anavekar N, Ehman RL, Araoz PA. In vivo assessment of MR elastography-derived effective end-diastolic myocardial stiffness under different loading conditions. J Magn Reson Imaging. 2011;33(5):1224–1228. doi: 10.1002/jmri.22531. [DOI] [PMC free article] [PubMed] [Google Scholar]
- 20.Elgeti T, Beling M, Hamm B, Braun J, Sack I. Elasticity-based determination of isovolumetric phases in the human heart. J Cardiovasc Magn Reson. 2010;12(1):60–68. doi: 10.1186/1532-429X-12-60. [DOI] [PMC free article] [PubMed] [Google Scholar]
- 21.Elgeti T, Knebel F, Hattasch R, Hamm B, Braun J, Sack I. Shear-wave Amplitudes Measured with Cardiac MR Elastography for Diagnosis of Diastolic Dysfunction. Radiology. 2014;271(3):681–687. doi: 10.1148/radiol.13131605. [DOI] [PubMed] [Google Scholar]
- 22.Elgeti T, Rump J, Hamhaber U, Papazoglou S, Hamm B, Braun J, Sack I. Cardiac magnetic resonance elastography. Initial results. Invest Radiol. 2008;43(11):762–772. doi: 10.1097/RLI.0b013e3181822085. [DOI] [PubMed] [Google Scholar]
- 23.Elgeti T, Tzschatzsch H, Hirsch S, Krefting D, Klatt D, Niendorf T, Braun J, Sack I. Vibration-synchronized magnetic resonance imaging for the detection of myocardial elasticity changes. Magn Reson Med. 2012;67(4):919–924. doi: 10.1002/mrm.24185. [DOI] [PubMed] [Google Scholar]
- 24.Kolipaka A, Araoz PA, McGee KP, Manduca A, Ehman RL. In Vivo Cardiac MR Elastography in a Single Breath Hold. Stockholm, Sweden: 2010. p. 591. [Google Scholar]
- 25.Kolipaka A, McGee KP, Aggarwal SR, Chen Q, Anavekar NS, Manduca A, Ehman RL, Araoz PA. MR Elastography as a Method to Compare Stiffness Estimates in Hypertrophic Cardiomyopathy and in Normal Volunteers. Montreal, Canada: 2011. p. 274. [Google Scholar]
- 26.Kolipaka A, McGee KP, Araoz PA, Glaser KJ, Manduca A, Ehman RL. Evaluation of a rapid, multiphase MRE sequence in a heart-simulating phantom. Magn Reson Med. 2009;62(3):691–698. doi: 10.1002/mrm.22048. [DOI] [PMC free article] [PubMed] [Google Scholar]
- 27.Folland ED, Parisi AF, Moynihan PF, Jones DR, Feldman CL, Tow DE. Assessment of left ventricular ejection fraction and volumes by real-time, two-dimensional echocardiography. A comparison of cineangiographic and radionuclide techniques. Circulation. 1979;60(4):760–766. doi: 10.1161/01.cir.60.4.760. [DOI] [PubMed] [Google Scholar]
- 28.Manduca A, Oliphant TE, Dresner MA, Mahowald JL, Kruse SA, Amromin E, Felmlee JP, Greenleaf JF, Ehman RL. Magnetic resonance elastography: non-invasive mapping of tissue elasticity. Med Image Anal. 2001;5(4):237–254. doi: 10.1016/s1361-8415(00)00039-6. [DOI] [PubMed] [Google Scholar]
- 29.Manduca A, Lake DS, Kruse SA, Ehman RL. Spatio-temporal directional filtering for improved inversion of MR elastography images. Med Image Anal. 2003;7(4):465–473. doi: 10.1016/s1361-8415(03)00038-0. [DOI] [PubMed] [Google Scholar]
- 30.Lin LI. A concordance correlation coefficient to evaluate reproducibility. Biometrics. 1989;45(1):255–268. [PubMed] [Google Scholar]
- 31.Villari B, Vassalli G, Schneider J, Chiariello M, Hess OM. Age dependency of left ventricular diastolic function in pressure overload hypertrophy. J Am Coll Cardiol. 1997;29(1):181–186. doi: 10.1016/s0735-1097(96)00440-8. [DOI] [PubMed] [Google Scholar]
- 32.Lang RM, Bierig M, Devereux RB, Flachskampf FA, Foster E, Pellikka PA, Picard MH, Roman MJ, Seward J, Shanewise J, Solomon S, Spencer KT, St John Sutton M, Stewart W. Recommendations for chamber quantification. Eur J Echocardiogr. 2006;7(2):79–108. doi: 10.1016/j.euje.2005.12.014. [DOI] [PubMed] [Google Scholar]
- 33.Yin M, Manduca A, Romano AJ, Glaser KJ, Drapaca CS, Lake DS, Ehman RL. 3-D Local Frequency Estimation Inversion for Abdominal MR Elastography. 2007; Berlin, Germany; Proceedings of the 15th Annual Meeting of ISMRM; p. 960. [Google Scholar]
- 34.Yin M, Talwalkar JA, Glaser KJ, Manduca A, Grimm RC, Rossman PJ, Fidler JL, Ehman RL. Assessment of hepatic fibrosis with magnetic resonance elastography. Clinical Gastroenterology and Hepatology. 2007;5(10):1207–1213. e1202. doi: 10.1016/j.cgh.2007.06.012. [DOI] [PMC free article] [PubMed] [Google Scholar]
- 35.Damughatla AR, Raterman B, Sharkey-Toppen T, Jin N, Simonetti OP, White RD, Kolipaka A. Quantification of Aortic Stiffness Using MR Elastography and its Comparison to MRI-Based Pulse Wave Velocity. J Magn Reson Imaging. 2015;41(1):44–51. doi: 10.1002/jmri.24506. [DOI] [PMC free article] [PubMed] [Google Scholar]
- 36.Diamond G, Forrester JS, Hargis J, Parmley WW, Danzig R, Swan HJ. Diastolic pressure-volume relationship in the canine left ventricle. Circ Res. 1971;29(3):267–275. doi: 10.1161/01.res.29.3.267. [DOI] [PubMed] [Google Scholar]
- 37.Merino A, Alegria E, Castello R, Martinez-Caro D. Influence of age on left ventricular contractility. Am J Cardiol. 1988;62(16):1103–1108. doi: 10.1016/0002-9149(88)90557-7. [DOI] [PubMed] [Google Scholar]
- 38.Pearson AC, Gudipati CV, Labovitz AJ. Effects of aging on left ventricular structure and function. Am Heart J. 1991;121(3 Pt 1):871–875. doi: 10.1016/0002-8703(91)90201-r. [DOI] [PubMed] [Google Scholar]
- 39.Yamakado T, Takagi E, Okubo S, ImanakaYoshida K, Tarumi T, Nakamura M, Nakano T. Effects of aging on left ventricular relaxation in humans - Analysis of left ventricular isovolumic pressure decay. Circulation. 1997;95(4):917–923. doi: 10.1161/01.cir.95.4.917. [DOI] [PubMed] [Google Scholar]
- 40.Clayton EH, Okamoto RJ, Bayly PV. Mechanical properties of viscoelastic media by local frequency estimation of divergence-free wave fields. J Biomech Eng. 2013;135(2):021025. doi: 10.1115/1.4023433. [DOI] [PMC free article] [PubMed] [Google Scholar]
- 41.Sack I, Rump J, Elgeti T, Samani A, Braun J. MR elastography of the human heart: noninvasive assessment of myocardial elasticity changes by shear wave amplitude variations. Magn Reson Med. 2009;61(3):668–677. doi: 10.1002/mrm.21878. [DOI] [PubMed] [Google Scholar]
- 42.Kruse SA, Rose GH, Glaser KJ, Manduca A, Felmlee JP, Jack CR, Jr, Ehman RL. Magnetic resonance elastography of the brain. Neuroimage. 2008;39(1):231–237. doi: 10.1016/j.neuroimage.2007.08.030. [DOI] [PMC free article] [PubMed] [Google Scholar]
- 43.McKnight AL, Kugel JL, Rossman PJ, Manduca A, Hartmann LC, Ehman RL. MR elastography of breast cancer: preliminary results. Ajr. 2002;178(6):1411–1417. doi: 10.2214/ajr.178.6.1781411. [DOI] [PubMed] [Google Scholar]
Associated Data
This section collects any data citations, data availability statements, or supplementary materials included in this article.


