

Abstract
Background:
Continuous glucose monitors (CGMs) require percutaneous wire probes to monitor glucose. Sensors based on luminescent hydrogels are being explored as fully implantable alternatives to traditional CGMs. Our previous work investigated hydrogel matrices functionalized with enzymes and oxygen-quenched phosphors, demonstrating sensitivity to glucose, range of response, and biofouling strongly depend on the matrix material. Here, we further investigate the effect of matrix composition on overall performance in vitro and in vivo.
Methods:
Sensors based on three hydrogels, a poly(2-hydroxyethyl methacrylate) (pHEMA) homopolymer and 2 poly(2-hydroxyethyl methacrylate-co-acrylamide) (pHEMA-co-AAm) copolymers, were compared. These were used to entrap glucose oxidase (GOx), catalase, and an oxygen-sensitive benzoporphyrin phosphor. All sensor formulations were evaluated for glucose response and stability at physiological temperatures. Selected sensors were then evaluated as implanted sensors in a porcine model challenged with glucose and insulin. The animal protocol used in this study was approved by an IACUC committee at Texas A&M University.
Results:
PHEMA-co-AAm copolymer hydrogels (75:25 HEMA:AAm) yielded the most even GOx and dye dispersion throughout the hydrogel matrix and best preserved GOx apparent activity. In response to in vitro glucose challenges, this formulation exhibited a dynamic range of 12-167 mg/dL, a sensitivity of 1.44 ± 0.46 µs/(mg/dL), and tracked closely with reference capillary blood glucose values in vivo.
Conclusions:
The hydrogel-based sensors exhibited excellent sensitivity and sufficiently rapid response to the glucose levels achieved in vivo, proving feasibility of these materials for use in real-time glucose tracking. Extending the dynamic range and assessing long-term effects in vivo are ongoing efforts.
Keywords: biosensing, enzymes, hydrogel, implant, luminescence, biomaterials
Diabetes mellitus affects nearly 30 million children and adults in the United States, and projections estimate one in every three adults will have diabetes by the year 2050.1-4 Clinically available continuous glucose monitors (CGMs) enable accurate real-time tracking of blood glucose concentrations.5,6 However, studies report these sensors must be calibrated between one and four times daily with capillary blood obtained via finger prick.7,8 In addition, these systems require percutaneous electrodes, providing a pathway for infection, causing tissue trauma (from external applied forces) and significant immune response to the implant. Consequently, these CGMs must be replaced every three to seven days due to sensor failure9, 10 and exhibit low adoption rates and significant patient noncompliance(particularly among children and adolescents), despite the potential benefits.10,11 Fully implantable CGMs would eliminate the transcutaneous aspect of current CGMs, minimizing infection risk and eradicating electrode micromotion and associated tissue trauma from applied external forces.9 A paradigm shift in sensing technology may provide the change in fundamental operating characteristics necessary to achieve a functional fully implantable CGM.
Hydrogels are a class of biomaterials made of cross-linked polymer networks, which imbibe and retain water without dissolving and often exhibit physical and chemical properties similar to human tissues, including skin.2,12 Hydrogels as luminescent, fully implantable glucose biosensors have been studied by Coté, Pishko, McShane, and others since proposed about 15 years ago.13-15 Demonstrations of potential hydrogel sensor formats over the years have included poly(ethylene glycol)-based microspheres and fibers13-15 and includes a variety of hollow polymeric capsules and various nanocomposite particulate systems using other encapsulating materials.16-20 Utilizing these unique properties of hydrogels in a fully implantable CGM may circumvent repetitive tissue trauma and infection associated with the percutaneous nature of traditional CGM devices in vivo.9,21 Used in medical devices for decades, one of the most widely studied and well-characterized hydrogels for biomedical applications is poly (2-hydroxyethyl methacrylate) (pHEMA).22 Initially, pHEMA was primarily used in soft contact lenses, but it has also been exploited for a wide variety of biomedical applications.12
Such hydrogels may act as effective hosts for luminescence sensing chemistry, including poprhyrins that act as sensitive indicators of oxygen. Metalloporphyrin dyes exhibit luminescence lifetimes 3 to 5 orders of magnitude longer than the fluorescence lifetimes of native proteins in blood and tissue, allowing temporal separation from background autofluorescence.23-25 By coupling these oxygen-quenched phosphors with oxidoreductase enzymes (ie, GOx), it is possible to detect glucose by measuring local changes in oxygen. In this enzyme-porphyrin platform, sensor response depends on the rate of glucose and oxygen consumption by GOx and the extent of local oxygen depletion near the dye (Figure 1). Sensor response depends on the availability of the substrates glucose and oxygen to the enzyme (governed by mass transport) as well as the affinity of the enzyme for both substrates.16,19,20,26,27
Figure 1.

(Top) Illustration of transdermal optical interrogation of a subcutaneous sensor implant; left illustrates illumination, right illustrates implant emission. Art is only for understanding of system, and does not represent actual beam shape. (Bottom) Illustration of luminescence mechanism. Luminescence lifetime and intensity increase with decreasing oxygen levels around the dye.
We have previously shown that pHEMA-based hydrogels can be functionalized with enzymes and long-lifetime phosphors to be used as luminescence-based glucose sensors. In the same study, we illustrated the ability to tune sensor behavior through hydrogel composition by influencing glucose and oxygen diffusion.18 In addition, we elucidated the effects of biofouling on sensor performance in vitro and in vivo for pHEMA, polyacrylamide (pAAm), and pHEMA-co-AAm copolymer hydrogels. However, those sensors employed green-excited phosphors, such that emission signals collected through tissue were of low signal-to-noise ratio. In the present work, we aimed to (1) extend the operating wavelength range for in vivo use by incorporating an alternative long-lifetime phosphor, (2) further characterize the in vitro glucose response characteristics of similar pHEMA-co-AAm hydrogels to more fully understand how to adjust their response properties, and (3) perform proof of concept in vivo testing to evaluate their potential for use as implantable biosensors.
Methods
Reagents and Instrumentation
Tetraethylene glycol dimethacrylate (TEGDMA) and 2-hydroxyethyl methacrylate (HEMA, ophthalmic grade) were purchased from Polysciences, Inc (Warrington, PA). Ethylene glycol, 2,2-dimethoxy-2-phenyl-acetophenone (DMPAP), 1-Ethyl-3-[3-dimethylaminopropyl]carbodiimide hydrochloride (EDC), sterile phosphate buffer saline (PBS, 0.01M phosphate buffer, 0.154 M sodium chloride), o-dianisidine, horseradish peroxidase, and catalase (CAT) were obtained from Sigma-Aldrich® (St. Louis, MO). Glucose oxidase (GOx) was obtained from BBI™ Solutions (Cardiff, UK). Sodium chloride, potassium chloride, potassium phosphate (dibasic), sulfo-N-hydroxysuccinimide (sulfo-NHS), and dimethyl sulfoxide (DMSO) were purchased from VWR® (Radnor, PA). Sodium phosphate (monobasic) and glucose were purchased from ACROS Organics (ThermoFisher Scientific Inc, Waltham, MA) and Macron Fine Chemicals™ (Avantor™ Performance Materials, Inc, Center Valley, PA), respectively. Acrylamide and sterile DI water were purchased from AMRESCO® (Solon, OH) and Invitrogen™ (Life Technologies™, Grand Island, NY), respectively. Sterile 50% (w/w) dextrose was obtained from Cardinal Health (Dublin, OH). The red-excitable luminescent dye, a methacrylated palladium (II) benzoporphyrin (PdBP), was custom synthesized and donated by PROFUSA, Inc (San Francisco, CA). The UV Lamp (Blak-Ray B-100SP) was purchased from UVP, LLC (Upland, CA).
Optical Interrogation and Data Collection
Sensors were monitored with a custom luminescent measurement system through a LabVIEW interface. The measurement system uses LEDs (Philips Lumileds Luxeon Rebel Red λex = 630 nm) driven at ~200 mA (typical) for ~40 mW output during ON cycles. LEDs are typically pulsed ON for 250 µs and then held OFF for 5000 µs while the emission decay is monitored. Emission intensity is monitored with silicon PMTs (SensL) after collecting emission through a lens and filter (λem = 809 ± 40 nm, Semrock). The excitation source (LED) and detector (silicon photomultiplier) are housed in a 1.5-inch diameter “puck” where the 1 mm apertures for the excitation and emission are spaced at 6 mm. The puck is placed in contact with the flow cell (in vitro) or animal skin (in vivo). Emission decay curves are processed using nonlinear least-squares regression (Levenburg–Marquardt algorithm) using a mono-exponential decay to calculate the lifetime (τ) and intensity of the long-lived component (phosphorescence); the baseline background intensity resulting from scattered excitation light bleeding through the filter is then calculated as the residual of the difference between the fitted curve and the actual decay. In this experiment, the instrument was configured to measure the luminescent lifetime on each channel once every five seconds. Three sensors were monitored simultaneously in both the in vitro and in vivo experiments.
Injectable Glucose Sensor Fabrication
Hydrogels composed of 75:25 HEMA:AAm were chosen for further in vivo study based on a highest percentage GOx apparent activity retention compared to a pHEMA homopolymer, a 75:25 HEMA:AAm copolymer and a 50:50 HEMA:AAm copolymer. Hydrogels for injection were fabricated similarly as described previously18 with a few changes (exchanging the green-excitable phenyl porphyrin with the red-excitable PdBP and a different hydrogel shape: 5 mm long strips with a ~750 µm × 750 µm square cross section; Figure 2). This shape was selected for ease of insertion through a needle, and was employed for both in vitro and in vivo sensor performance testing. The enzyme component in PBS contained 232.5 µM GOx and 25 µM CAT; CAT acts as a peroxide scavenger which aids in preserving GOx activity. The PdBP was dissolved in dimethyl sulfoxide at a concentration of 10 mM (approximately 1 mM in the final gel).
Figure 2.
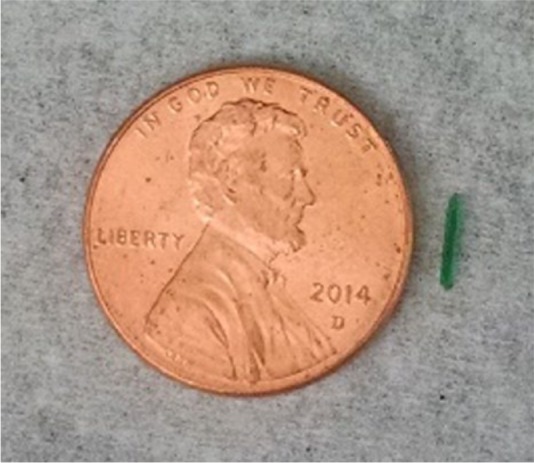
Image of a sensor strip next to a penny. Sensor dimensions are ~0.75 mm × 0.75 mm × 5 mm.
Precursors containing the enzymes and PdBP dye were injected into glass slide molds, each with a 0.03-inch Teflon spacer, secured with clips. Gels were photopolymerized with UV light (365 nm, 140 watts, 3 minutes per side). Finally, the gels were removed from the mold, rinsed with deionized water, and placed in 40 mL of PBS with 5.6 mg of EDC and 16 mg sulfo-NHS and were allowed to equilibrate in this solution overnight to crosslink enzymes and prevent enzyme leaching. Oxygen-sensitive reference sensors (O2 Ref) were fabricated with the same parameters as described except PBS replaced the enzyme solution and strips were not exposed to EDC/NHS. Materials for injection were cut to the same final dimensions described above.
In Vitro Sensor Response
To test the in vitro optical response of the sensors to glucose, sensor strips were immobilized in a sample chamber of a previously described glucose flow-through apparatus.18 Briefly, two reservoirs (one containing PBS and the other containing 400 mg/dL glucose in PBS) were connected to two separate pumps controlled by a LabVIEW program. Combined pump effluents flowed directly to the sample chamber housing the immobilized sensing strips. The sample chamber consists of a Teflon spacer with slots for samples to lie, housed between an acrylic base and top plate, secured with screws in an acrylic top plate. Chamber effluent drained directly into a waste tank. For oxygen diffusion experiments, a similar setup was used, except a single recirculating system containing PBS was used. Mass flow controllers purged the PBS with nitrogen gas to vary oxygen levels, monitored with a calibrated picoammeter (Unisense, Denmark). In both oxygen and glucose experiments, three strips were run simultaneously, and their luminescence lifetime responses to various glucose or oxygen concentrations was measured with the custom optical interrogation unit.
For the oxygen diffusion experiment, sensors were exposed to five concentrations of oxygen: 50.22, 40.17, 30.13, 20.09, and 0 µM. The luminescence lifetime ratios were calculated and plotted against oxygen concentrations. Data were fit with a linear curve (R2 > .99) to determine the Stern–Volmer quenching constant.
During the glucose experiment, sensors were exposed to 6 concentrations of glucose (0, 50, 100, 200, 300, and 400 mg/dL) at ambient oxygen while in an incubator at 37 °C; after the final glucose concentration was reached (400 mg/dL), PBS (0 mg/dL glucose) was flowed over the sensors to test sensor reversibility. The dynamic range and linear sensitivity of the sensor implants was calculated by fitting a curve to the data using a nonlinear least squares regression method. The upper and lower limits of detection were calculated using the 3σ approach: the lower limit was defined as the baseline lifetime plus three times the standard deviation whereas the upper limit was defined as the saturation lifetime minus three times the standard deviation. The linear sensitivity was calculated as the slope of the line connecting the upper and lower limits of the analytical range.
In Vivo Sample Preparation
All utensils were autoclaved prior to use. Glucose sensing hydrogel slab strips (~0.75 mm × 0.75 mm × 5 mm) were suspended in 70% ethanol in a sterile 50 mL centrifuge tube for 10 minutes in a biosafety cabinet. One-third of the total volume was poured into a waste beaker and replaced with sterile DI water three times, allowing the sensors to equilibrate for 30 minutes between each solvent exchange. Next, this gradual equilibration process was repeated but by pouring off one-half of the total ethanol/water solution volume three times and filling with water, then the entire volume three times and filling with water, and finally filling the entire tube with sterile PBS to equilibrate overnight prior to in vivo insertion.
In Vivo Insertion and Glucose Modulation
The animal protocol used in this study was approved by an IACUC committee at Texas A&M University. A female Sinclair mini-pig was obtained from Sinclair Bio-Resources (Columbia, MO). The pig was initially anesthetized with an injection of telazol (5 mg/kg) and buprenorphine (0.01 mg/kg), sedated, and intubated. Next, the dorsal hair was shaved and skin was thoroughly cleaned. Anesthesia was maintained with 1.5-2.0% isoflurane (v/v in O2) to effect during sensor injections and blood glucose modulation. Skin was prepared for injections by scrubbing with ChloraPrep applicators (CareFusion, San Diego, CA). Sensors were injected subcutaneously into the dorsum of the pig (42.0 kg, one year old) from an 18 gauge cannula with a reverse action plunger. The sensors were targeted for insertion at ~5 mm deep; average and standard deviation of implant depths were determined to be 5.4 ± 1.9 mm from postexperiment histological evaluation of n = 60 implants (some implants were used only as controls and for histology for separate studies, so they are not detailed here). The blood glucose of the pig was modulated between 40 and 235 mg/dL via continuous intravenous (IV) infusion of 20% dextrose in sterile saline (diluted from sterile 50% dextrose) followed by IV bolus infusions of Humalog insulin (Eli Lilly, Indianapolis, IN).
The pig was first challenged with glucose by infusing a 20 w/v% glucose solution at increasing rates until a measured blood glucose concentration of 234 mg/dL was reached. Next, the glucose infusion rate was continually decreased to observe a downward trend in sensor response, and finally insulin was administered intravenously to drive the sensor response back down to the baseline glucose value. Sensors were optically interrogated transdermally with the same external optical reader described above. Luminescence lifetimes were recorded for 2 glucose-sensitive implants, an oxygen-sensitive (but glucose-insensitive) reference, and an oxygen- and glucose-insensitive reference. The glucose- and oxygen-insensitive reference consisted of a pHEMA matrix functionalized with gadolinium-gallium-garnet crystals (G3). Capillary blood glucose was measured every 5-10 minutes in triplicate with three separate Accu-Check Nano glucometers (Roche, Indianapolis, IN).
Results
In Vitro Performance
Sensors were determined to exhibit an analytical range of 12-167 mg/dL with a linear sensitivity of 1.44 ± 0.46 µs/(mg/dL). Lifetime saturation from 200-400 mg/dL indicates the sensors had reached the upper limit of their analytical range. After exposure to 400 mg/dL glucose, the sensors were again exposed to PBS (Figure 3). The consistent lifetime measurements at 0 mg/dL before (28.7 ± 0.9 µs) and after exposure to various glucose concentrations (27.9 ± 0.9 µs) prove the full reversibility of the sensing system. In addition, Stern–Volmer diffusion kinetics appear very linear (R2 > .99), reconcilable with theory (Equation 1) and prior work.23
Figure 3.

(Left) Response of the 75:25 HEMA:AAm copolymer to various glucose concentrations. (Right) Steady-state calibration curves for the 75:25 HEMA:AAm copolymer. Data represent triplicate average ± 95% confidence intervals (n = 3 independent samples). Inset shows Stern–Volmer oxygen sensitivity underlying the overall glucose response (n = 3, averages ± 95% confidence intervals).
In Vivo Performance
Three glucose-sensitive implants were injected into porcine dorsal subcutaneous tissue, two of which were successfully located 2 hours after implantation using the custom optical system. These were then monitored continuously during the glucose challenge experiment (Figure 4).
Figure 4.

In vivo response of subcutaneous sensor implants in the dorsum of a female porcine model. In the figure legend, Ch. 1 and Ch. 2 refer to two independently functioning glucose sensors interrogated optically by two independent channels on the optical interrogation system described above in the section on Optical Interrogation and Data Collection, O2 Ref refers to an oxygen-sensitive but glucose-insensitive hydrogel reference implant (PdBP dye without the enzymes), and G3 Ref refers to a hydrogel reference implant containing a dye that is both glucose- and oxygen-insensitive.
Since sensor response variations seen in vivo are exhibited in time delays, we suspect local anatomical and physiological differences are the primary cause of variability here. To further illustrate correlations between measured blood glucose profiles and sensor responses, the luminescence lifetimes were plotted against blood glucose values (Figure 5).
Figure 5.
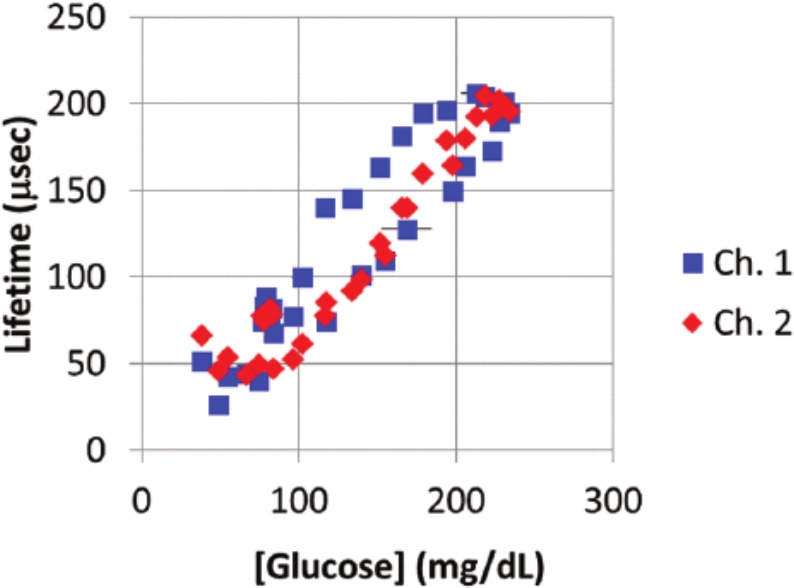
Scatter plot of measurements of lifetime versus corresponding glucose measurements from blood samples. These are real-time, uncorrected single-point values of lifetime measured versus the average of blood glucose values obtained from the same blood droplet using 3 glucometers (horizontal error bars indicate 1 standard deviation in blood glucose ). Channel 2 shows consistent clustering of lifetime values for similar glucose values, whereas channel 1 exhibits significant “hysteresis” in the measurements. This difference results from a different delay period observed for rising versus falling glucose levels (the higher levels represent measurements made on the falling edge). We attribute these differences to the local tissue environment, which will have unique characteristics related to the specific short-term host response to each implant.
Discussion
In Vitro Performance
At 0 and 50 mg/dL glucose, all three sensor response curves appear very smooth and trend closely with one another with some slight, but negligible, difference in the steady-state response lifetime at 50 mg/dL. Noticeable response differences occur from 100-400 mg/dL glucose. We believe this disparity results from slight inhomogeneities in gels and width variations in the manually cut sensor strips. Previously, we have shown different surface area to volume ratios yield different diffusion-reaction balances and, hence, different steady-state lifetimes.16 We hypothesize the upper limit of detection at 167 mg/dL is due to the diffusion of glucose and oxygen in this particular hydrogel matrix, because wider analytical ranges, but decreased sensitivity, have been reported in hydrogels with greater pHEMA content when using similar sensing chemistry.18 Linear Stern–Volmer behavior indicates the dye is adequately accessible to oxygen at relevant physiological concentrations.
In Vivo Performance
During the glucose challenge, the emission measured from the oxygen-sensitive control (O2 Ref) and the oxygen-insensitive reference (G3 Ref) implants showed no correlation to changes in blood glucose levels. A drift downward in the O2 Ref lifetime was observed throughout the experiment (also observed in glucose-sensitive implants), a result of either the result of slow tissue reoxygenation following a previous experiment (an immediately prior test under hypoxic conditions) or local temperature changes around the sensor due to slight optical reader warming during the experiment. A continuous slow temperature increase was recorded using the on-board thermistor embedded in the skin-contacting surface of the reader head; this surface change may have had an influence on the underlying tissue.
Finally, we attribute the different apparent response rate/lag time of the two glucose sensors to different dorsal anatomical sensor placement, positioning of the pig during the procedure, and potentially different degrees of tissue trauma caused by sensor insertion. The in vitro time constant to reach steady-state was approximately 15 minutes for each glucose concentration. Sensor-to-sensor variations observed in vitro were manifested as different steady-state lifetimes, not time delays. The in vivo lag time observed for both glucose sensors (10 minutes observed in the descending blood glucose profile during the end of the experiment) was similar to the in vitro response time. Thus, so we believe implant site variability is the source of the different time lags seen in this particular experiment. Other factors influencing different in vivo behavior include glucose consumption by inflammatory cells during the acute immune response window.28 Here, the sensors were monitored only two hours after implantation; thus, sensor-to-sensor variability is likely due to slower glucose diffusion in vivo following insertion and the consumptive nature of the sensors.29,30
Nevertheless, these data illustrate both glucose-sensitive implants returned to baseline values matching the O2 Ref after the blood glucose levels dropped below about 80 mg/dL. This flattening of the low-glucose response is also consistent with the in vitro data, where there is a decrease in sensitivity as glucose falls to lower levels, especially when considering that the diffusion coefficient of glucose is likely substantially lower in subcutaneous tissue compared to the in vitro benchtop setup.
Future experiments will increase the number of sensors monitored to further observe this effect, as well as more fully evaluate the mechanical integrity of the implants and stability of the response to glucose. It is noteworthy that other experiments conducted purely to assess implant safety and biocompatibility enabled both histological analysis (microscopy) as well as extraction of whole devices for comparative in vitro testing. Intact sensors, extracted from the subject after up to six weeks, were found to respond in vitro (data not shown).
Conclusions
We have shown enzymatic sensors monitoring phosphorescence lifetime in copolymer hydrogels can be designed to respond to glucose concentrations in vitro with high sensitivity and rapid response. We further demonstrated these materials could be monitored to closely track blood glucose levels over hyperglycemic, euglycemic, and slightly hyperglycemic blood glucose concentrations in vivo using a porcine model. To our knowledge, this is the first demonstration of an effective transdermal interrogation and in vivo glucose response from a fully implantable enzymatic glucose sensor measuring luminescence lifetime instead of intensity.13 Therefore, this work represents an important advance toward noninvasive monitoring of injected sensor devices for diabetes management. Long-term foreign body response effects are currently under investigation and will be the subject of an upcoming report. Future work will involve conducting long-term stability tests in vitro and in vivo for this sensing platform along with tailoring hydrogel properties for extended dynamic range and in vivo functional lifetime.
Acknowledgments
The authors gratefully acknowledge Kara Schulz from the Texas Institute for Preclinical Studies (TIPS) for her assistance in developing the animal protocol and Jitendra Solanki for assistance in obtaining the Stern–Volmer data. Rebecca Gant (PROFUSA) and staff members from TIPS are acknowledged for assistance in conducting the animal study. The custom optical instrumentation used in this work was jointly developed by PROFUSA, Inc and MJM, with funding through the NIH Director’s Transformative Research Award (TRA) program.
Footnotes
Abbreviations: CAT, catalase; CGM, continuous glucose monitor; DMPAP, 2,2- dimethoxy-2-phenylacetophenone; GOx, glucose oxidase; HEMA, 2-hydroxyethyl methacrylate; pAAm, poly(acrylamide); PdBP, palladium (II) benzoporphyrin; pHEMA, poly(2-hydroxyethyl methacrylate); p(HEMA-co-AAm) or copolymer, poly(2-hydroxyethyl methacrylate)-co-poly(acrylamide); TEGDMA, tetra(ethylene glycol) dimethacrylate.
Declaration of Conflicting Interests: The author(s) declared the following potential conflicts of interest with respect to the research, authorship, and/or publication of this article: SPN, SG, and NAW are employees of PROFUSA, Inc, a privately held company.
Funding: The author(s) disclosed receipt of the following financial support for the research, authorship, and/or publication of this article: This work was supported by the National Institutes of Health (project numbers 1R01EB016414 and 1R43DK093139).
References
- 1. Centers for Disease Control and Prevention. National diabetes statistics report: estimates of diabetes and its burden in the United States 2014. Available at: http://www.cdc.gov/diabetes/pubs/statsreport14/national-diabetes-report-web.pdf.
- 2. American Diabetes Association. Economic costs of diabetes in the US in 2012. Diabetes Care. 2013;36(4):1033-1046. [DOI] [PMC free article] [PubMed] [Google Scholar]
- 3. Boyle JP, Honeycutt AA, Narayan KV, et al. Projection of diabetes burden through 2050 impact of changing demography and disease prevalence in the US. Diabetes Care. 2001;24(11):1936-1940. [DOI] [PubMed] [Google Scholar]
- 4. Phillips LS, Ratner RE, Buse JB, Kahn SE. We can change the natural history of type 2 diabetes. Diabetes Care. 2014;37(10):2668-2676. [DOI] [PMC free article] [PubMed] [Google Scholar]
- 5. Hoeks L, Greven W, De Valk H. Real-time continuous glucose monitoring system for treatment of diabetes: a systematic review. Diabet Med. 2011;28(4):386-394. [DOI] [PubMed] [Google Scholar]
- 6. Szypowska A, Ramotowska A, Dzygalo K, Golicki D. Beneficial effect of real-time continuous glucose monitoring system on glycemic control in type 1 diabetic patients: systematic review and meta-analysis of randomized trials. Eur J Endocrinol. 2012;166(4):567-574. [DOI] [PubMed] [Google Scholar]
- 7. Mahmoudi Z, Johansen MD, Christiansen JS, Hejlesen O. Comparison between one-point calibration and two-point calibration approaches in a continuous glucose monitoring algorithm. J Diabetes Sci Technol. 2014;8(4):709-719. [DOI] [PMC free article] [PubMed] [Google Scholar]
- 8. Reynolds A, Tekinkaya H, Venn B. The effect on day-long glycemia of consuming lower and higher glycemic index diets in people with type 2 diabetes: a randomized crossover study. J Diabetes Metab. 2014;5(436):2. [Google Scholar]
- 9. Helton KL, Ratner BD, Wisniewski NA. Biomechanics of the sensor-tissue interface—effects of motion, pressure, and design on sensor performance and the foreign body response—part I: theoretical framework. J Diabetes Sci Technol. 2011;5(3):632-646. [DOI] [PMC free article] [PubMed] [Google Scholar]
- 10. Hermanides J, Phillip M, DeVries JH. Current application of continuous glucose monitoring in the treatment of diabetes pros and cons. Diabetes Care. 2011;34(suppl 2):S197-S201. [DOI] [PMC free article] [PubMed] [Google Scholar]
- 11. Formosa N, Matyka K. Continuous glucose monitoring in children and adolescents with type 1 diabetes mellitus: a literature review. Arch Dis Child. 2012;97(suppl 1):A104. [Google Scholar]
- 12. Gibas I, Janik H. Review: synthetic polymer hydrogels for biomedical applications. Сhem Chem Technol. 2010;4(4):297-304. [Google Scholar]
- 13. Heo YJ, Shibata H, Okitsu T, Kawanishi T, Takeuchi S. Long-term in vivo glucose monitoring using fluorescent hydrogel fibers. Proc Natl Acad Sci. 2011;108(33):13399-13403. [DOI] [PMC free article] [PubMed] [Google Scholar]
- 14. McShane MJ, Russell RJ, Pishko MV, Cote GL. Glucose monitoring using implanted fluorescent microspheres. IEEE Eng Med Biol Mag. 2000;19(6):36-45. [DOI] [PubMed] [Google Scholar]
- 15. Russell RJ, Pishko MV, Gefrides CC, McShane MJ, Cote GL. A fluorescence-based glucose biosensor using concanavalin A and dextran encapsulated in a poly (ethylene glycol) hydrogel. Anal Chem. 1999;71(15):3126-3132. [DOI] [PubMed] [Google Scholar]
- 16. Brown JQ, Srivastava R, McShane MJ. Encapsulation of glucose oxidase and an oxygen-quenched fluorophore in polyelectrolyte-coated calcium alginate microspheres as optical glucose sensor systems. Biosens Bioelect. 2005;21(1):212-216. [DOI] [PubMed] [Google Scholar]
- 17. Chaudhary A, Chaudhary M, Raina H, et al. Evaluation of glucose sensitive affinity binding assay entrapped in fluorescent dissolved-core alginate microspheres. Biotechnol Bioeng. 2009;104(6):1075-1085. [DOI] [PubMed] [Google Scholar]
- 18. Roberts J, Park J, Helton K, Wisniewski N, McShane M. Biofouling of polymer hydrogel materials and its effect on diffusion and enzyme-based luminescent glucose sensor functional characteristics. J Diabetes Sci Technol. 2012;6(6):1267-1275. [DOI] [PMC free article] [PubMed] [Google Scholar]
- 19. Stein E, Stein P, Grant H, Zhu M, McShane M. Microscale enzymatic optical biosensors using mass transport limiting nanofilms. 1. Fabrication and characterization using glucose as a model analyte. Anal Chem. 2007;79(4):1339-1348. [DOI] [PMC free article] [PubMed] [Google Scholar]
- 20. Stein E, Stein S, Singh M, McShane M. Microscale enzymatic optical biosensors using mass transport limiting nanofilms. 2. Response modulation by varying analyte transport properties. Anal Chem. 2008;80(5):1408-1417. [DOI] [PubMed] [Google Scholar]
- 21. Koschwanez HE, Yap FY, Klitzman B, Reichert WM. In vitro and in vivo characterization of porous poly-L-lactic acid coatings for subcutaneously implanted glucose sensors. J Biomed Mater Res A. 2008;87(3):792-807. [DOI] [PMC free article] [PubMed] [Google Scholar]
- 22. Wichterle O, Lim D. Hydrophilic gels for biological use. Nature. 1960;185:117-118. [Google Scholar]
- 23. Borisov SM, Borisov G, Nuss I, Klimant Red light-excitable oxygen sensing materials based on platinum(II) and palladium(II) benzoporphyrins. Anal Chem. 2008;80(24):9435-9442. [DOI] [PubMed] [Google Scholar]
- 24. Vinogradov SA, Lo LW, Jenkins WT, Evans SM, Koch C, Wilson DF. Noninvasive imaging of the distribution in oxygen in tissue in vivo using near-infrared phosphors. Biophys J. 1996;70(4):1609-1617. [DOI] [PMC free article] [PubMed] [Google Scholar]
- 25. Vinogradov SA, Wilson DF. Metallotetrabenzoporphyrins. New phosphorescent probes for oxygen measurements. J Am Chem Soc Perkin Trans 2. 1995(1):103-111. [Google Scholar]
- 26. Gibson QH, Swoboda BE, Massey V. Kinetics and mechanism of action of glucose oxidase. J Biol Chem. 1964;239(11):3927-3934. [PubMed] [Google Scholar]
- 27. Roberts J, Roberts D, Ritter M, McShane M. A design full of holes: functional nanofilm-coated microdomains in alginate hydrogels. J Mater Chem B Mater Biol Med. 2013;1(25):3195. [DOI] [PMC free article] [PubMed] [Google Scholar]
- 28. Novak M, Novak F, Yuan W, Reichert Macrophage embedded fibrin gels: an in vitro platform for assessing inflammation effects on implantable glucose sensors. Biomaterials. 2014;35(36):9563-9572. [DOI] [PMC free article] [PubMed] [Google Scholar]
- 29. Bolincier J, Ungerstedt U, Arner P. Microdialysis measurement of the absolute glucose concentration in subcutaneous adipose tissue allowing glucose monitoring in diabetic patients. Diabetologia. 1992;35(12):1177-1180. [DOI] [PubMed] [Google Scholar]
- 30. Fischer U, Fischer R, Ertle P, et al. Assessment of subcutaneous glucose concentration: validation of the wick technique as a reference for implanted electrochemical sensors in normal and diabetic dogs. Diabetologia. 1987;30(12):940-945. [DOI] [PubMed] [Google Scholar]