Abstract
Background:
The ongoing progress of continuous glucose monitoring (CGM) systems results in an increasing interest in comparing their performance, in particular in terms of accuracy, that is, matching CGM readings with reference values measured at the same time. Most often accuracy is evaluated by the mean absolute relative difference (MARD). It is frequently overseen that MARD does not only reflect accuracy, but also the study protocol and evaluation procedure, making a cross-study comparison problematic.
Methods:
We evaluate the effect of several factors on the MARD statistical properties: number of paired reference and CGM values, distribution of the paired values, accuracy of the reference measurement device itself and the time delay between data pairs. All analysis is done using clinical data from 12 patients wearing 6 sensors each.
Results:
We have found that a few paired points can have a potentially high impact on MARD. Leaving out those points for evaluation thus reduces the MARD. Similarly, accuracy of the reference measurements greatly affects the MARD as numerical and graphical data show. Results also show that a log-normal distribution of the paired references provides a significantly different MARD than, for example, a uniform distribution.
Conclusions:
MARD is a reasonable parameter to characterize the performance of CGM systems when keeping its limitations in mind. To support clinicians and patients in selecting which CGM system to use in a clinical setting, care should be taken to make MARD more comparable by employing a standardized evaluation procedure.
Keywords: continuous glucose monitoring, CGM, MARD, accuracy, precision, performance evaluation, performance comparison
Currently three manufacturers from the United States have needle-type systems for real-time continuous glucose monitoring (CGM) on the market. Each of these manufacturers has introduced new generations of its respective CGM system to the market over the past decade; each new generation has shown substantial improvements in analytical performance, size, handling, and so on (Dexcom G4® Platinum, Abbott FreeStyle® Navigator II [currently not available in the US market], Medtronic Enlite®).1 As well, one manufacturer from the European Union (EU) has announced a new product.2 While the rapid development and subsequent improvement are quite positive for clinical usage, they hamper the evaluation of the safety and efficacy of such systems in the classic evaluation setting, that is, the performance of clinical head-to-head studies, which typically require years for completion.
One parameter often used to characterize the analytical performance of CGM systems is MARD, the mean (sometimes also the median value is used) absolute relative difference between the CGM readings and the values measured at the same time using a reference system (see, eg, Bailey et al,3 Damiano et al,4 Freckmann et al,5 Garg et al,6 Kovatchev et al,7 Kropff et al,8 Leelarathna et al,9 Luijf et al,10 Luijf et al,11 Weinstein et al,12 and Zschornack et al13). MARD has many advantages; in particular it expresses accuracy as a single value (possibly per range) and can be easily computed. The dependency of MARD as a (continuous) function of glucose was analyzed in Rodbard.14 In some studies, the analytical performance has also been also determined by comparing the readings of two devices of the same CGM system applied to the same subject (paired absolute relative difference, PARD).15
Ideally, the comparison between different CGM systems would be performed in a head-to-head study. However, the number of sensors that can be applied to a patient at the same time is limited, especially if the CGM systems are intended to be evaluated under real-life conditions. Under more experimental conditions up to three systems (with two devices each) have been studied.5 This is one reason why the number of head-to-head studies using different brands or generations of CGM systems is quite limited. In view of the rapid development, such studies would also have to be repeated regularly to make accurate statements about the most recent systems (which are also not introduced to the US and EU markets at the same time). The time required to perform and publish such studies also hampers the availability of, for example, comparative MARD values for the most recent generations of CGM systems that are already on the market.
Under such circumstances, one option could be to use MARD data obtained in different studies to compare different CGM systems and/or generations. However, this would imply that the MARD data obtained in different studies are not heavily influenced by study-related parameters. As a matter of fact, MARD is based on the comparison of two values, which means that every difference between the two values is interpreted as error, even if this error does not arise from the accuracy of the CGM system itself, that is, its ability to precisely measure the glucose concentration in the immediate surroundings of its sensing element.
Note that in practice, the (raw) CGM measurements in the interstitial tissues are calibrated using blood glucose measurements (venous, arterialized venous, capillary, or arterial blood glucose). Thus, there is a systematic error even if the sensor measures precisely the glucose concentration in the interstitial fluid because the concentration in the two compartments is in general not the same, especially in a postprandial state.
To highlight this issue, Table 1 reports different MARD values for the same CGM system provided in the literature. In the same year (2013), MARD values ranging from 11.8% to 16.5% were reported. Depending on the value used, a comparison with another sensor could lead to a completely opposite decision being taken.
Table 1.
MARD Data Reported for the FreeStyle® Navigator I CGM System in the Literature.
| Author/publication date | MARD (%) | Cohort | Number of paired points |
|---|---|---|---|
| Weinstein et al 200712 | 12.8 | 58 subjects, 50 hours over 5 days | 20.362 |
| Kovatchev et al 20087 | 15.3 | 34 subjects, 1 visit | Not reported |
| Garg et al 20096 | 16.1 | 14 subjects, 3 days over 15 days | 1.175 |
| Luijf et al 201311 | 16.5 | 20 subjects, 1 day | 272 |
| Damiano et al 20134 | 11.8 | 6 subjects, 48 hours | 2.356 |
| Freckmann et al 20135 | 12.3 | 12 subjects, 4 days | 2.399a |
| Leelarathna et al 20139 | 13.9 | 32 subjects | 4.218 |
More results than these were recorded, but only the core phase (without initial day) was used for MARD computation.
In one clinical study,8 MARD values computed for two CGM systems (Dexcom G4 and Medtronic Enlite) during the inpatient and outpatient phases not only were different (see Table 2), but changed in the opposite direction. There is no obvious answer as to why the performance of one system was slightly better (lower MARD values) under at-home conditions versus clinical research conditions (CRC), while performance of the other system was worse.
Table 2.
Differences in MARD Estimated in CRC and Under At-Home Conditions.
| CRC |
Home |
|||
|---|---|---|---|---|
| MARD % | SD | MARD % | SD | |
| Dexcom G4 | 13.6 | 11.0 | 12.2 | 12.0 |
| Medtronic Enlite | 16.6 | 13.5 | 19.9 | 20.5 |
The aim of this commentary is to focus attention on the limits of such a simple measure as MARD and to shed some light on distinct MARD values obtained in clinical studies. For this purpose, data obtained from a published clinical study with three brands of CGM systems were used:5 Dexcom Seven® plus third generation (henceforth sensor A), Abbott FreeStyle Navigator® (sensor B), and Medtronic MiniMed Guardian® REAL-Time System with Enlite® Sensor (sensor C). Note that the purpose of this article is not to compare the accuracy and precision of the three brands of sensors. Newer generations of the sensors, for which all the presented analyses could be done as well, are generally expected to provide lower MARD values, but the effect of uncertainties in the MARD computation could become even more pronounced (see the discussion section).
Methods and Results
Computation of the MARD
The MARD is based on the comparison between paired measurements of a given CGM system and a reference method. MARD is computed as mean value of the absolute relative difference (ARD) where yCGM is the value measured by the CGM device, yref is the value measured by the reference method and are the times when reference measurements are available:
The number N of paired measurements used to compute the value of MARD is limited to limit the burden of the patient, and the actual distribution is left to the study designer, but there is a consensus that more points should be acquired during phases in which blood glucose (BG) changes rapidly. One guideline for the evaluation of CGM systems published by the CLSI (POCT05-A, 2008)16 suggests a distribution of measurements that prioritizes the swing phases. It also recommends having a reasonable number of paired measurements in hypo-, eu-, and hyperglycemia (<70, 70-180, >180 mg/dl).
The computational procedure of MARD also shows the factors that affect its performance:
MARD is computed over a limited number of points, but a mean value converges to the real one only for large samples. This is hardly the case for MARD, as the reference values cannot be measured very frequently during the entire study length. This is especially annoying in the case of CGM sensors, because a large part of the information they collect cannot be used in the evaluation as paired reference values are missing.15
If the number of points is limited, the distribution of the considered points should be representative for the expected use.
MARD does not compare with the “real” value but with a reference method contributing its own error, which is then also added to the CGM sensor error.
CGM and most reference methods measure in different compartments, and this leads to differences that stem not from a lack of accuracy but rather from the physiological effect, for example of a time delay.
In the following, we shall discuss their possible impact more precisely.
MARD and the Number of Paired Points
The impact of study conditions on MARD is known; however, it appears to be widely ignored. Until now, no standardized experimental study protocol has been established that would enable reliable comparison of the MARD data obtained in different studies. Therefore, comparability of MARD data obtained in different studies has been difficult to date. However, the Clinical and Laboratory Standards Institute (CLSI) published guideline POCT05-A, which recommends basic parameters of testing protocols. Certain aspects are defined, such as testing at rapid glucose changes and at various glucose concentrations. Other aspects, however, are not defined well enough to provide adequate comparability, such as the percentage of results in specific rate of change or glucose concentration categories. While it recommends a fixed measurement frequency of once per 15 minutes, which certainly can be achieved over extended periods of time,4 it places a heavy burden on both patients and personnel and may hinder any evaluation over the entire sensor lifetime as specified by the manufacturer (up to 14 days).
Indeed, the impact of the clinical protocol on the MARD value and, more in general, on the performance assessment, has many facets. The simplest one is the fact that the computation of MARD, like all averaging methods, provides a reliable value only if the number of data points is sufficiently high.
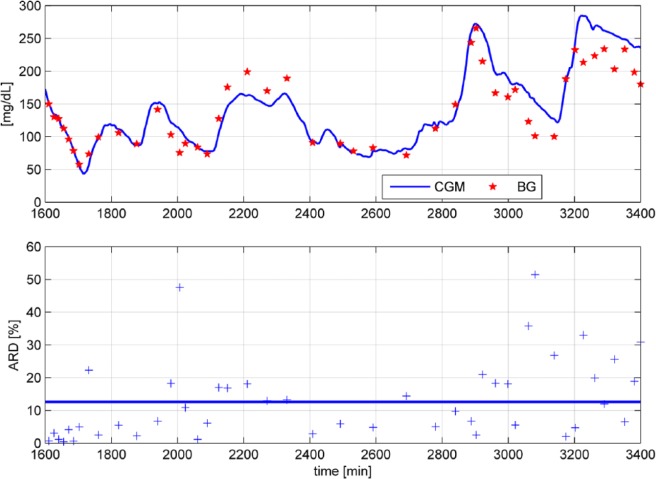
To corroborate this, Figure 1 shows the ARD values of a portion of data recorded in Freckmann et al.5 There are two very high ARD values >40% (at time t = 2007 min and t = 3081 min) while the overall MARD (blue solid line) is at 12.6%. If these two unusually high values are removed as outliers, MARD would drop from 12.6 to 12.2%.
Figure 1.
ARD values of a portion of data5 shown for every paired measurement (+ symbol).
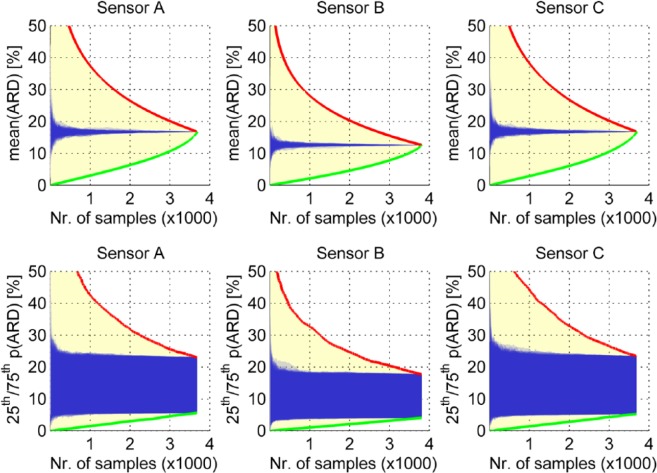
Of course, the opposite is also possible—removing low ARD values will cause the MARD to rise. Both situations are possible if no CGM values are available (sensor dropouts) at the times when reference measurements are recorded. More generally, we can consider two limit cases shown in Figure 2.
Figure 2.
Effect of the number of measurements on the MARD illustrated for the aggregated measurements from Freckmann et al.5 The abscissa shows the number of retained pairs from the study, over all patients. Any MARD value between the red and green borderlines is possible, but we expect the real values to lie inside the blue shaded region. Top panels show the mean of all ARDs, bottom panels show the 25th and 75th percentiles of all ARDs.
Best possible MARD values: removing the worst ARD values one after the other from the MARD computation (green lines in Figure 2)
Worst possible MARD values: removing the best ARD values one after the other (red lines in Figure 2)
In other words, discarding the smallest or the largest 1000 ARD values would lead to a value of, say, 17% or 7%—without changing anything at the setup and for the very same sensor. Of course, these extreme cases hardly ever occur. Figure 2 also shows in blue a “likely” value obtained by Monte Carlo simulations (100 simulations were done) in which the selection of ARD values for removal from the original data set was done randomly. By doing this simulation, we obtain 100 traces of MARD values, each for any selection of the number of samples between one and the total available number. The displayed blue curves are all those 100 traces plotted on top of each other. In the top plots we show the mean value of the ARD values, that is, for all available paired points (to the very right of the individual plots); this results in a single number. In the bottom plots we emphasize the variability of the MARD computation by showing the 25th and 75th percentiles of the ARD values, that is, for all available paired points (to the very right of the individual plots); this is the interval inside which 50% of the ARD values can be found.
It is important to notice how the uncertainty increases more quickly when the number of samples decreases.
MARD and the Distribution of the Paired Points
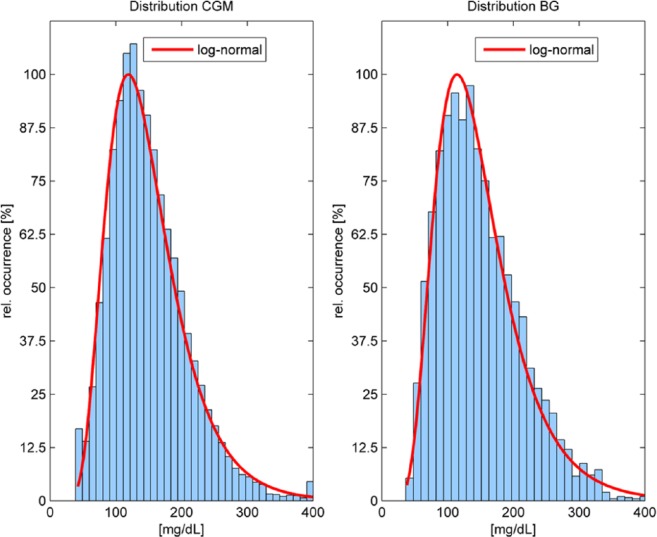
If a limited number of data points is used, the outcome of the MARD computation strongly depends on which points are taken, for example, in which phases they are measured. In our data set,5 both the CGM measurements as well as the reference BG values results have a distribution that can be very well approximated with a log-normal distribution (see Figure 3). This might not be the case if only a few paired points are available. Notice that this study used approximately 2400 paired points and the MARD value is close to the ones of similarly large studies. In Luijf et al,11 only 272 paired points were used, which yielded a significantly higher value. This is, of course, no proof that the smaller number of paired points is the cause of the difference—even a small number of points could accidentally yield the right value, but it is unlikely.
Figure 3.
Distribution of (paired and unpaired) CGM values obtained with sensor A (left, 237.924 data points) and distribution of paired blood glucose values used for evaluation (right, 4757 data points). Y axis has been normalized with respect to the maximum frequency of occurrence.
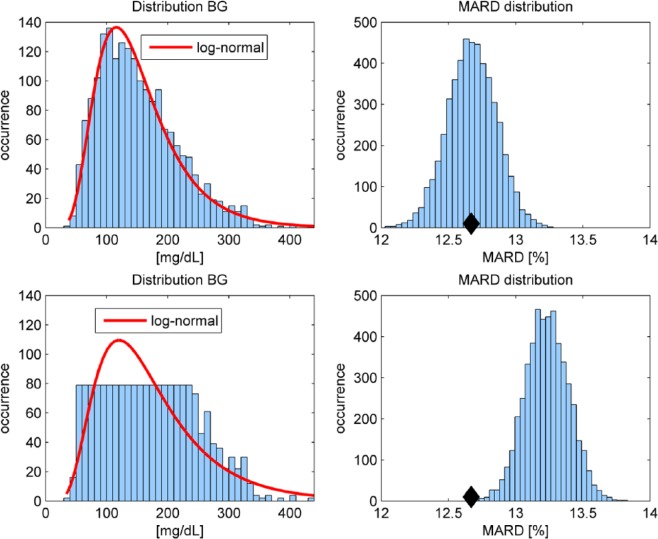
We analyze the effect of a different distribution by retrospectively removing several of the paired reference measurements. This is illustrated in Figure 4 for sensor B. Starting from initially 3839 available paired points, we randomly choose half of them to be removed from the MARD computation in two different ways: (1) such that the remaining paired reference values still form a log-normal distribution (see the top-left plot in Figure 4) and (2) such that the remaining reference values are (approximately) uniformly distributed (see the bottom-left plot in Figure 4), which means that there is approximately the same number of reference pairs in all glucose ranges.
Figure 4.
Distribution of reference values: Top plots show log-normal distribution (half of the originally available measurements) and resulting MARD (right). Bottom plots show uniform-like distribution and resulting MARD (right). The black diamond indicates the MARD computed with all available paired points.
Since the results will depend on the particular points that were removed from the original data set, we repeat this random point removal in total 5000 times (i.e., we performed a Monte Carlo experiment) and obtained 5000 data sets for the log-normal and 5000 for the uniform distribution. Then, for every data set a MARD value was computed and graphically evaluated in a histogram, shown in the right plots of Figure 4. It can be clearly seen that in the case of a log-normal distribution, the MARD is distributed normally around the nominal value (indicated by a black diamond when all 3839 available data points are used). In the case of the uniform distribution, the corresponding MARD values are all shifted to the right (see the bottom-right plot in Figure 4). This effect can be explained by the distinct performance of CGM sensors in different BG ranges. Leaving out a significance portion of data in the euglycemic area where the sensors are typically performing well increases the MARD. More precisely, 63.12% of paired references are in the range 70-180 mg/dL in the case of all available measurements, but only 39.59% (on average) in the case of the uniform distribution, while for the log-normal distribution with reduced sample size 63.15% are retained. Also in this experiment, similar to Figure 2, only mean ARD values are presented.
MARD and Reference Method
One factor seemingly ignored in many MARD studies is the choice of the comparison method for glucose measurement. All such methods used in practice have a measurement error of their own; however, the magnitude of this error differs massively between reference methods of highest metrological order, laboratory methods (like the Yellow Springs Instrument), and, for example, meters used for patients self-monitoring of blood glucose (SMBG).17 The latter also differ significantly themselves in their measurement error.18 As this error is included in the computed MARD value but has no relationship to the CGM system studied, it is important to know this error to be able to make a statement about the real accuracy of the CGM system. The importance of a good comparison method for MARD evaluations becomes more pertinent when the accuracy of the CGM systems studied improves from one generation to the next one.
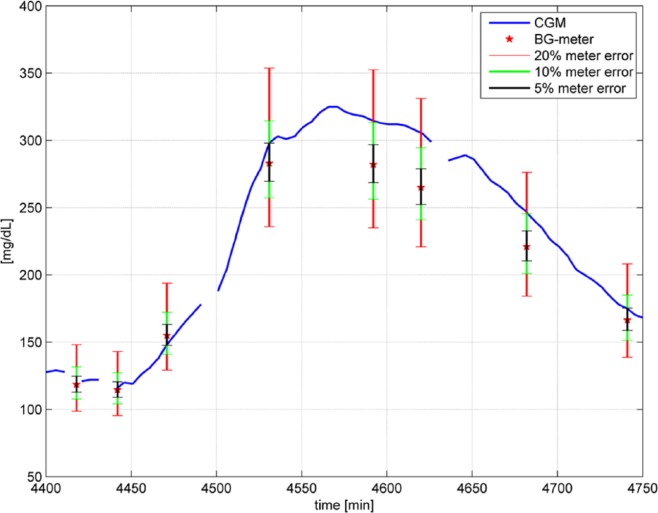
To appreciate the extent of this possible error, Figure 5 shows a portion of the available study data including one of the six CGM traces and the available comparison measurements (BG meter values) in this time period with the considered study data. In the clinical data set used for analysis,5 two BG meters (the built in meters of the two sensors B) were used to obtain reference values. According to the protocol, two measurements were performed and only used further if their deviation was within an 10% interval. Otherwise, another pair of measurement was performed. The actual reference value used is the mean value of both measurements. Figure 5 shows also the uncertainty regions with a confidence interval of 95% assuming a measurement error of 20%, which is the requirement of ISO 15197:2003 (red interval), 10% (green interval), and 5% (black interval), that is, the “true” glucose value could be anywhere inside the intervals.
Figure 5.
Portion of measurement from Freckmann et al,5 including BG meter results (red stars) and 5%, 10%, 20% uncertainty intervals when assuming the BG meter value is within 5%, 10%, 20% of the true glucose concentration.
Focusing for instance on the measurement results at time t = 4620 min, the BG meter gives a reading of 265 mg/dL while the CGM system reads 305 mg/dL. This is an ARD of 15.3%. However, according to the measurement error of the BG meter, the real BG value could theoretically be anywhere inside the interval from 221 to 331 mg/dL. In the worst case (221 mg/dL), this would result in an ARD of 38.0%; while in the best case (305 mg/dL), the ARD would be zero.
As MARD is based on the average of single ARD values, the hope is that the errors will cancel each other out—at least to a large extent. This is not always the case, especially for small sets of paired points. To get a general picture, we can consider the two extreme cases between which the final value lies:
Worst case: for each and every pair of measurements (yCGM, yBG), the reference measurement error is assumed to be at its maximum, thus maximizing all individual ARD values
Best case: for each and every pair of measurements, the reference measurement is as close as possible (within the error bounds) to the CGM trace, thus minimizing all individual ARD values
The results of such an analysis are presented in Table 3 assuming a 5% reference measurement uncertainty. Again the limit cases (worst case and best case in Table 3) are hardly likely to occur, but it is important not to overlook the importance of the reference error. In addition to the specific error of the reference method discussed here, the physiological effect when using reference values from different compartments (e.g., using capillary or arterial BG) plays an important role that further complicates comparability among different studies.
Table 3.
Effect of Reference Measurement Uncertainty on the MARD.
| MARD (%) | Sensor A | Sensor B | Sensor C |
|---|---|---|---|
| Published values5 | 16.7 ± 3.8 | 12.4 ± 3.6 | 16.4 ± 6.9 |
| Worst case (5% error) | 22.0 ± 4.4 | 17.6 ± 3.4 | 21.5 ± 5.5 |
| Best case (5% error) | 12.3 ± 4.0 | 8.3 ± 3.3 | 12.3 ± 5.5 |
| Worst case (10% error) | 27.1 ± 4.6 | 22.6 ± 3.4 | 26.5 ± 5.5 |
| Best case (10% error) | 8.9 ± 3.6 | 5.5 ± 2.9 | 9.2 ± 5.1 |
| Worst case (20% error) | 37.5 ± 4.9 | 32.7 ± 3.4 | 36.6 ± 5.5 |
| Best case (20% error) | 4.6 ± 2.8 | 2.5 ± 1.9 | 5.2 ± 4.0 |
MARD and Time Delay Between Data Pairs
An important factor, which is also discussed in the CLSI guideline POCT05-A, is the time delay: The glucose sensor of a CGM system measures glucose in the interstitial fluid (ISF), while venous or capillary blood is usually used as blood sample for the reference measurements. It is well known that during fast BG changes, the glucose concentration in the ISF will lag behind or precede the BG concentration16 in, e.g., capillary blood samples by at least several minutes. In addition to this inevitable delay comes the technological delay of CGM devices because of diffusion processes inside the sensing electrodes and mathematical filtering operations.
Comparison of the data recorded by the CGM system at one point in time with the result obtained using the reference method at the same time are hampered by this total delay. Therefore, better accuracy is obtained when the CGM results are shifted in time for some minutes to reduce the impact of the time delay. POCT05-A suggests procedures to compensate for the time delay when computing MARD, but if this is not done, or done differently, the MARD value obtained might vary significantly. It should be stated clearly in all performance evaluations whether the CGM traces were shifted retrospectively in time or not, since the effect on the resulting MARD can be significant, as the following simulation example demonstrates.
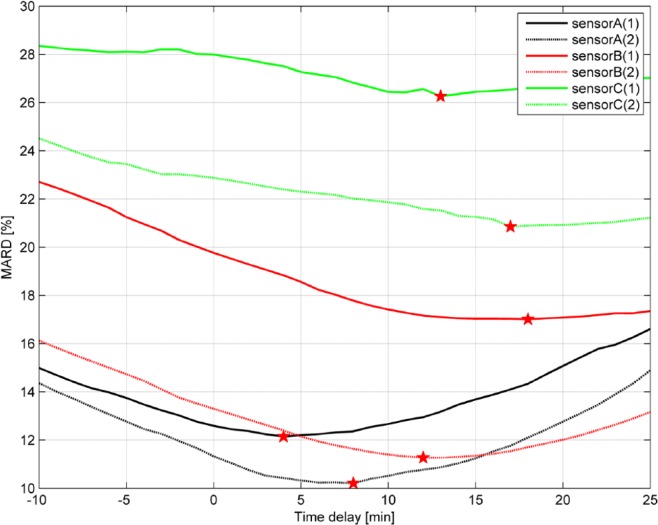
Assuming a pure time delay (no other dynamics) between ISF and capillary glucose, the CGM trace can be shifted in time (hereby varying the delay) to evaluate the MARD as a function of the delay (see Figure 6 where data for all six sensors installed on one patient is shown). As suggested by POCT05-A, the CGM signal was shifted minute by minute forward and backward in time (up to a predefined maximum value set to 25 min) and the resulting MARD value was computed for each time-shift τ:
Figure 6.
MARD as a function of the time delay for all 6 sensors installed on 1 patient.
The actual time delay is given as the minimum value of the function MARD(τ) (indicated by the red stars in Figure 6). The time delay was estimated individually for each patient and sensor.
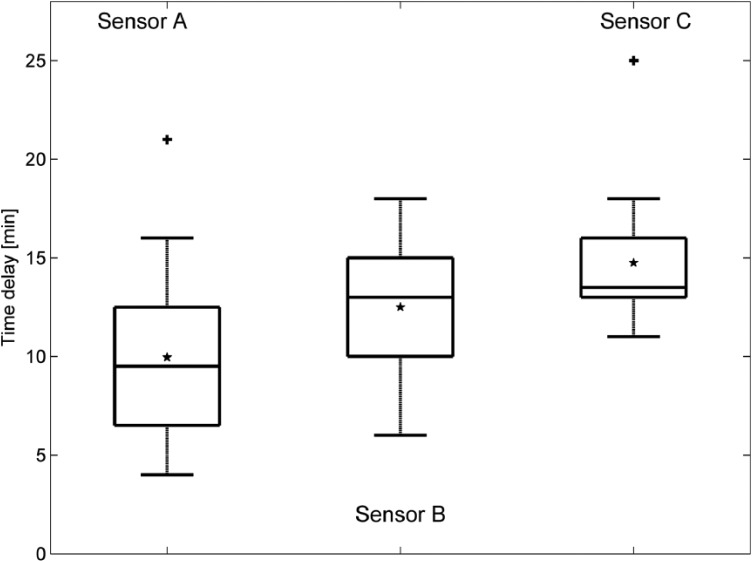
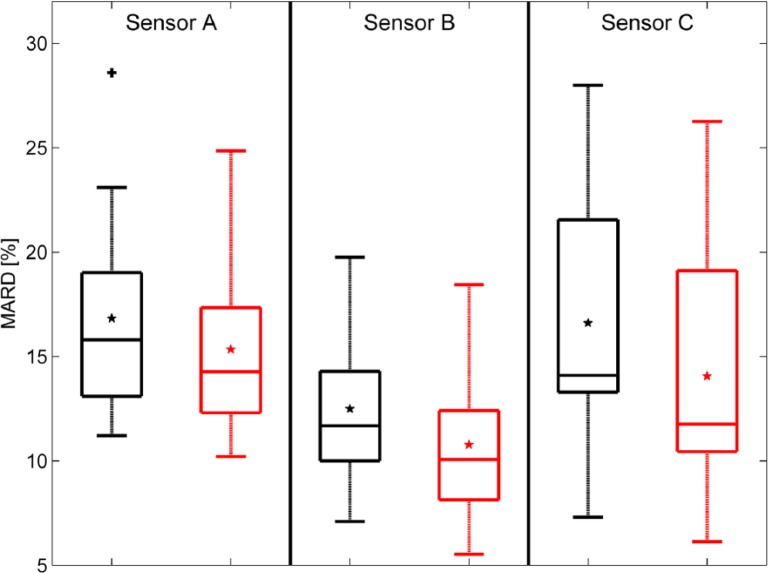
The results of the time delay estimation and the effect on the MARD are summarized numerically in Table 4. Figure 7 shows the estimated time delays for all patients in a box plot: 75% of the values are larger than 6.5/10/13 min (sensor A, sensor B, sensor C), 75% of the values are smaller than 12.5/15/16 min. The values obtained are in line with previously published data.18 All computed values were individually used to shift the corresponding CGM traces and then recompute MARD values. Improvements of the MARD when compensating for the time delay are also presented as a box plot in Figure 8.
Table 4.
MARD When Compensating for the Delay (Mean Values ± 1 SD for the 12 Patients).
| MARD (%) | Sensor A | Sensor B | Sensor C |
|---|---|---|---|
| Baseline | 16.7 ± 3.8 | 12.4 ± 3.6 | 16.4 ± 6.9 |
| Delay τ(min) | 10.0 ± 4.1 | 12.5 ± 3.4 | 14.8 ± 2.9 |
| MARD after correction (τ) | 15.3 ± 3.8 | 10.8 ± 3.5 | 14.1 ± 5.6 |
Figure 7.
Estimated time delays (+ signs represent outliers and * signs represent the mean values, horizontal lines in boxes are median, 25th and 75th percentiles)
Figure 8.
Changes in MARD when compensating for the time delay. Left (black) without, right (red) with time delay compensation (+ signs represent outliers and * signs the mean values, horizontal lines in boxes are median, 25th and 75th percentiles).
Discussion and Conclusions
Just as with many other medical devices used in diabetes care (including BG meters and insulin pumps), there is a need for parameters that help evaluate and characterize the performance of such devices. This is important for the selection of the right device for patients with diabetes but also for other purposes such as reimbursement. There are some strong arguments for using MARD, especially if complemented by PARD,15 because it allows a simple comparison. However, our evaluations make clear that the apparent MARD—the published values—contain not only the “real” MARD—the part related to the sensor performance—but also other effects not related to the accuracy of the sensor itself.
There certainly also may be differences in the “real” MARD values obtained based on differences in the manufacturing of different batches of a given CGM system, as these are still, to a given extent, manufactured manually and, factors including the enzyme activity may vary between batches. As a matter of fact, such differences should be reduced by appropriate calibration of the CGM system during usage; still, some difference in the MARD values could still stem from these factors. Wear time, that is, performance of CGM systems over time of usage, is known to differ. Most systems need one to two days to achieve optimal performance (= lower MARD values) as conditions most probably require a sufficient stability at the tip of the sensor needle in the subcutaneous tissue. The local trauma and the healing/wound reactions clearly have an impact on the measurement results, as well as on the decline of the measurement performance over time. All these factors affect the MARD value, and lead to differences that truly reflect the properties of the device under test and not sensor-independent parameters such as the measurement frequency.
It is also important to note that the MARD value of a CGM system should not depend on the number of paired points or on the time delay compensation. Sensors are constantly improving, so these accidental effects might hide differences in the sensor performance and lead to differences much stronger than those already reported for sensors of the current generation in Table 1.
Concerning the time delay, the compensation clearly reduces the resulting MARD value, and would correspond to the situation in which one is interested in sensor performance defined as to measure the glucose concentration in the immediate surroundings of the sensing element. In practice, however, patients are interested in their current (blood) glucose values, and there is no real benefit of having a very precise sensor with a large delay which cannot be compensated in real time.
We see the clear need for a rigorous study protocol for CGM systems. This could include, for example, the number of reference measurements performed to evaluate performance or the number of measurements that should be performed while subjects are in different glycemic ranges. A simple way to check the distribution of the values in the different glycemic ranges could be to use a similar plot as the one presented in Figure 3. Other measures could also be considered. An additional challenge in developing such a protocol is posed by the fact that different CGM devices have different total wear times, which has to be considered.
In summary, estimation of the MARD is more complex than widely believed, and the authors propose the necessity for establishing a standardized approach for its evaluation that goes significantly beyond what is defined in CLSI.16
Footnotes
Abbreviations: ARD, absolute relative difference; BG, blood glucose; CGM, continuous glucose monitoring; CRC, clinical research conditions; ISF, interstitial fluid; MARD, mean absolute relative difference; PARD, paired absolute relative difference; SMBG, self-monitoring of blood glucose.
Declaration of Conflicting Interests: The author(s) declared the following potential conflicts of interest with respect to the research, authorship, and/or publication of this article: LH is a consultant for a number of companies developing new diagnostic and therapeutic options for diabetes treatment and is a member of a Sanofi advisory board for biosimilar insulins. He is a partner of Profil Institute for Clinical Research, US and Profil Institut für Stoffwechselkrankheiten, Germany. GF is general manager of the Institut für Diabetes-Technologie Forschungs- und Entwicklungsgesellschaft mbH an der Universität Ulm, Ulm, Germany, which carries out studies evaluating BG meters and medical devices for diabetes therapy on behalf of various companies, and has received speakers’ honoraria or consulting fees from Abbott, Bayer, Berlin-Chemie, Becton-Dickinson, Dexcom, Menarini Diagnostics, Roche Diagnostics, Sanofi, and Ypsomed. VL, GS, and MS are full-time employees of Roche Diagnostics.
Funding: The author(s) disclosed receipt of the following financial support for the research, authorship, and/or publication of this article: This work was (partially) funded by Roche Diagnostics.
References
- 1. Damiano ER, McKeon K, El-Khatib FH, Zheng H, Nathan DM, Russell SJ. A comparative effectiveness analysis of three continuous glucose monitors: the Navigator, G4 Platinum, and Enlite. J Diabetes Sci Technol. 2014;8:699-708. [DOI] [PMC free article] [PubMed] [Google Scholar]
- 2. Schmelzeisen-Redeker G, Staib A, Strasser M, Müller U, Schoemaker M. Overview of a novel sensor for continuous glucose monitoring. J Diabetes Sci Technol. 2013;7:808-814. [DOI] [PMC free article] [PubMed] [Google Scholar]
- 3. Bailey TS, Ahmann A, Brazg R, et al. Accuracy and acceptability of the 6-day Enlite continuous subcutaneous glucose sensor. Diabetes Technol Ther. 2014;16:277-283. [DOI] [PubMed] [Google Scholar]
- 4. Damiano ER, El-Khatib FH, Zheng H, Nathan DM, Russell SJ. A comparative effectiveness analysis of three continuous glucose monitors. Diabetes Care. 2013;36:251-259. [DOI] [PMC free article] [PubMed] [Google Scholar]
- 5. Freckmann G, Pleus S, Link M, Zschornack E, Klötzer HM, Haug C. Performance evaluation of three continuous glucose monitoring systems: comparison of six sensors per subject in parallel. J Diabetes Sci Technol. 2013;7:842-853. [DOI] [PMC free article] [PubMed] [Google Scholar]
- 6. Garg SK, Smith J, Beatson C, Lopez-Baca B, Voelmle M, Gottlieb PA. Comparison of accuracy and safety of the SEVEN and the Navigator continuous glucose monitoring systems. Diabetes Technol Ther. 2009;11:65-72. [DOI] [PubMed] [Google Scholar]
- 7. Kovatchev B, Heinemann L, Anderson S, Clarke W. Comparison of the numerical and clinical accuracy of four continuous glucose monitors. Diabetes Care. 2008;31:1160-1164. [DOI] [PMC free article] [PubMed] [Google Scholar]
- 8. Kropff J, Bruttomesso D, Doll W, et al. Accuracy of two continuous glucose monitoring systems: a head-to-head comparison under clinical research centre and daily life conditions. Diabetes Obes Metab. 2015;17:343-349. [DOI] [PMC free article] [PubMed] [Google Scholar]
- 9. Leelarathna L, Nodale M, Allen JM, et al. Evaluating the accuracy and large inaccuracy of two continuous glucose monitoring systems. Diabetes Technol Ther. 2013;15:143-149. [DOI] [PMC free article] [PubMed] [Google Scholar]
- 10. Luijf YM, Avogaro A, Benesch C, et al. Continuous glucose monitoring accuracy results vary between assessment at home and assessment at the clinical research center. J Diabetes Sci Technol. 2012;6:1103-1106. [DOI] [PMC free article] [PubMed] [Google Scholar]
- 11. Luijf YM, Mader JK, Doll W, et al. Accuracy and reliability of continuous glucose monitoring systems: a head-to-head comparison. Diabetes Technol Ther. 2013;15:722-727. [DOI] [PMC free article] [PubMed] [Google Scholar]
- 12. Weinstein RL, Schwartz SL, Brazg RL, Bugler JR, Peyser TA, McGarraugh GV. Accuracy of the 5-day FreeStyle navigator continuous glucose monitoring system: comparison with frequent laboratory reference measurements. Diabetes Care. 2007;30:1125-1130. [DOI] [PubMed] [Google Scholar]
- 13. Zschornack E, Schmid C, Pleus S, et al. Evaluation of the performance of a novel system for continuous glucose monitoring. J Diabetes Sci Technol. 2013;7:815-823. [DOI] [PMC free article] [PubMed] [Google Scholar]
- 14. Rodbard D. Characterizing accuracy and precision of glucose sensors and meters. J Diabetes Sci Technol. 2014;8:980-985. [DOI] [PMC free article] [PubMed] [Google Scholar]
- 15. Obermaier K, Schmelzeisen-Redeker G, Schoemaker M, et al. Performance evaluations of continuous glucose monitoring systems: precision absolute relative deviation is part of the assessment. J Diabetes Sci Technol. 2013;7:824-832. [DOI] [PMC free article] [PubMed] [Google Scholar]
- 16. CLSI performance metrics for continuous interstitial glucose monitoring; approved guideline. CLSI document POCT05-A. Wayne, PA: Clinical and Laboratory Standards Institute; 2008. [Google Scholar]
- 17. Freckmann G, Schmid C, Pleus S, et al. System accuracy evaluation of systems for point-of-care testing of blood glucose: a comparison of a patient-use system with six professional-use systems. Clin Chem Lab Med. 2014;52:1079-1086. [DOI] [PubMed] [Google Scholar]
- 18. Freckmann G, Schmid C, Ruhland K, Baumstark A, Haug C. System accuracy evaluation of 43 blood glucose monitoring systems for self-monitoring of blood glucose according to DIN EN ISO 15197. J Diabetes Sci Technol. 2012;6:1060-1075. [DOI] [PMC free article] [PubMed] [Google Scholar]


