Abstract
Study Objective:
To characterize the association among apnea-hypopnea indices (AHIs) determined using three common metrics for defining hypopnea, and to develop a model to calibrate between these AHIs.
Design:
Cross-sectional analysis of Sleep Heart Health Study Data.
Setting:
Community-based.
Participants:
There were 6,441 men and women age 40 y or older.
Measurement and Results:
Three separate AHIs have been calculated, using all apneas (defined as a decrease in airflow greater than 90% from baseline for ≥ 10 sec) plus hypopneas (defined as a decrease in airflow or chest wall or abdominal excursion greater than 30% from baseline, but not meeting apnea definitions) associated with either: (1) a 4% or greater fall in oxyhemoglobin saturation—AHI4; (2) a 3% or greater fall in oxyhemoglobin saturation—AHI3; or (3) a 3% or greater fall in oxyhemoglobin saturation or an event-related arousal—AHI3a. Median values were 5.4, 9.7, and 13.4 for AHI4, AHI3, and AHI3a, respectively (P < 0.0001). Penalized spline regression models were used to compare AHI values across the three metrics and to calculate prediction intervals. Comparison of regression models demonstrates divergence in AHI scores among the three methods at low AHI values and gradual convergence at higher levels of AHI.
Conclusions:
The three methods of scoring hypopneas yielded significantly different estimates of the apnea-hypopnea index (AHI), although the relative difference is reduced in severe disease. The regression models presented will enable clinicians and researchers to more appropriately compare AHI values obtained using differing metrics for hypopnea.
Citation:
Ho V, Crainiceanu CM, Punjabi NM, Redline S, Gottlieb DJ. Calibration model for apnea-hypopnea indices: impact of alternative criteria for hypopneas. SLEEP 2015;38(12):1887–1892.
Keywords: apnea-hypopnea index, calibration, diagnosis, hypopnea, scoring, sleep apnea
INTRODUCTION
Diagnosis and severity classification of obstructive sleep apnea (OSA) is commonly based on the apnea-hypopnea index (AHI), defined as the number of apnea plus hypopnea events per hour of sleep. Both clinical care and research investigation of OSA have been hindered, however, by a lack of standardization in the definition of hypopnea used in determining the AHI. Although the definition of apnea in adults is fairly uniform across laboratories, accepted definitions of hypopnea vary with respect to the degree of airflow reduction, severity of oxyhemoglobin desaturation, or inclusion of event-related arousals. In 1999, an American Academy of Sleep Medicine (AASM) Task Force recommended that hypopneas be defined based on a reduction in airflow associated with either a 3% decrease in oxyhemoglobin saturation or an event-related arousal.1 Despite this recommendation, interlaboratory variation in the criteria for hypopnea persisted.2 In 2007, the AASM adopted formal guidelines for scoring respiratory events during sleep, although these guidelines allowed for the use of two different hypopnea definitions. The preferred definition, reflecting Medicare reimbursement criteria, required a 30% reduction in airflow in association with a 4% fall in oxyhemoglobin saturation; the alternative definition required a 50% reduction in airflow in association with either a 3% decrease in oxyhemoglobin saturation or an event-related arousal.3 The continued allowance for multiple definitions did little to ensure standardization among sleep laboratories. Several studies have evaluated the concordance of these definitions for the diagnosis of sleep apnea based on threshold values of AHI4–6 or have treated AHI as a continuous measure and assumed a linear association between measures. The true shape of this association has not been explored in detail. Moreover, although the choice of hypopnea has a substantial effect on the magnitude of AHI,4–9 the need to adapt threshold values of the AHI used to diagnose or categorize severity of OSA to the hypopnea definition employed is not reflected in formal diagnostic criteria.
Recently published recommendations of the AASM Sleep Apnea Definitions Task Force10 acknowledge the difficulty in choosing a single best definition for hypopnea, noting in particular the insufficient evidence to favor one particular desaturation threshold over another. Nevertheless, these guidelines recommend a definition of hypopnea requiring at least a 30% decrease in a measure of airflow accompanied by either a 3% decrease in oxyhemoglobin saturation or an event-related arousal. If widely adopted, these recommendations may lead to improved standardization across laboratories. Although the recommendations acknowledge that the choice of hypopnea definition will have a substantial effect on the magnitude of the AHI and that “thresholds for identification of the presence and severity of OSA, and for inferring health-related consequences of OSA, must be calibrated to the hypopnea definition employed,” they provide no guidance on how such calibration should be performed. Our study utilizes polysomnographic data from over 6,000 community-dwelling adults to delineate the association among three commonly used metrics for AHI based on differing hypopnea definitions to address the question of how to relate AHI values based on the newly recommended definition to AHI values from research investigations or clinical sleep studies that have used different event definitions. We present the shape of the association and associated prediction intervals across a broad range of sleep apnea severity and identify the corresponding AHI values across definitions for various commonly used threshold values of AHI.
METHODS
Study Sample
The design of the Sleep Heart Health Study (SHHS) has been published previously.11 Briefly, the SHHS is a prospective cohort study designed to evaluate cardiovascular consequences of OSA. Participants age 39 y and older were recruited from ongoing epidemiologic cohort studies of cardiovascular and pulmonary disease in the United States. The sample includes 6,441 individuals who completed baseline evaluation during the years 1995 through 1998 that included polysomnography, medical history, and sleep habits questionnaires.
Polysomnography
Participants underwent in-home polysomnography using the portable PS-2 system (Compumedics, Abottsville, Australia). The montage included: electroencephalogram, electrooculogram, electrocardiogram, submental electromyogram, finger pulse oximetry, thoracic and abdominal excursion by inductance plethymography, airflow by nasal-oral thermocouple, and body position. Polysomnograms were scored at a central reading center as reported previously.12 For this analysis, three separate apnea-hypopnea indices have been calculated, using all apneas (defined as a decrease in airflow greater than 90% from baseline lasting for least 10 sec) plus hypopneas defined as a decrease in airflow or chest wall or abdominal excursion greater than 30% from baseline with either:
a 4% or greater fall in oxyhemoglobin saturation—AHI4 (corresponding to the preferred hypopnea definition in the 2007 AASM Scoring Manual3;
a 3% or greater fall in oxyhemoglobin saturation—AHI3 (similar to the hypopnea definition available from most portable sleep monitoring devices);
a 3% or greater fall in oxyhemoglobin saturation or an event-related arousal—AHI3a (similar to the hypopnea definition recommended in the 2012 AASM Scoring Manual Update10).
Statistical Analysis
Median values of the three AHI measures were compared using the signed-rank test. For the regression models, the statistical approach consisted of the following sequence of steps: (1) nonparametric estimation of the conditional mean association between each pair of variables using penalized spline smoothing13–17; (2) residuals were estimated by subtracting the nonparametric mean from the original data; (3) the 2.5, 5, 95, and 97.5 percentiles of the residuals were calculated in small adjacent bins, each containing 4% of the data (∼258 observations per bin); and (4) each percentile was then smoothed using penalized spline smoothing and these local smooth quantiles were added back to the smooth conditional mean to form the 90% and 95% prediction intervals, respectively. This procedure was necessary because data exhibit strong heteroscedasticity (variance changes with the value of the predictor) and covariate-dependent skewness of the residuals around the fitted conditional mean. The large number of observations in the SHHS (6,441 subjects) allowed the meaningful binning of the data. Programs were implemented in the R18 statistical language (version 2.15.2) and smoothing was based on the function spm() implemented in the SemiPar19 package. R code is available upon request.
RESULTS
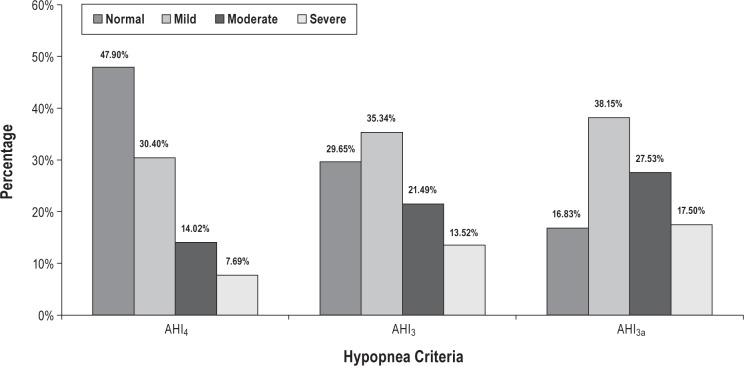
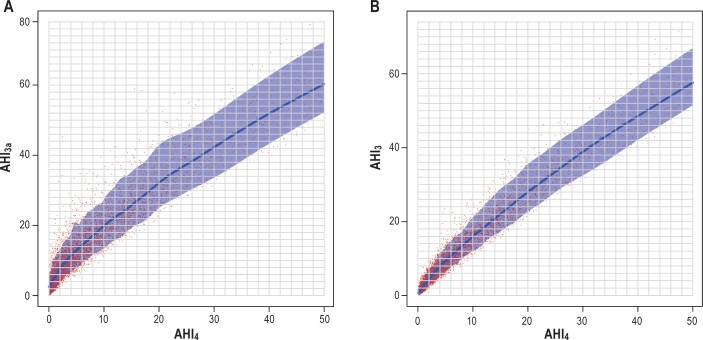
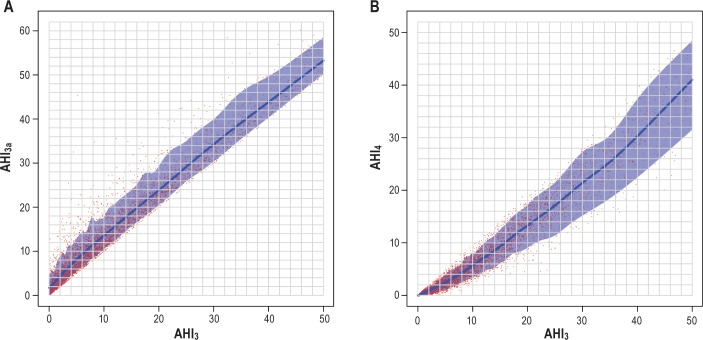
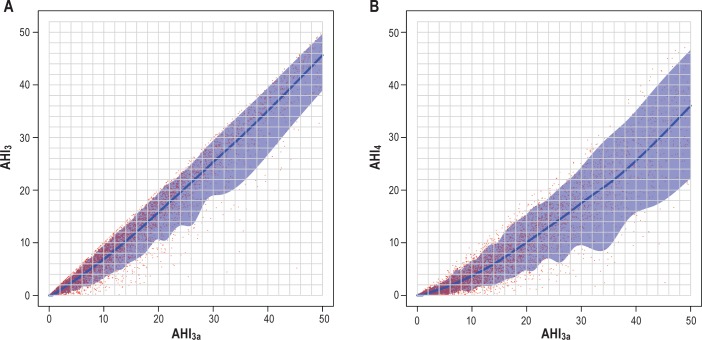
The SHHS database consisted of 6,441 polysomnographic studies for analysis. Characteristics of the participants included in analysis are shown in Table 1. The three methods of scoring hypopneas yielded significantly different estimates of AHI (P < 0.0001 for all pair-wise comparisons). Figure 1 shows the effect of using each AHI definition on the estimated prevalence and severity distribution of OSA based on commonly used threshold values: normal (AHI < 5), mild (5 ≤ AHI < 15), moderate (15 ≤ AHI < 30), and severe (AHI > 30), respectively. The findings are similar to prior analysis of the SHHS database, in which the desaturation or arousal criteria were applied to apneas as well as to hypopneas.4 Results of the regression models are shown in Figures 2, 3, and 4. The predicted values with associated 90% prediction intervals of AHI3a and AHI3 are shown in Figure 2A and Figure 2B, respectively, using values of AHI4 as the reference. The models demonstrate divergence in AHI values among the three methods at low AHI levels; however, the absolute difference in the values stabilizes at higher AHI values, and begins to converge at values of AHI4 > 30. As shown in Figure 3A, AHI3a values exceed AH3 by three to four events per hour over the entire range of AHI3 values > 3. Prediction intervals provide the expected distribution of the predicted AHI values; for example, using Figure 2B, an AHI4 of 10.0 is associated with a predicted AHI3 of 16.0, with a 90% probability that the true AHI3 value falls between 12.1 and 22.1.
Table 1.
Subject characteristics.
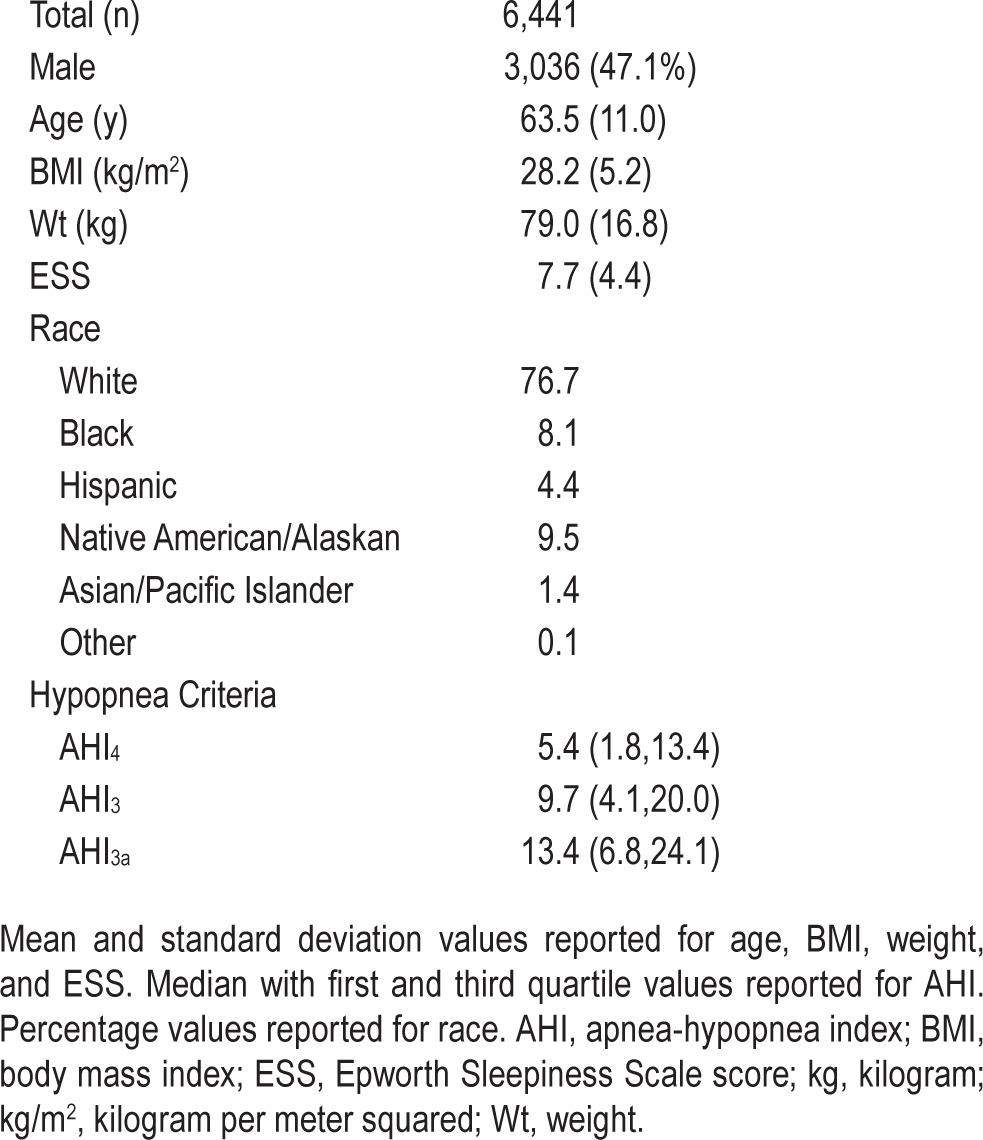
Figure 1.
Distribution of obstructive sleep apnea (OSA) severity using different hypopnea criteria to determine apnea-hypopnea index (AHI). OSA classification: normal AHI < 5; 5 ≤ mild < 15; 15 ≤ moderate < 30; severe ≥ 30.
Figure 2.
(A) Predicted AHI3a with 90% prediction interval using AHI4 referent. AHI3a = apnea-hypopnea index with a 3% or greater fall in oxyhemoglobin saturation or an event-related arousal. AHI4 = apnea-hypopnea Index with a 4% or greater fall in oxyhemoglobin saturation. (B) Predicted AHI3 with 90% prediction Interval using AHI4 referent. AHI3 = apnea-hypopnea index with a 3% or greater fall in oxyhemoglobin saturation. AHI4 = apnea-hypopnea index with a 4% or greater fall in oxyhemoglobin saturation.
Figure 3.
(A) Predicted AHI3a with 90% prediction interval using AHI3 referent. AHI3 = apnea-hypopnea index with a 3% or greater fall in oxyhemoglobin saturation. AHI3a = apnea-hypopnea index with a 3% or greater fall in oxyhemoglobin saturation or an event-related arousal. (B) Predicted AHI4 with 90% prediction interval using AHI3 referent. AHI3 = apnea-hypopnea index with a 3% or greater fall in oxyhemoglobin saturation. AHI4 = apnea-hypopnea index with a 4% or greater fall in oxyhemoglobin saturation.
Figure 4.
(A) Predicted AHI3 with 90% prediction interval using AHI3a referent. AHI3 = apnea-hypopnea index with a 3% or greater fall in oxyhemoglobin saturation. AHI3a = apnea-hypopnea index with a 3% or greater fall in oxyhemoglobin saturation or an event-related arousal. (B) Predicted AHI4 with 90% prediction interval using AHI3a referent. AHI3a = apnea-hypopnea index with a 3% or greater fall in oxyhemoglobin saturation or an event-related arousal. AHI4 = apnea-hypopnea index with a 4% or greater fall in oxyhemoglobin saturation.
Tables of the predicted values and associated 90% and 95% prediction intervals between the three metrics for calculating the apnea-hypopnea indices are included in the supplemental material.
DISCUSSION
Using the large SHHS database, we explored the association between AHI values determined using several different and commonly employed criteria for identifying hypopneas, corresponding to the 2007 AASM Scoring Manual preferred hypopnea definition,3 the 2012 AASM Scoring Manual Update hypopnea definition,10 and the latter definition as applied to portable sleep apnea testing. Similar to prior studies,4,5,7–9 our data demonstrate that estimates of AHI are highly sensitive to the metrics used to define hypopnea. Not previously reported, however, is that the slope of the association changes with increasing AHI, such that the differences in AHI by the three methods is larger at lower AHI levels, and decreases with increasing OSA severity. These data suggest that there is likely to be little reclassification of disease status in individuals with high AHI levels whereas there may be substantial reclassification at lower levels. This underscores the likelihood that individuals with lower AHI levels may be differentially diagnosed and treated according to which AHI is used. In addition to comparing the AHI3 and AHI3a to the recently recommended metric (AHI4), we also compared the former metrics to one another. The differences between these metrics were smaller than when compared to AHI4. We present regression models that can be used to assist clinicians and researchers to more appropriately compare AHI values obtained using differing hypopnea metrics.
There are several limitations to these data. Although full-montage polysomnography was performed in the entire SHHS cohort, there is a greater propensity for sensor loss in the home than the sleep laboratory. Hypopneas were identified based on a reduction in nasal-oral thermal sensor signal or either inductance band of at least 30% from baseline, rather than the currently recommended nasal cannula-pressure transducer system. Previous studies have shown nasal-oral thermal sensors to be less sensitive in identifying flow reduction and therefore would underscore hypopneas when compared to nasal cannula-pressure transducer and the “gold standard”, pneumotachograph.20,21 The use of a thermocouple in the SHHS cohort may have resulted in overall lower AHI score for all participants, but would not be expected to differentially affect the three hypopnea definitions employed in this study, which focus on a comparison of how corroborative levels of desaturation and arousal are applied to the AHI definition. Also, the derivations of the “alternative” AHI definitions used amplitude reductions of 30% rather than 50%. However, amplitude is assessed using noncalibrated sensors and the effect of amplitude differences is likely less than the difference in corroborative desaturation.
These limitations notwithstanding, this analysis provides a detailed comparison of AHI levels expected based on commonly used alternative hypopnea definitions. Even if sleep laboratories adopt uniform scoring rules in the future, there will be a need to compare future studies with earlier studies conducted using different hypopnea definitions. The models presented could give clinicians, researchers and policymakers the means to calibrate AHI thresholds to the event definitions employed. Additionally, this calibration approach can be used by individual laboratories to develop laboratory-specific equations reflecting their specific technology and scoring. The results also underscore the potential to misclassify disease at the lower AHI range when different hypopnea definitions are used.
DISCLOSURE STATEMENT
This was not an industry supported study. This work was supported by National Heart, Lung, and Blood Institute (NHLBI) cooperative agreements U01HL53940 (University of Washington), U01HL53941 (Boston University), U01HL53938 (University of Arizona), U01HL53916 (University of California, Davis), U01HL53934 (University of Minnesota), U01HL53931 (New York University), U01HL53937 and U01HL64360 (Johns Hopkins University), U01HL63463 (Case Western Reserve University), and U01HL63429 (Missouri Breaks Research), which supported the SHHS. Dr. Punjabi has received grant and research support from Resmed and Philips Respironics. Dr. Redline has received grant and research support from Resmed and Philips Respironics. The other authors have indicated no financial conflicts of interest.
ABBREVIATIONS
- AASM
American Academy of Sleep Medicine
- AHI
apnea-hypopnea index
- AHI4
AHI with a 4% or greater fall in oxyhemoglobin saturation
- AHI3
AHI with a 3% or greater fall in oxyhemoglobin saturation
- AHI3a
AHI with a 3% or greater fall in oxyhemoglobin saturation or an event-related arousal
- BMI
body mass index
- ESS
Epworth Sleepiness Score
- OSA
obstructive sleep apnea
Footnotes
A commentary on this article appears in this issue on page 1839.
REFERENCES
- 1.Sleep-related breathing disorders in adults: recommendations for syndrome definition and measurement techniques in clinical research. The report of an American Academy of Sleep Medicine task force. Sleep. 1999;22:667–89. [PubMed] [Google Scholar]
- 2.Manser RL, Rochford P, Naughton MT, et al. Measurement variability in sleep disorders medicine: The victorian experience. Intern Med J. 2002;32:386–93. doi: 10.1046/j.1445-5994.2002.00256.x. [DOI] [PubMed] [Google Scholar]
- 3.Iber C, Ancoli-Israel S, Chesson A, Quan SF for the American Academy of Sleep Medicine. Westchester, IL: American Academy of Sleep Medicine; 2007. The AASM manual for the scoring of sleep and associated events: rules, terminology and technical specifications. [Google Scholar]
- 4.Redline S, Kapur VK, Sanders MH, et al. Effects of varying approaches for identifying respiratory disturbances on sleep apnea assessment. Am J Respir Crit Care Med. 2000;161:369–74. doi: 10.1164/ajrccm.161.2.9904031. [DOI] [PubMed] [Google Scholar]
- 5.Ruehland WR, Rochford PD, O'Donoghue FJ, Pierce RJ, Singh P, Thornton AT. The new AASM criteria for scoring hypopneas: impact on the apnea hypopnea index. Sleep. 2009;32:150–7. doi: 10.1093/sleep/32.2.150. [DOI] [PMC free article] [PubMed] [Google Scholar]
- 6.Guilleminault C, Hagen CC, Huynh NT. Comparison of hypopnea definitions in lean patients with known obstructive sleep apnea hypopnea syndrome (OSAHS) Sleep Breath. 2009;13:341–7. doi: 10.1007/s11325-009-0253-7. [DOI] [PubMed] [Google Scholar]
- 7.Redline S, Sanders M. Hypopnea, a floating metric: implications for prevalence, morbidity estimates, and case finding. Sleep. 1997;20:1209–17. doi: 10.1093/sleep/20.12.1209. [DOI] [PubMed] [Google Scholar]
- 8.Tsai WH, Flemons WW, Whitelaw WA, Remmers JE. A comparison of apnea-hypopnea indices derived from different definitions of hypopnea. Am J Respir Crit Care Med. 1999;159:43–8. doi: 10.1164/ajrccm.159.1.9709017. [DOI] [PubMed] [Google Scholar]
- 9.Manser RL, Rochford P, Pierce RJ, Byrnes GB, Campbell DA. Impact of different criteria for defining hypopneas in the apnea-hypopnea index. Chest. 2001;120:909–14. doi: 10.1378/chest.120.3.909. [DOI] [PubMed] [Google Scholar]
- 10.Berry RB, Budhiraja R, Gottlieb DJ, et al. Rules for scoring respiratory events in sleep: update of the 2007 AASM manual for the scoring of sleep and associated events: deliberations of the sleep apnea definitions task force of the American Academy of Sleep Medicine. J Clin Sleep Med. 2012;8:597–619. doi: 10.5664/jcsm.2172. [DOI] [PMC free article] [PubMed] [Google Scholar]
- 11.Quan SF, Howard BV, Iber C, et al. The sleep heart health study: design, rationale, and methods. Sleep. 1997;20:1077–85. [PubMed] [Google Scholar]
- 12.Redline S, Sanders MH, Lind BK, et al. Methods for obtaining and analyzing unattended polysomnography data for a multicenter study. sleep heart health research group. Sleep. 1998;21:759–67. [PubMed] [Google Scholar]
- 13.Ruppert D, Wand MP, Carroll RJ. Semiparametric Regression. Cambridge: Cambridge University Press; 2003. [Google Scholar]
- 14.Wood SN. Boca Raton, FL: Chapman & Hall/CRC; 2006. Generalized additive models: an introduction with R. [Google Scholar]
- 15.Eilers PHC, Marx BD. Flexible smoothing with B-splines and penalties. Statistical Sicence. 1996;11:89–121. [Google Scholar]
- 16.Crainiceanu CM, Ruppert D, Carroll RJ, Joshi A, Goodner B. Spatially adaptive bayesian penalized splines with heteroscedastic errors. J Comput Graph Stat. 2007;16:265–88. [Google Scholar]
- 17.Crainiceanu CM, Ruppert D, Wand MP. Bayesian analysis for penalized spline regression using winBUGS. J Stat Softw. 2005;14:1–24. [Google Scholar]
- 18.R Core Team, R Development Core Team. Vienna, Austria: R Foundation for Statistical Computing; 2014. R: a language and environment for statistical computing. http://www.r-project.org/ [Google Scholar]
- 19.Wand M. SemiPar: semiparametic regression. R package version. (2014):1.0-4.1. [Google Scholar]
- 20.Norman RG, Ahmed MM, Walsleben JA, Rapoport DM. Detection of respiratory events during NPSG: nasal cannula/pressure sensor versus thermistor. Sleep. 1997;20:1175–84. [PubMed] [Google Scholar]
- 21.Farre R, Montserrat JM, Rotger M, Ballester E, Navajas D. Accuracy of thermistors and thermocouples as flow-measuring devices for detecting hypopnoeas. Eur Respir J. 1998;11:179–82. doi: 10.1183/09031936.98.11010179. [DOI] [PubMed] [Google Scholar]
Associated Data
This section collects any data citations, data availability statements, or supplementary materials included in this article.


