Abstract
The clinical assessment of severity of depressive symptoms is commonly performed with standardized self-report questionnaires, most notably the patient health questionnaire (PHQ-9), which are usually administered in a clinic. These questionnaires evaluate symptoms that are stable over time. Ecological momentary assessment (EMA) methods, on the other hand, acquire patient ratings of symptoms in the context of their lives. Today’s smartphones allow us to also obtain objective contextual information, such as the GPS location, that may also be related to depression. Considering clinical PHQ-9 scores as ground truth, an interesting question is to what extent the EMA ratings and contextual sensor data can be used as potential predictors of depression. To answer this question, we obtained PHQ-9 scores from 18 participants with a variety of depressive symptoms in our lab, and then collected their EMA and GPS sensor data using their smartphones over a period of two weeks. We analyzed the relationship between GPS sensor features, EMA ratings, and the PHQ-9 scores. While we found a strong correlation between a number of sensor features extracted from the two-week period and the PHQ-9 scores, the other relationships remained non-significant. Our results suggest that depression is better evaluated using long-term sensor-based measurements than the momentary ratings of mental state or short-term sensor information.
Keywords: depression, context sensing, ecological momentary assessment, PHQ-9, GPS location
I. Introduction
Depression is a major health concern and a growing problem in the modern society. In the U.S., about 9% of adults suffer from some form of depression [1]. Depression increases the risk of other major medical problems and medical costs, and is a source of pain and suffering for patients and their families. Depression can be effectively treated using psychotherapy or medication, however, there are obstacles for many in obtaining timely treatment. It often takes months or years for depression to be identified and treated in our healthcare system, when it is treated at all, increasing the severity of the problem [2]. The ability to monitor at-risk populations could significantly reduce the time to treatment, reducing people’s misery, improving their health, and reducing medical costs.
In recent years, the pervasive health community has demonstrated the significant potential of using smartphones for delivering mental health care services in real world settings [3-7]. Mental illnesses such as depression present a range of cognitive and behavioral symptoms. Equipped with a variety of powerful sensors, a smartphone is capable of continuously and objectively monitoring an individual’s daily behavior to capture behavioral symptoms revealed in their physical activity, location traces, and social interactions. In the meantime, ecological momentary assessment (EMA) is one of the most popular methods that can be used on mobile devices to solicit momentary self-report of the mental state.
Despite the potential, using smartphone sensors and EMA for mental health care is still in the early stage. The efficacy of smartphone sensors and EMA for mental health care has not been proven yet and remains as a very important research question in the pervasive health community.
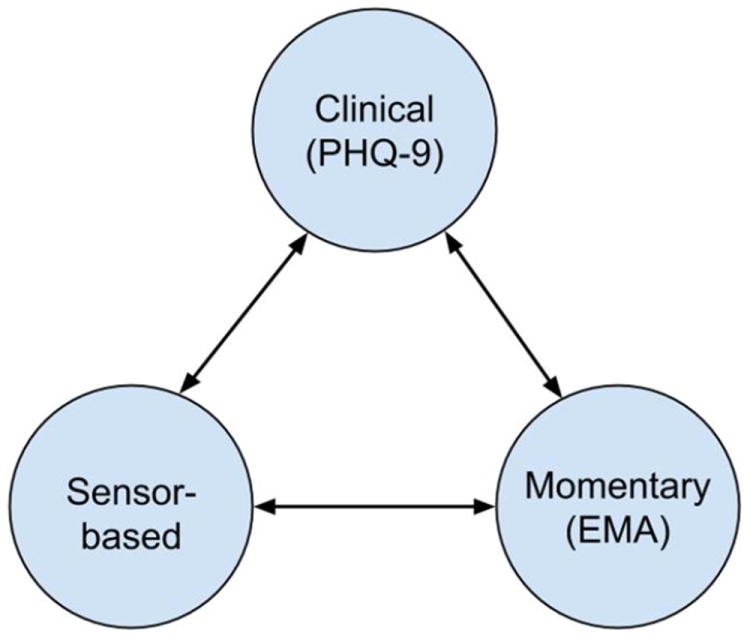
In this study, we focused on using the smartphone technology for the assessment of depression. Specifically, we aimed to validate the efficacy of both EMA and objective smartphone sensor data in identifying the severity of depressive symptoms. To achieve this aim, we collected both EMA and GPS sensor data from 18 participants with different levels of depressive symptom severity using their smartphones for two weeks. We also used Patient Health Questionnaire (PHQ-9), a clinically-established measure of depressive symptom severity, as our ground truth measure [8]. We analyzed the relationship between sensor data, EMA ratings, and the PHQ-9 scores to shed light on the usability of both EMA and objective smartphone sensor information (Fig. 1).
Fig. 1.

The conceptual framework of our study for the assessment of depression.
This study makes two primary contributions. First, we introduce novel GPS sensor features, such as location entropy and circadian movement, which have not been studied before. Second, we provide a comparison between EMA ratings and objective smartphone sensor data based on their correlations with PHQ-9. Our results suggest that EMA data is not a reliable source of information in reflecting patients’ depressive symptom severity. On the other hand, although objective smartphone sensor data on each day has weak correlation with depressive symptoms severity, the accumulated two-week sensor data is a strong indicator.
II. Study Design
A. Participants
We recruited participants using online advertisements. Participants were compensated for $35 per week. In total, 18 participants (12 females) between the ages of 19 and 58 completed the two-week study and contributed good quality data.
B. Clinical Assessment
At the beginning of the study, we asked each participant to complete a demographics questionnaire and undergo a clinical assessment of depression using Patient Health Questionnaire-9 (PHQ-9) [8]. PHQ-9 is an established measure of depressive symptom severity and is used to assist clinicians with diagnosing depression and monitoring the status of depressive patients. PHQ-9 scores range from 0 to 27. Scores of less than 5 indicate no depression, and the scores 5-9 mild depression, 10-14 moderate depression, 15-19 moderately severe, and over 20 severe depression. Out of the 18 participants in our study, 9 had no signs of depression (PHQ-9 <5) and the other 9 were mildly to severely depressed (PHQ-9 >=5). The average PHQ-9 score among all participants was 5.83 and its SD was 5.28.
C. Sensor Data Collection
We developed an open-source Android smartphone application, Purple Robot, to collect smartphone sensor data. Purple Robot is capable of continuously collecting data from a number of smartphone sensors, including the GPS sensor, accelerometer, gyroscope, magnetometer, light sensor, and microphone. Pursuing our needs and the focus of this study, we configured Purple Robot to only collect location data from GPS sensor. The sampling rate of the GPS sensor was set to once every 5 minutes.
Since sensor data may contain sensitive information and to protect privacy, Purple Robot anonymizes the raw data using standard MD5 hashing and AES encryption algorithms. The anonymized data is stored locally on the phone and later transmitted to a secure remote server when WiFi or 3G connection is available.
In our study, we either installed Purple Robot on the participants’ primary phones or gave them study phones (Google Nexus 4) with pre-installed Purple Robot to be used as their primary phones. The data collection started the day after the PHQ-9 score assessment and lasted for the whole two-week study period.
D. EMA Data Collection
We also implemented the EMA mechanism in Purple Robot to obtain momentary ratings from the participants. EMA was prompted twice a day, once in the morning and once in the evening. The EMA contained short questions targeting six common states strongly related to depression. These states included Negative Affect, Hopelessness, Anhedonia (loss of interest), Fatigue/Energy, Loneliness, and Positive Affect. Participants were asked to rate each state on a Likert scale slider ranging from 1 (none) to 7 (extreme).
III. Processing of Sensor Data
The raw GPS sensor data contains geographical coordinates and thus is difficult to interpret and not directly usable. We preprocessed the GPS data and extracted a variety of features so as to transform them into meaningful measures.
A. Data Preprocessing
We used two data preprocessing procedures to facilitate extracting features from the raw GPS sensor data. In the first procedure, we determined whether each location data point came from a stationary state (e.g. working in an office) or a transition state (e.g. walking on the street). Specifically, we estimated the movement speed at each location data point by calculating its time derivative. We used a threshold speed, 1 km/h, to separate the data points belonging to a transition state (speed > 1 km/h) from the ones in a stationary state (speed < 1 km/h).
In the second procedure, we applied an adaptive K-means clustering algorithm to the data points belonging to the stationary state. The goal was to identify the participants’ frequently visited places, such as home, workplaces, parks, etc. Our algorithm used Euclidean distance as the proximity metric in the clustering algorithm to separate GPS location data into different clusters. Furthermore, our algorithm did not have a preset number of clusters. Instead, it started by assuming one location cluster and then increased the number of clusters until the radius of the largest cluster was not bigger than 500 meters.
B. Feature Extraction
We extracted a number of features based on the preprocessed raw GPS sensor data:
Number of Clusters
This feature represents the total number of clusters found by the clustering algorithm.
Location Variance
This feature measures the variability of a participant’s location data from stationary states. LV was computed as the natural logarithm of the sum of the statistical variances of the latitude and the longitude components of the location data:
We applied logarithm to compensate for the skewness in the distribution of location variances across participants.
Entropy
Entropy measures the variability of the time the participant spent at the location clusters. It was calculated as:
where each i represents a location cluster, N denotes the total number of location clusters, and pi is the percentage of time the participant spent at the location cluster i. High cluster entropy indicates that the participant spent time more uniformly across different location clusters, while lower cluster entropy indicates the participant spent most of the time at some specific clusters.
Normalized Entropy
We define normalized entropy by dividing the cluster entropy by its maximum value, which is the logarithm of the total number of clusters:
Unlike entropy, normalized entropy is invariant to the number of clusters and thus solely depends on their visiting distribution. The value of normalized entropy ranges from 0 to 1, where 0 indicates the participant has spent their time at only one location, and 1 indicates that the participant has spent equal amount of time to visit each location cluster.
Home Stay
This feature measures the percentage of time the participant has been at the cluster that represents home. We define home cluster as the cluster, which is mostly visited during the time period between 12am and 6am.
Transition Time
Transition Time measures the percentage of time the participant has been in the transition state.
Total Distance
This feature measures the total distance the participant has traveled in the transition state.
Circadian Movement
This feature measures to what extent the changes in a participant’s location follow a 24-hour, or circadian, rhythm. To calculate circadian movement, we obtained the distribution of the periodicity of the stationary location data and then calculated the percentage of it that falls in the 24±0.5 hour periodicity.
IV. Correlation Analysis Results
We examined the degree of correlation between PHQ-9 scores, location sensor features, and EMA ratings using Pearson’s correlation analysis method. For each relationship, we calculated the Pearson’s correlation coefficient r and its corresponding significance P-value.
A. Relationship between Sensor Features and Clinical Scores
We analyzed the relationship between PHQ-9 scores and GPS sensor features in two different settings.
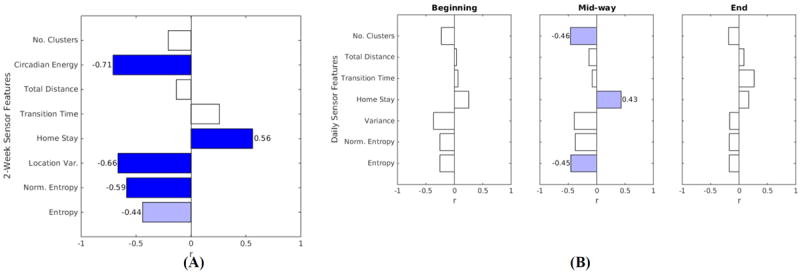
First, we measured the correlation between PHQ-9 scores and GPS sensor features that were extracted from the whole two-week period. The results are shown in Fig. 2A. Among the total of 8 features, 4 features including circadian movement (P=0.001), location variance (P=0.003), normalized entropy (P=0.011) and home stay (P=0.015) show a strong correlation with PHQ-9 scores. The non-normalized entropy feature has a weaker correlation, and other correlations are not significant.
Fig. 2.

Coefficients of correlation (r) between clinical PHQ-9 scores and (A) sensor features calculated over two weeks; (B) sensor features calculated daily. Due to space limitation, we only showed the correlation results of three days out of two weeks: the first day, the middle day, and the last day, as three snapshots. Dark and light blue indicate strong and weak correlations, and blank means no correlation.
The strong negative correlation between circadian movement and the PHQ-9 scores suggests that more depressed individuals tend to have less regular daily-life routines compared to people with milder or non-significant symptoms of depression. The same type of relationship also exists for location variance and entropy, indicating that the diversity of frequently visited places over two weeks is a strong indicator of depression severity. On the other hand, home stay has a significantly positive correlation with PHQ-9 scores, which is not surprising since more depressed people tend to stay more at their home.
In the second setting, we measured the correlation between PHQ-9 scores and GPS sensor features that were extracted from each single day. We excluded circadian m here since this feature measures 24-hour repetition patterns that require at least a couple of days of GPS sensor data. Due to space limitation, we only showed the correlation results of three days out of two weeks in Fig. 2B: the first day, the middle day, and the last day, as three snapshots. As shown, the correlations are mostly non-significant and vary substantially across these three days. This observation indicates that daily feature values are not reliable indicators of the severity of depression.
B. Relationship between EMA Ratings and Clinical Scores
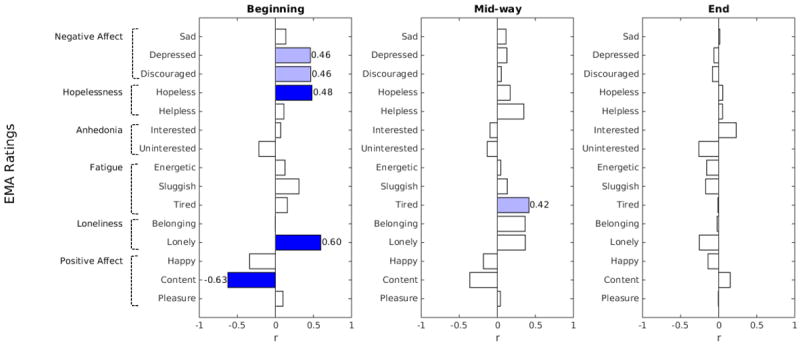
We evaluated the relationship between the EMA ratings from each day and the PHQ-9 scores. The results are shown in Fig. 3 for three days as before. It is notable that on the first day, a few of the EMA ratings that include questions related to Hopelessness, Loneliness, and Positive Affect show a strong correlation with the scores. However, these correlations decline over time. This effect might be due to the fact that the first day is the closest to the PHQ-9 evaluation day. Nonetheless, these daily EMA ratings, at their best, do not show a strong relationship with the clinical scores.
Fig. 3.

Coefficients of correlation (r) between daily EMA question ratings and clinical PHQ-9 scores. The words on the left show the six states strongly correlated to depression. To evaluate each state, 2 or 3 questions (e.g., how sad are you now?) are asked (shown inside the brackets). Dark and light blue indicate strong and weak correlations, and blank means no correlation.
C. Relationship between Sensor Features and EMA Ratings
We evaluated the relationship between daily sensor features and EMA ratings by calculating the one-to-one correlation between the ratings of each day and the features calculated from the same day.
The relationship was in general noisy and did not reveal any significant correlation between any of the features and the EMA states. Furthermore, although in a few cases data from certain subjects was strongly correlated to one of their EMA questions, these were not consistent across the subjects. Therefore, and due to the limited space, we did not illustrate these results.
V. Discussion and Conclusion
We found a much stronger relationship between our location features and clinical PHQ-9 scores compared to the one between these two variables and EMA ratings. There are at least two possible reasons for this. First, what people do may be a better marker of depression than how people say they are feeling, and that behavior can be objectively measured using GPS. Second, the EMA ratings are highly subjective. What one person considers low pleasure or sadness may be different from another, leading to a lack of reliability across participants.
Depressive symptoms tend to change slowly over weeks, showing little day-to-day variation. This may explain why two weeks of sensor feature measurement was more strongly related to the PHQ-9 than either daily sensor features or EMA measures. Unlike EMA ratings, which are momentary, the PHQ-9 assessment reports symptoms over a period of two weeks.
It is important to note potential limitations of this study that need to be addressed in a future work. First, the length of the study was relatively short. Second, we only used the PHQ-9 for the clinical assessment of depression, whereas a number of other methods, such as Beck Depression Inventory (BDI), also exist. Finally, while we only focused on the GPS sensor data, some studies have shown that including multiple smartphone sensors can increase the capacity of contextual information in assessing the clinical states [9].
Our study suggests that it is possible to monitor depression passively using phone sensor data, and in particular, GPS. This has significant public health implications. Most people are unwilling to answer questions repeatedly over long periods of time, while passive monitoring could improve the management of depression in populations, allowing at risk patients to be treated more quickly as symptoms emerge, or monitoring patients’ responses during treatment.
References
- 1.Kessler RC, et al. The epidemiology of major depressive disorder: results from the National Comorbidity Survey Replication (NCS-R) Jama. 2003;289(23):3095–3105. doi: 10.1001/jama.289.23.3095. [DOI] [PubMed] [Google Scholar]
- 2.Wang PS, et al. Failure and delay in initial treatment contact after first onset of mental disorders in the National Comorbidity Survey Replication. Archives of General Psychiatry. 2005;62(6):603–613. doi: 10.1001/archpsyc.62.6.603. [DOI] [PubMed] [Google Scholar]
- 3.Wang R, et al. Student life: assessing mental health, academic performance and behavioral trends of college students using smartphones. ACM International Joint Conference on Pervasive and Ubiquitous Computing; 2014. [Google Scholar]
- 4.Osmani V, et al. Monitoring activity of patients with bipolar disorder using smartphones. ACM Proc. International Conference on Advances in Mobile Computing Multimedia; 2013. [Google Scholar]
- 5.Grünerbl A, et al. Using smart phone mobility traces for the diagnosis of depressive and manic episodes in bipolar patients. ACM Proc. 5th Augmented Human International Conference; 2014. [Google Scholar]
- 6.Grünerbl A, et al. ACM Proc 2nd Workshop on Mobile Systems, Applications, and Services for HealthCare. ACM; 2012. Towards smart phone based monitoring of bipolar disorder. [Google Scholar]
- 7.Burns MN, et al. Harnessing context sensing to develop a mobile intervention for depression. Journal of Medical Internet Research. 2011;13(3):e55. doi: 10.2196/jmir.1838. [DOI] [PMC free article] [PubMed] [Google Scholar]
- 8.Kroenke K, et al. The PHQ-9: validity of a brief depression severity measure. Journal of General Internal Medicine. 2001;16(9):606–613. doi: 10.1046/j.1525-1497.2001.016009606.x. [DOI] [PMC free article] [PubMed] [Google Scholar]
- 9.Voida S, et al. MoodRhythm: Tracking and supporting daily rhythms. ACM Conference on Pervasive and Ubiquitous Computing Adjunct Publication; 2013. [Google Scholar]


