

Abstract
Epithelial ovarian cancer (EOC) is the leading cause of death from gynecologic malignancy, with high mortality attributable to widespread intra-peritoneal (i.p.) metastases. Recent meta-analyses report an association between obesity, ovarian cancer incidence, and ovarian cancer survival, but the effect of obesity on metastasis has not been evaluated. The objective of this study was to use an integrative approach combining in vitro, ex vivo, and in vivo studies to test the hypothesis that obesity contributes to ovarian cancer metastatic success. Initial in vitro studies using three-dimensional meso-mimetic cultures showed enhanced cell-cell adhesion to the lipid-loaded mesothelium. Furthermore, in an ex vivo colonization assay, ovarian cancer cells exhibited increased adhesion to mesothelial explants excised from mice modeling diet-induced obesity (DIO), in which they were fed a "Western" diet. Examination of mesothelial ultrastructure revealed a substantial increase in the density of microvilli in DIO mice. Moreover, enhanced i.p. tumor burden was observed in overweight or obese animals in three distinct in vivo models. Further histological analyses suggested that alterations in lipid regulatory factors, enhanced vascularity, and decreased M1/M2 macrophage ratios may account for the enhanced tumorigenicity. Together, these findings show that obesity potently impacts ovarian cancer metastatic success, which likely contributes to the negative correlation between obesity and ovarian cancer survival.
Keywords: obesity, western diet, fat, metastasis, mesothelium, ovarian cancer, peritoneum, macrophage, vascularity
INTRODUCTION
Ovarian cancer is the leading cause of death from gynecologic malignancy and the fifth leading cause of cancer death in women in the United States, with a lifetime prevalence of 2.5% [1]. The highest rates of disease have been reported in industrialized and northern European countries and incidence is most common in women over age 40 [2–4]. When diagnosed prior to metastatic dissemination, the overall 5-year survival rate is >90%; however the vast majority of women with ovarian cancer are diagnosed with advanced stage disease with intra-peritoneal metastasis already present, resulting in a survival rate of <30% [5–6].
Obesity is a recognized epidemic worldwide. Recent data show that 8 out of 10 Americans are overweight (body mass index, or BMI >25), >35% of women are obese (BMI>30) and 8% of women are extremely obese (BMI>40) [7]. A large number of studies have examined the relationship between obesity and ovarian cancer risk [8–15]. While the study methods and results vary, recent meta-analyses support the finding that increased BMI is associated with enhanced risk of ovarian cancer incidence [12,13]. Similar trends are observed in a smaller study evaluating only African-American women [16]. Furthermore, several meta-analyses also describe an association between obesity and survival in women with ovarian cancer, reporting an adverse effect of obesity on survival [17–19].
The high mortality rate of ovarian cancer is attributable to widespread intra-peritoneal (i.p.) metastasis as a result of direct extension from the primary ovarian or fallopian tube tumor, or from exfoliation and subsequent intra-peritoneal dissemination [20]. Metastasizing ovarian cancer cells adhere avidly to the mesothelial cells that cover peritoneal organs, induce mesothelial cell retraction, anchor, and proliferate to produce secondary lesions [20–22]. The omental fat pad that covers the bowel and the abdominal cavity is the most common site of metastatic colonization, with >60% of newly diagnosed patients displaying omental metastases [6,20, 23–24]. In the omentum, immune aggregates known as milky spots, together with omental adipocytes, promote homing of tumor cells to this tissue whereupon adipocytes contribute to progressive tumor growth [25–28]. Other common sites of metastasis are the ovary and peritoneum, particularly the diaphragm and small bowel mesentery [20]. The accumulation of ascites fluid, frequently in high volumes, provides an additional vehicle for i.p. tumor cell dissemination as well as a depot of soluble factors that influence tumor cell survival.
While the cumulative evidence supports a correlation between obesity and both ovarian cancer incidence and ovarian cancer survival, the influence of obesity on metastasis has not been evaluated. The objective of the current study was to test the hypothesis that obesity contributes to ovarian cancer metastatic success. We have utilized an integrative approach with three distinct murine models combining in vitro, ex vivo, and in vivo studies to address the impact of diet-induced obesity (DIO) on adhesion of ovarian cancer cells to peritoneal mesothelium and on metastatic colonization. Our results demonstrate that increased body fat enhances tumor cell-mesothelial cell adhesion, alters mesothelial ultrastructure, and promotes intra-peritoneal metastatic dissemination. These data suggest that the negative impact of obesity on ovarian cancer survival may be due in part to enhanced metastatic success.
MATERIALS AND METHODS
Reagents
Type I collagen (rat-tail) was obtained from Corning, Bedford, MA. Oleic acid and linoleic acid for lipid loading was obtained from Sigma-Aldrich, St. Louis, MO. Oil red O and Hematoxylin and Eosin (H&E) stains were products of American MasterTech, St. Lodi, CA. Antibodies were purchased from various sources as indicated: proliferating cell nuclear antigen (stains proliferating cells, PCNA, Catalog # NBP1-40761, Novus, Littleton, CO), F4/80 (stains macrophages, Catalog# ab6640, Abcam, Cambridge, MA), and CD31(stains vessels, catalog #ab28364, Abcam, Cambridge, MA). Rat monoclonal anti-Lipocalin 2 (Lcn-2, clone 29) antibody, rabbit polyclonal anti-fatty acid binding protein-4 (FABP4), rabbit polyclonal anti-sterol regulatory element binding protein 1 (SREBP1), rabbit polyclonal anti-inducible nitric oxide synthase (iNOS), rabbit polyclonal anti-Mannose Receptor (CD206), and rat monoclonal anti-CD45R (also known as protein tyrosine phosphatase receptor type C or lymphocyte common antigen; clone RA3-6B2) were purchased from Abcam (Cambridge, MA). All peroxidase-conjugated secondary antibodies (anti-rabbit IgG, anti-mouse IgG, anti-rat IgG) were from Vector Lab, Burlingame, CA. Peroxidase detection system reagents were obtained from BioGenex, Fremont, CA.
Cells
ID8 murine ovarian cancer cells were obtained from Dr. Katherine Roby, University of Kansas Medical Center [29] and were transduced using lentiviral transduction (GenTarget Inc., San Diego, CA) to express red fluorescent protein (designated ID8-RFP). Cells were maintained in Dulbecco’s Modified Eagle Medium (DMEM) supplemented with 4% fetal bovine serum (FBS), 1% penicillin/streptomycin, 5 µg/mL Insulin, 5 µg/mL transferrin and 5 ng/mL sodium selenite. SKOVi.p. human ovarian cancer cells were obtained from Dr. Katherine Hale, University of Texas M.D. Anderson Cancer Center (Houston, TX) and were subjected to lentiviral transduction to express RFP to generate SKOVi.p.-RFP. Cells were maintained in 5% FBS, 1% GlutaMax, 1 mM Sodium Pyruvate, 100 U/100ug Penicillin/Streptmycin, 1% NEAA, and 10 mM HEPES in RPMI 1640 medium. Human OVCA433 ovarian cancer cells were obtained from Dr. Robert Bast, Jr., M.D. Anderson Cancer Center, Houston, TX and were maintained in MEM (Gibco Invitrogen, Carlsbad, CA), 10% fetal bovine serum (Gibco Invitrogen), penicillin/streptomycin (Gibco Invitrogen), amphotericin B, (Cellgro by Mediatech), non-essential amino acids (Cellgro by Mediatech, Herndon, VA), and sodium pyruvate (Cellgro by Mediatech. Cells were labeled with CellTracker Green (5-Chloromethylfluorescein Diacetate, or CMFDA; Life Technologies Inc., Grand Island, NY) by incubation for 30 min at 37 °C. SKOVi.p. and OVCA433 cell lines were tested and authenticated by Genetica DNA Laboratories using short tandem repeat (STR) DNA profiling and were found to be 95% and 100% concordant, respectively. Primary human peritoneal mesothelial cells were derived from patients undergoing bariatric surgery or lean controls and were obtained from Zen-Bio, Research Triangle Park, NC and were maintained in M199 medium with supplemented with 5% fetal bovine serum and penicillin/streptomycin. LP9 human peritoneal mesothelial cell line was obtained from Coriell Aging Cell Repository, Camden, New Jersey and maintained in a 1:1 ratio of Medium 199 (M199, Earle's) with Ham's F12 (Gibco) supplemented with 15% FBS, 10ng/mL epidermal growth factor (EGF, Sigma), 400ng/mL hydrocortisone, 1% Penicillin/Streptmycin, 1% GlutaMax (Gibco) and 10 mM HEPES.
3-Dimensional Meso-Mimetic Adhesion Assay
Human peritoneal mesothelial cells were grown as above or lipid-loaded according to previously described protocols. Briefly, stock solutions of oleate and/or linoleate were conjugated to albumin and cells were cultured in media containing 0.3 mM oleate and 0.3 mM linoleate or BSA alone for up to 10 days with daily replacement of medium [30]. Lipid uptake was demonstrated by fixing cells in 4% paraformaldehyde followed by staining with Oil Red O (0.5%, 20 min, room temperature). Control and lipid-loaded mesothelial cells were used to generate meso-mimetic cultures comprised of 3-dimensional type I collagen gels containing embedded human fibroblasts overlaid with a monolayer of mesothelial cells as described [31,32]. Meso-mimetic cultures were incubated with fluorescently tagged ovarian cancer cells (OvCa 433 or SKOVi.p., 1×10⁵ cells, 2 h, 37°C), washed with PBS, and adherent cells quantified using fluorescence microscopy.
Ex vivo Peritoneal Explant Assay
To evaluate adhesion to intact peritoneal mesothelium, an ex vivo peritoneal explant assay was utilized [32,33]. An optically clear solid support was prepared using Sylgard® 184 silicone elastomer kit (Fisher) according to manufacturer’s specifications. Mice were first euthanized by CO2 inhalation followed by cervical dislocation, then rapidly dissected using a ventral midline incision. After skin removal, the parietal peritoneum lining the ventral abdominal wall was dissected to remove a ~ 1.2×1.2 cm2 square of peritoneal tissue immediately adjacent to the midline in the lower two abdominal quadrants. The tissue explant was then pinned mesothelial-side up to the silastic resin using fine gauge dissecting pin and the explant immersed in PBS. Tissue integrity is maintained for up to 48 h. Fluorescently tagged ovarian cancer cells (2.5 × 10⁵ cells/ml) were added to the explant in culture medium (2.5 ml) and allowed to adhere for 0.5–2 h prior to gently washing and processing the explant for fluorescence microscopy using an EVOS FL microscope or scanning electron microscopy (below).
Murine Ovarian Cancer Metastasis Models
Three distinct animal models were utilized in this study; two diet-induced obesity (DIO) models in female athymic nude mice (nu/nu; Charles River) or C56BL6 mice (Jackson Laboratories) and one genetic obesity model in female leptin mutant ob/ob mice (B6.Cg-Lepob/J; Jackson Laboratories). Cohort one was a DIO cohort comprised of two groups of nu/nu mice (n=13 per group) fed either control diet (control; Research Diets #98121701) or western diet (western; Research Diets #D12079Bi, 40% fat) for 16 weeks. Nude mice were maintained in temperature controlled housing at 84°F, 27% humidity. Cohort two was a DIO cohort comprised of two groups of C56BL/6 mice (n=10 per group) fed either control or western diet for 26 weeks. Cohort three was a genetic obesity cohort comprised of two groups of mice (n=10 per group): B6.Cg-Lepob (designated ob/ob) or wild type BL6 colony controls were both fed a diet of normal mouse chow for 13 weeks. Animals in all cohorts were weighed bi-weekly or weekly until a statistically significant difference in group weight within the cohort was achieved [Suppl. Fig. 1]. Each cohort study was performed in duplicate. All animal procedures were conducted in accordance with University of Notre Dame or University of Missouri Institutional Animal Care and Use Committee regulations.
To evaluate intra-peritoneal (i.p.) metastatic colonization, mice in each cohort were injected i.p. with ovarian cancer cells. Nude mice in cohort one were injected with SKOV3i.p-RPF (5×10⁶ cells in 2ml PBS) human ovarian cancer cells and allowed to grow for 3 weeks. Animals were euthanized using CO2 anesthesia followed by cervical dislocation and dissected anteriorly along the ventral midline followed by lateral dissection to create two skin flaps. Organs were then dissected individually and visually evaluated for tumor burden. Visible tumors were measured with calipers in the longest direction and designated as small (<2 mm), medium (2–5 mm) or large (>5 mm). C56BL/6 mice in cohort two were injected with ID8-RFP murine ovarian cancer cells (1×10⁷) and allowed to grow for 10 weeks. Ob/ob and control mice in cohort three were injected with ID8-RPF (8×10⁶ in 2 ml PBS) and allowed to grow for 7 weeks. Animals were monitored visually for signs of lethargy and abdominal distension or via live fluorescence imaging using a Bruker Xtreme in vivo imaging system (Bruker Corp., Billerica, MA). When necessary, a depilatory cream was used to remove the hair on the torso and abdomen prior to imaging. Endpoint imaging was performed as described in detail [34]. Briefly, animals were euthanized using CO2 anesthesia followed by cervical dislocation and dissected anteriorly along the ventral midline followed by lateral dissection to create two skin flaps. Prior to dissection, mice were imaged by placing the mouse ventral side downward with skin flaps open to scan organs in situ. Organs were then dissected individually and visually evaluated for tumor burden as described above. Organs were then placed on a template and scanned ex vivo. Tumor burden was quantified from fluorescence images following spectral unmixing using Bruker Multispectral software and ImageJ and reported as relative tumor area/organ surface area [34]. After scanning, organs were flash frozen or fixed in 10% formaldehyde, paraffin embedded and processed for histology and immunohistochemistry as described below.
Scanning Electron Microscopy (SEM)
Peritoneal explants were dissected from the murine ventral surface and either processed directly for SEM or utilized for the ex vivo peritoneal explant assay described above. Tissues were then fixed for SEM (2% glutaraldehyde, 2% paraformaldehyde in 0.1 M cacodylate pH 7.35, 1 h), washed using 2-ME buffer (0.1 M sodium cacodylate pH 7.35 containing 0.13 M sucrose, 0.01 M 2-mercaptoethanol; 3×20 min) and fixed in osmium tetroxide (2% in cacodylate buffer) with microwave processing. After rinsing with cacodylate buffer and washing with ultrapure water (3×5 min), tissues were dehydrated in a graded series of ethanol, subjected to critical point drying, placed on carbon stubs, and sputter-coated with platinum. Samples were examined using a Hitachi S-4700 field emission scanning microscope or a FEI-Magellan 400 Field Emission Scanning Electron Microscope.
Histology and Immunohistochemistry
To visualize lipids in cultured mesothelial cells, cells were fixed in formalin (10%) for 5 min. Fixed cells or frozen sections of tissues were stained with Oil Red O for 6 min at 60°C, washed and conterstained with hematoxylin for 1 min. For H&E staining, tissues were deparaffinized according to standard protocols and stained with H&E according to manufacturer’s specifications. Immunohistochemical analysis was performed on 5 um tissue sections that were deparaffinized. Antigen retrieval was accomplished by heat induction at 99°C in an antigen retrieval solution (10 mM Tris, 1mM EDTA, pH 9.0) for 30 min followed by cooling for 20 min. Immunohistochemical staining with anti-PCNA (1:200 dilution, proliferation marker), anti-CD31 (1:600, vasculature marker), anti-CD45 (1:800, B lymphocyte marker), anti-F4/80 (1:50 dilution, general macrophage marker), anti-iNOS (1:2000, stains M1 polarized macrophages), anti-CD206 (1:64000, stains M2 polarized macrophages), anti-LCN2 (1:1000 dilution), anti-SREBP1 (1:600 dilution) and anti-FABP4 (1:6400 dilution) was performed according to standard procedures. Peroxidase-conjugated secondary antibody with 2-component DAB chromogen detection was used to detect bound antigen. Staining in metastatic tumors was quantified with an Aperio ePathology system and macros built using the Image Analysis Tools package (Aperio, Vista, CA) or by manual enumeration of a minimum of 5 high powered fields/slide. Statistical comparisons were made using student’s t-test or Mann-Whitney U test (Sigmaplot).
RESULTS
All organs within the peritoneal cavity including the omentum are covered with a monolayer of peritoneal mesothelium. Metastasizing ovarian cancer cells adhere avidly to peritoneal mesothelial cells, induce mesothelial cell retraction, and anchor and proliferate within the submesothelial matrix to generate widely disseminated secondary lesions [20–22]. To evaluate the effect of enhanced lipid content on tumor cell-mesothelial cell interaction, primary human peritoneal mesothelial cells were lipid-loaded by culturing in the presence of oleate and linoleate. Staining with Oil Red O demonstrates uptake of lipid by mesothelial cells [Fig. 1A,B]. Lipid-loaded or control mesothelial cells were then assembled into 3-dimensional organotypic meso-mimetic cultures to be used as an adhesive substratum for fluorescently labeled ovarian cancer cells [31,32]. A 1.5–4-fold increase in adhesion of fluorescently labeled ovarian cancer cells to lipid-loaded meso-mimetics was observed relative to control mesothelium [Fig. 1C–F].
Figure 1. Lipid-loading enhances adhesion of ovarian cancer cells to meso-mimetic cultures.
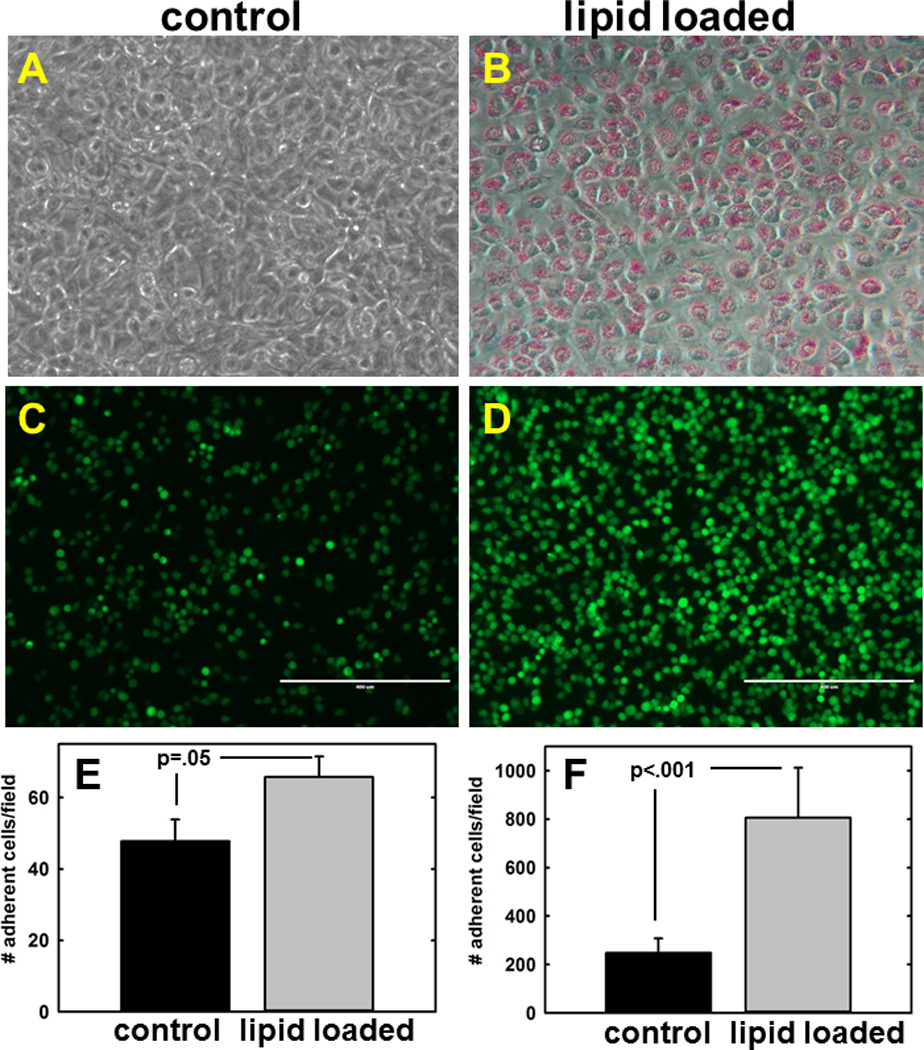
(A,B) Primary human mesothelial cells were cultured for 10d with BSA (control) or oleic+linoleic acid as described in Methods. (C–F) Lipid-loaded mesothelial cells were assembled into 3-dimensional meso-mimetic cultures comprised of fibroblast-embedded collagen overlaid with primary human mesothelial cells. Meso-mimetic cultures were incubated with CMFDA fluorescently tagged ovarian cancer cells (example shows OVCA433; 1×10⁵ cells, 2 h, 37°C), washed with PBS to remove non-adherent cells, and adherent cells quantified using fluorescence microscopy. Scale bar 400 um. (E) Adhesion of OVCA433 cells, p=.05. (F) Adhesion of SKOVi.p. cells, p<.001.
To examine the effect of dietary lipid on mesothelial adhesion in an intact tissue context, a diet-induced obesity (DIO) protocol was employed wherein mice (athymic nude or C57BL6) were fed control chow diet or a “western” diet (40% fat), weighed weekly, and sacrificed when weight differences were statistically significantly different for at least 2 weeks [Suppl. Fig. 1]. Peritoneal tissues were then used for a recently described ex vivo adhesion assay. In this protocol, peritoneum from DIO or control mice was pinned mesothelium-side-up to an optically clear silastic resin prior to incubation with fluorescently tagged ovarian cancer cells. The tissue explant was then washed to remove unbound cells and examined under a fluorescent microscope [32,33]. Significantly enhanced adhesion to peritoneal explants from DIO mice relative to controls was evident when tissue explants were visualized by either fluorescence microscopy or scanning electron microscopy [Fig. 2A–F]. Furthermore, high resolution examination of peritoneal tissues by scanning electron microscopy demonstrated a striking change in peritoneal ultrastructure, with a substantial increase in mesothelial microvilli content in tissue from DIO mice, indicative of a marked increase in mesothelial surface area [Fig. 2G–J].
Figure 2. Obesity alters ovarian cancer cell adhesion to peritoneal explants and peritoneal ultrastructure.
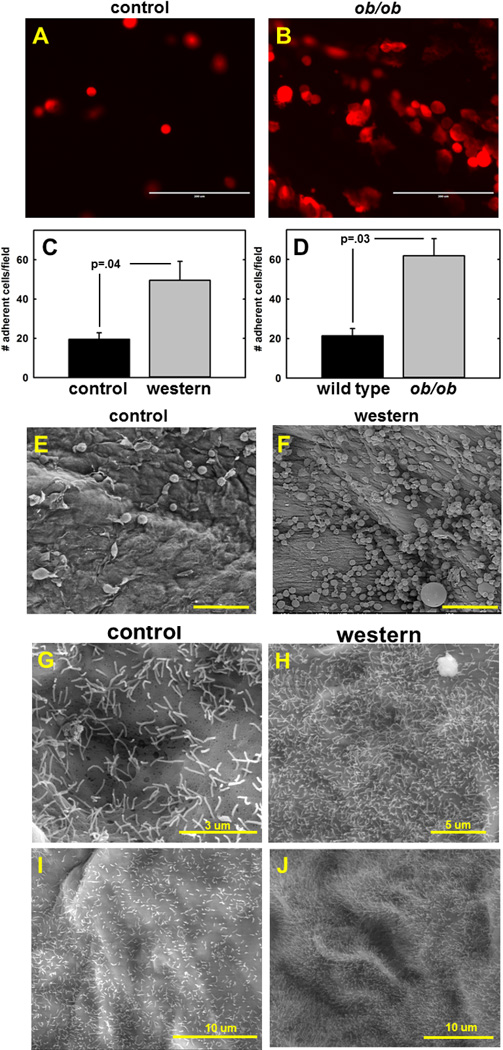
(A–F) Ex vivo analysis of adhesion to peritoneal explants. Peritoneal tissue was pinned mesothelium-up to optically clear silastic resin prior to addition of fluorescently tagged tumor cells (6.25×10⁵) for 2h. After washing to remove non-adherent cells, adherent cells were (C,D) quantified using fluorescence microscopy or (E,F) visualized by scanning electron microscopy. (A,B) Representative results using peritoneal tissue from wild type control vs ob/ob mice and ID8-RFP murine ovarian cancer cells are shown. Experiments was performed in triplicate. Scale bar, 200 um (C) Quantitation of results from adhesion of ID8 murine ovarian cancer cells to peritoneum from C57Bl/6 mice fed a control or western diet. (p=.04). (D) Quantitation of results from adhesion of ID8-RFP murine ovarian cancer cells to peritoneum from wild type control C57Bl/6 mice or ob/ob mutant mice (p=.03). (E,F) Scanning electron micrographs of peritoneal tissue from control or DIO nude mice incubated with SKOVi.p. human ovarian cancer cells. Scale bar 100 um (G–J) Scanning electron micrographs of microvilli present on peritoneum from nude mice fed (G,I) control or (H,J) western diet.
As ex vivo adhesion to tissue explants supported in vitro meso-mimetic data and suggested an effect of DIO on mesothelial adhesion, in vivo models of ovarian cancer metastasis were examined. In initial experiments, nude mice were placed on a DIO protocol wherein they were fed a control or western diet, as above, prior to i.p. injection with SKOV3i.p. human ovarian cancer cells. Tumor burden was quantified after 3 weeks by necropsy, counting and measurement of tumor size with calipers. At the time of injection, a 2.2 g difference in average cohort weight was observed [Suppl. Fig. 1] (p=.005). Intra-peritoneal implants on all organs (liver, stomach, omentum, diaphragm, intestine, colon, mesentery, spleen) were enumerated, measured with calipers in the longest direction and characterized as small (<2 mm), medium (2–5 mm), or large (>5mm). In the DIO cohort, the fraction of implants categorized as medium or large was enhanced on the omentum, ovaries, and liver relative to cohort controls (70.0%, 100.0% and 59.4% vs 54.0%, 25.0% and 36.4%, respectively).
To confirm these results in a model of syngeneic ovarian cancer, a murine C57BL6 model was utilized for allograft studies. Compared to athymic nude mice, C57BL6 mice have an intact immune system and exhibit larger relative weight differences when fed on the DIO protocol [Suppl. Fig. 1]. To examine the effect of DIO in this model, mice were fed control vs western diet prior to i.p. injection with ID8-RFP murine ovarian cancer cells. At the time of injection, a 5g difference in average cohort weight was observed (p=.001). After 10 weeks, mice were sacrificed and fluorescent tumor implants on i.p. organs imaged in situ and ex vivo. Tumor burden was quantified by spectral unmixing of fluorescent images obtained from individual organs ex vivo and reported as relative tumor area/organ surface area [34]. Fluorescent images from representative control and western diet subjects are shown in Fig. 3A–D and relative tumor burden at each organ site is quantified in Fig. 3E. Results show that DIO leads to enhanced metastatic tumor burden in the omentum and ovaries relative to mice on a control diet. Representative H&E stains from all organ sites show serous histology [Suppl. Fig. 2].
Figure 3. Distribution of metastatic tumor burden in control vs DIO mice.
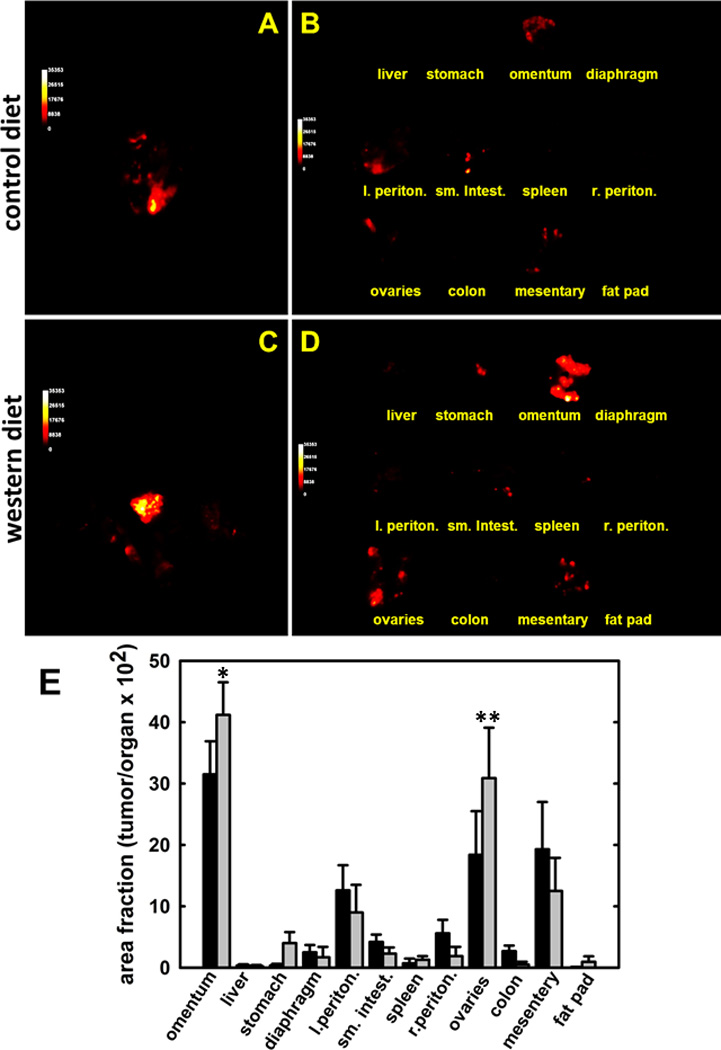
C57Bl/6 mice were fed on control or western diet prior to i.p. injection with 8×10⁶ ID8-RFP cells. Following sacrifice, tumors were imaged (A,C) in situ and (B,D) ex vivo and (E) relative tumor burden (area fraction of tumor/organ) determined as described in Methods. (*p<.07;**p<.05)
The ob/ob mouse arose from a spontaneous mutation in leptin and gives rise to an obese phenotype even on a normal chow diet [35,36]. To examine the effect of marked obesity on i.p. metastasis, ob/ob or control mice were fed a normal chow diet for 6 weeks prior to injection with ID8-RFP murine ovarian cancer cells. At the time of injection, a 38.2g difference in average cohort weight was observed (p<.001). At sacrifice (7 weeks), organs were imaged in situ and ex vivo and tumor burden was quantified as described above. Fluorescent images from representative ob/ob and control subjects are shown in Fig. 4A–D and relative tumor burden at each organ site is quantified in Fig. 4E. Results show that obese ob/ob mice exhibit enhanced metastatic growth at all sites examined, with substantial tumor burden in the omentum, ovaries and mesentery. Representative H&E stains from all organ sites show serous histology [Suppl. Fig. 3]. No significant differences in proliferation are observed between groups, as shown by immunohistochemical staining with proliferating cell nuclear antigen (PCNA) [Suppl. Fig. 4], suggesting an alternative mechanism(s) for enhanced metastatic success in DIO and ob/ob mice.
Figure 4. Distribution of metastatic tumor burden in wild type control vs ob/ob mutant mice.
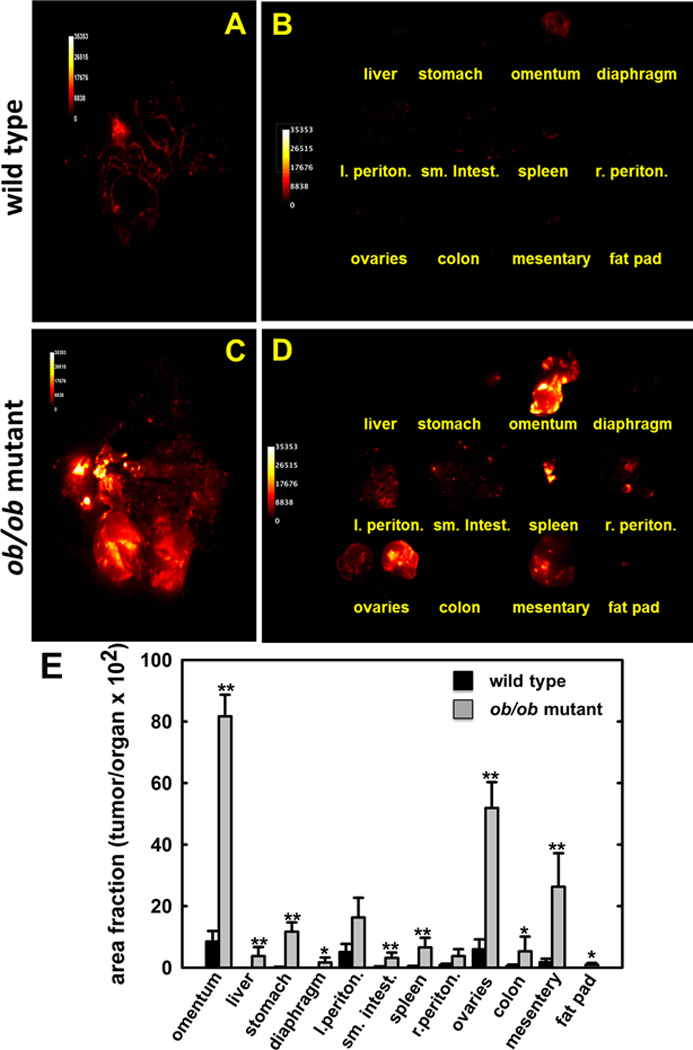
Wild type C57Bl/6 or ob/ob mutant mice were injected i.p. with 8×10⁶ ID8-RFP cells. Following sacrifice, tumors were imaged (A,C) in situ and (B,D) ex vivo and (E) relative tumor burden (area fraction of tumor/organ) determined as described in Methods. (*p<.07;**p<.05)
To examine potential mechanisms by which obesity may contribute to metastatic success, intra-peritoneal metastatic lesions from Cohorts 2 & 3 [C56Bl/6 control diet (CD) vs western diet (WD) and wild type BL6 (WT) vs B6.Cg-Lepob (ob/ob)] were examined by quantitative immunohistochemical analysis. Immunostaining against CD31 demonstrated significantly increased vascularity in lesions from WD and ob/ob mice relative to their respective controls [Fig. 5A–F]. As immune cell infiltration has been shown to both promote and inhibit tumor progression depending on the composition of the infiltrate, inflammatory cell influx was assessed via staining for the pan-B cell marker CD45R. Both WD and ob/ob mice showed an ~3-fold increase in CD45+ lymphocytes relative to CD and WT controls, respectively [Fig. 6A–E]. Interestingly, however, metastatic lesions show decreased overall macrophage infiltration (F4/80 immunoreactivity) in WD and ob/ob mice relative to their respective control mice [Fig. 6F–J]. To evaluate whether this decrease was due to alteration levels of in M1 or M2 polarized macrophages, additional analyses were performed. Similar to results obtained with F4/80, decreased immunoreactivity against iNOS (M1 polarized macrophage marker) was observed in WD and ob/ob mice relative to their respective controls [Fig. 6K–O], while no significant differences in CD206 levels (M2 polarized macrophage marker) were observed among groups [Fig. 6P–T].
Figure 5. Immunohistochemical analysis of vascularity in murine tumor tissues.
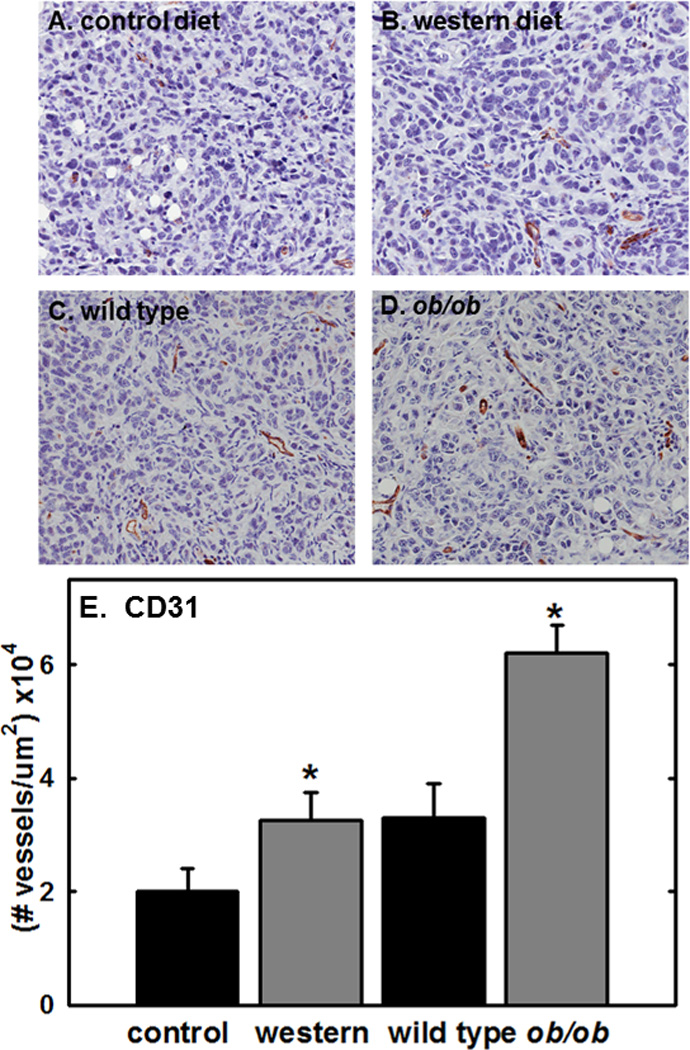
(A–D) Representative images showing vessel staining in metastatic tumors grown in (A) control diet or (B) western diet C57Bl/6 mice or (C) wild type control or (D) ob/ob mutant mice. Tissues were stained for the presence of vessels using anti-CD31 antibody (1:600 dilution), peroxidase conjugated secondary antibody and DAB chromogen detection as described in Methods. tissue. (E) Quantitation of vessel density. Staining was quantified using an Aperio Image Scope digital pathology system as described in Methods. (*p<.05)
Figure 6. Immunohistochemical analysis of inflammatory cells in murine tumor tissues.
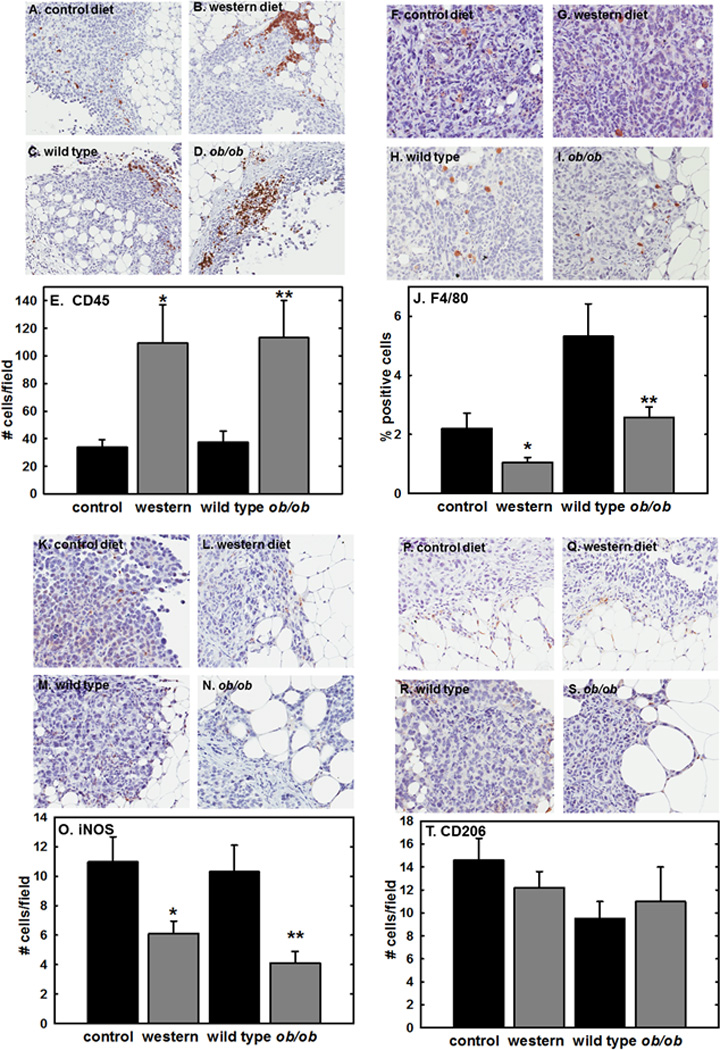
(A–D) Representative images showing B lymphocyte staining in metastatic tumors grown in (A) control diet or (B) western diet C57Bl/6 mice or (C) wild type control or (D) ob/ob mutant mice. Tissues were stained for B lymphocytes using anti-CD45 antibody (1:800 dilution), peroxidase conjugated secondary antibody and DAB chromogen detection as described in Methods. (E) Quantitation of B lymphocytes. Staining was quantified by enumeration of positive cells in a minimum of 5 high powered fields per subject. (*p=.05; **p=.002)
(F–I) Representative images showing macrophage staining in metastatic tumors grown in (F) control diet or (G) western diet C57Bl/6 mice or (H) wild type control or (I) ob/ob mutant mice. Tissues were stained for macrophages using anti-F4/80 antibody (1:50 dilution), peroxidase conjugated secondary antibody and DAB chromogen detection as described in Methods. (J) Quantitation of macrophages. Staining was quantified using an Aperio Image Scope digital pathology system as described in Methods. (*p=.033; **p=.011)
(K–N) Representative images showing M1 macrophage staining in metastatic tumors grown in (K) control diet or (L) western diet C57Bl/6 mice or (M) wild type control or (N) ob/ob mutant mice. Tissues were stained for M1 macrophages using anti-iNOS antibody (1:2000 dilution), peroxidase conjugated secondary antibody and DAB chromogen detection as described in Methods. (O) Quantitation of M1 macrophages. Staining was quantified by enumeration of positive cells in a minimum of 5 high powered fields per subject. (*p=.05; **p=.01)
(P–S) Representative images showing M2 macrophage staining in metastatic tumors grown in (P) control diet or (Q) western diet C57Bl/6 mice or (R) wild type control or (S) ob/ob mutant mice. Tissues were stained for M2 macrophages using anti-CD206 antibody (1:64000 dilution), peroxidase conjugated secondary antibody and DAB chromogen detection as described in Methods. (T) Quantitation of M2 macrophages. Staining was quantified by enumeration of positive cells in a minimum of 5 high powered fields per subject. (differences are not significant).
Previous studies have implicated proteins involved in lipid regulation in the intra-peritoneal growth of metastatic ovarian cancer including the adipokine lipocalin-2 (LCN2) and the lipid transport protein fatty acid binding protein-4 (FABP4) [28, 37]. While Affymetrix-based gene expression profiling of tumors formed in the KpB murine model of ovarian cancer subjected to a high fat diet showed enhanced mRNA expression of LCN2 [37]; we did not observe expression of this adipokine at the protein level in our models [Fig. 7A–D]. FABP4 showed enhanced immunoreactivity in WD and ob/ob mice relative to controls [Fig. 7E–H], with intense staining present in adipocytes and in tumor cells immediately adjacent to adipocytes (see, for example, panel 7F) [28]. Similar patterns were seen with Oil Red O staining of lipids in omental tissues in frozen sections of WD vs CD mice (not shown). As cancer cells engage in extensive de novo lipogenesis, expression of sterol regulatory element-binding protein1 (SREBP1), a transcription factor that functions as a master regulator of lipid metabolism [38] was also examined. SREBP1 staining intensity was highly enhanced in tumors from mice fed a WD relative to CD [Fig. 7I], with tumors in WD mice exhibiting intense nuclear staining [Fig. 7J]. Similar, albeit less intense, staining patterns were observed in tumors from ob/ob relative to WT mice [Fig. 7K,L].
Figure 7. Immunohistochemical analysis of lipid regulatory proteins in murine tumor tissues.
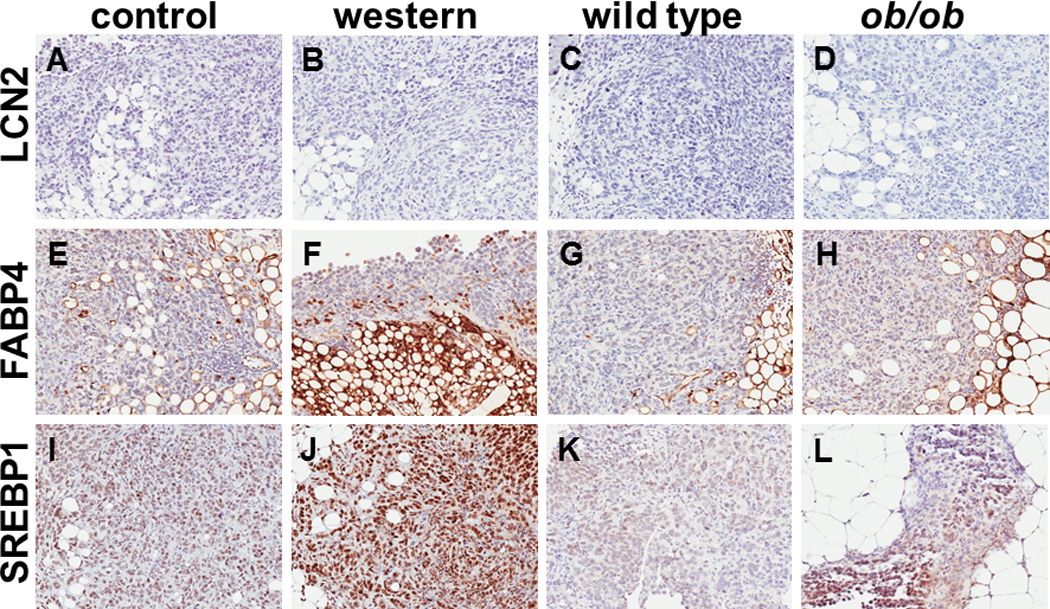
(A–D) Representative images showing lipocalin-2 (LCN2) staining in metastatic tumors grown in (A) control diet or (B) western diet C57Bl/6 mice or (C) wild type control or (D) ob/ob mutant mice. Tissues were stained for LCN2 using anti-LCN2 antibody (1:2000 dilution), peroxidase conjugated secondary antibody and DAB chromogen detection as described in Methods. (E–H) Representative images showing fatty acid binding protein-4 (FABP4) staining in metastatic tumors grown in (E) control diet or (F) western diet C57Bl/6 mice or (G) wild type control or (H) ob/ob mutant mice. Tissues were stained FABP4 using anti-FABP4 antibody (1:6400 dilution), peroxidase conjugated secondary antibody and DAB chromogen detection as described in Methods. (I–L) Representative images showing sterol regulatory element binding protein-1 (SREBP1) staining in metastatic tumors grown in (I) control diet or (J) western diet C57Bl/6 mice or (K) wild type control or (L) ob/ob mutant mice. Tissues were stained for SREBP1 using anti-SREBP1 antibody (1:600 dilution), peroxidase conjugated secondary antibody and DAB chromogen detection as described in Methods.
DISCUSSION
Obesity is a recognized epidemic worldwide and recent meta-analyses have shown that obesity correlates with both ovarian cancer incidence and poor survival [8–19]. Indeed, a growing body of evidence identifies obesity as a risk factor for cancer incidence and mortality in a large variety of malignancies [39]. Using an integrative analysis of three distinct in vivo models together with ex vivo and organotypic data, results from the current study demonstrate that obesity influences ovarian cancer metastatic success. As the high mortality in women with ovarian cancer is directly attributable to widespread i.p. metastasis, these data support a mechanistic link between obesity and poor survival.
In support of the epidemiologic data, it is increasingly recognized that adipose tissue is a key component of the ovarian cancer metastatic microenvironment. Ovarian cancer metastasizes preferentially to the omental fat pad [20,22,24] and omental adipocytes induce growth of ovarian tumor cells in vitro and in vivo via release and transport of free fatty acids, thereby functioning as a lipid reservoir to sustain the high energy demands of cancer cells [28, 40–1]. The current study provides additional mechanistic insight into the enhanced tumor burden observed in intra-peritoneal ovarian cancer xenografts grown in murine models of obesity. In both the DIO and mutational obesity models, our data demonstrate enhanced expression of SREBP-1, a master transcription factor that regulates genes involved in fatty acid synthesis, and thereby controls de novo lipogenesis [38]. SREBP-1 activity is tightly controlled at the post-translational level via trafficking of the membrane-bound transcription factor from the endoplasmic reticulum to the Golgi, whereupon it is cleaved by the subtilisin-like membrane bound serine proteinases site-1 and site-2 [38,42]. This cleavage releases the amino terminus of SREBP-1 for transport to the nucleus where it induces transcription of genes involved in lipogenesis. It is interesting to note that SREBP-1 immunoreactivity in tumors formed in WD and ob/ob mice is predominantly nuclear, supporting a mechanism through which elevated fatty acid synthesis, in addition to fatty acid transport [28], contributes to enhanced growth of peritoneal lesions in models of obesity. This further suggests alternative novel pharmacologic targets including inhibitors of site-1 and site-2 proteinases in control of metastatic tumor growth, particularly in obese women [38,43].
In addition to regulation of lipid-based energy reservoirs, enhanced vascularity was observed in metastatic tumors in DIO and ob/ob mice relative to controls, suggesting that lipid-induced activation of cellular stress pathways contributes to development of a pro-metastatic tumor microenvironment. In this context, pro-angiogenic growth factors such as vascular endothelial growth factor (VEGF) are known to be elevated in overweight and obese individuals [44] and ovarian cancer patients with a high body mass index (BMI) treated with bevacizumab (anti-VEGF antibody) therapy had a shorter progression-free survival compared to women with low BMI [44]. Recent data suggest that B cells also promote angiogenesis in ovarian cancer models [45] and correlate B cell expression with poor survival in women [46]. The current study shows an ~3-fold increase in B cells in tumors grown in DIO and ob/ob mice. Together these data suggest that adiposity warrants further consideration as a prognostic biomarker for patients receiving anti-angiogenic therapy.
In other tumor models, adipose tissue contributes actively to metastatic progression, not only by providing an energy reservoir for anchored tumor cells, but by secretion of pro-inflammatory cytokines (reviewed in [39,40]). An unexpected result from the current study is the decrease in tumor-associated macrophages (TAMs) in metastatic implants in both DIO and ob/ob mice relative to controls. TAMs are the most abundant immune cell type in the ovarian tumor microenvironment and are generally categorized as classically activated or M1-polarized (cytotoxic to tumor cells) and alternatively activated or M2-polarized (growth promoting) (reviewed in [40,47]). Immunohistochemical analyses showed that while levels of M2 polarized macrophages remained relatively constant across cohorts, levels of tumor-associated M1 macrophages were decreased in WD and ob/ob tissues resulting in an overall 1.5–4.2-fold decrease in the M1/M2 ratio in obesity models. To this end, it is interesting that a recent study of TAMs in human ovarian cancers showed a decrease in M1/M2 TAMS with increasing tumor stage that correlated with poor overall survival [48]. Based on the combined evidence, future studies evaluating the potential link between obesity and M1/M2 TAM ratios in human ovarian tumors is warranted.
An additional interesting observation arising from the current study is the striking increase in microvilli present on peritoneal mesothelial cells in mice fed a western diet, which correlates with enhanced tumor cell adhesion. It has been reported that the distribution of microvilli on B cells is modulated in an inducible fashion by T cells and regulates the 3-dimensional surface presentation of receptors important in cell-cell adhesion [49]. Topographical remodeling of microvilli, characterized by altered length, number, and/or clustering, contributes to modulation of leukocyte adhesion under flow [49–51]. As i.p. implantation of metastasizing ovarian cancer cells predominantly occurs within the context of an ascites fluid-filled peritoneal cavity [20,22,32], these data suggest a mechanism whereby diet-induced changes in microvilli topography may contribute to early cell-cell adhesive events in metastatic colonization.
In summary, the current study used an integrative approach to demonstrate that obesity impacts ovarian cancer metastatic success via mechanisms involving lipogenesis and lipid transport, enhanced vascularity, and decreased infiltration of M1 macrophages. In light of the strong pre-clinical and clinical evidence supporting an association between obesity and ovarian cancer incidence [12,13,16], progression [17–19] and metastasis (current report), additional studies investigating obesity as an epigenetic modulator of ovarian cancer are warranted and may provide new targets for dietary or therapeutic intervention.
Supplementary Material
Acknowledgements
This research was supported in part by the Leo & Ann Albert Charitable Trust (MSS); National Institutes of Health grants RO1CA109545 (MSS), RO1CA086984 (MSS), F31CA159804 (LB); and National Science Foundation grant DGE1313583 (EL)
Footnotes
Conflicts of Interest: The authors have no conflicts of interest to disclose.
REFERENCES
- 1.U.S. Cancer Statistics Working Group. Incidence and Mortality Web Based Report. Department of Health and Human Services, Centers for Disease Control and Prevention, and National Cancer Institute; 2014. United States Cancer Statisitics: 1999–2011. [Google Scholar]
- 2.Cramer DW. The epidemiology of endometrial and ovarian cancer. Hematol Oncol Clin North Am. 2012;26:1–12. doi: 10.1016/j.hoc.2011.10.009. [DOI] [PMC free article] [PubMed] [Google Scholar]
- 3.Jemal A, Bray F, Ferlay J. Global cancer statistics. 2011;61:69–90. doi: 10.3322/caac.20107. [DOI] [PubMed] [Google Scholar]
- 4.Siegel R, Naishadham D, Jemal A. Cancer statistics 2013. CA Cancer J. Clin. 2013;63:11–30. doi: 10.3322/caac.21166. [DOI] [PubMed] [Google Scholar]
- 5.American Cancer Society. Cancer Facts and figures. Atlanta: 2013. [Google Scholar]
- 6.Naora H, Montell DJ. Ovarian cancer metastasis: integrating insights from disparate model organisms. Nat Rev Can. 2005:355–366. doi: 10.1038/nrc1611. [DOI] [PubMed] [Google Scholar]
- 7.Flegal KM, Carroll MD, Kit BK, Ogden CL. Prevalence of obesity and trends in the distribution of body mass index among US adults 1999–2010. JAMA. 2012;307:491–497. doi: 10.1001/jama.2012.39. [DOI] [PubMed] [Google Scholar]
- 8.Lahmann PH, Cust AE, Friedenreich CM, et al. Anthropometric measures and epithelial ovarian cancer risk in the European Prospective Investigation into Cancer and Nutrition. Int J Cancer. 2010;126:2404–2415. doi: 10.1002/ijc.24952. [DOI] [PubMed] [Google Scholar]
- 9.Delort L, Kwiatkowski F, Chalabi N, et al. Central adiposity as a major risk factor of ovarian cancer. Anticancer research. 2009;29:5229–5234. [PubMed] [Google Scholar]
- 10.Chionh F, Baglietto L, Krishnan K, et al. Physical activity, body size and composition, and overall risk of ovarian cancer. Cancer Causes Control. 2010;21:2183–2194. doi: 10.1007/s10552-010-9638-y. [DOI] [PubMed] [Google Scholar]
- 11.Yang HP, Trabert B, Murphy MA, et al. Ovarian cancer risk factors by histologic subtypes in the NIH-AARP Diet and Health Study. Int J Cancer. 2012;131:938–948. doi: 10.1002/ijc.26469. [DOI] [PMC free article] [PubMed] [Google Scholar]
- 12.Collaborative Group on Epidemiological Studies of Ovarian Cancer. Ovarian cancer and body size: individual participant meta-analysis including 25,157 women with ovarian cancer from 47 epidemiological studies. PLoS Med. 2012;9 doi: 10.1371/journal.pmed.1001200. [DOI] [PMC free article] [PubMed] [Google Scholar]
- 13.Olsen CM, Nagle CM, Whiteman DC, et al. Obesity and risk of ovarian cancer subtypes: evidence from the Ovarian Cancer Association Consortium. Endocrine-Related Cancer. 2013;20:251–262. doi: 10.1530/ERC-12-0395. [DOI] [PMC free article] [PubMed] [Google Scholar]
- 14.Calle EE, Kaaks R. Overweight, obesity and cancer: epidemiological evidence and proposed mechanisms. Nat Rev Can. 2004:59–591. doi: 10.1038/nrc1408. [DOI] [PubMed] [Google Scholar]
- 15.Protani MM, Nagle CM, Webb PM. Obesity and ovarian cancer survival: a systematic review and meta-analysis. Cancer Prev Res. 2012;5:901–910. doi: 10.1158/1940-6207.CAPR-12-0048. [DOI] [PubMed] [Google Scholar]
- 16.Schildkraut JM, Alberg AJ, Bandera EV, Barnholtz-Sloan J, Bondy M, Cote MJ, et al. A multi-center population-based case-control study of ovarian cancer in African-American women: the African American Cancer Epidemiology Study (AACES) BMC Cancer. 2014;14:688–692. doi: 10.1186/1471-2407-14-688. [DOI] [PMC free article] [PubMed] [Google Scholar]
- 17.Bae HS, Kim HJ, Hong JH, et al. Obesity and epithelial ovarian cancer survival: a systematic review and meta-analysis. Journal of Ovarian Research. 2014;7 doi: 10.1186/1757-2215-7-41. [DOI] [PMC free article] [PubMed] [Google Scholar]
- 18.Yang HS, Yoon C, Myung Sk, Park SM. Effoct of obesity on survival of women with epithelial ovarian cancer: a systematic review and meta-analysis of observationsl studies. Int J Gynecol Cancer. 2011;21:1525–1532. doi: 10.1097/IGC.0b013e31822eb5f8. [DOI] [PubMed] [Google Scholar]
- 19.Protani MM, Nagle CM, Webb PM. Obesity and ovarian cancer survival: a systematic review and meta-analysis. Can Preven Res. 2012;5:901–910. doi: 10.1158/1940-6207.CAPR-12-0048. [DOI] [PubMed] [Google Scholar]
- 20.Lengyel E. Ovarian cancer development and metastasis. Am J Pathol. 2010;177:1053–1064. doi: 10.2353/ajpath.2010.100105. [DOI] [PMC free article] [PubMed] [Google Scholar]
- 21.Niedbala MJ, Crickard K, Bernacki RJ. Interactions of human ovarian tumor cells with human mesothelial cells grown on extracellular matrix. An in vitro model system for studying tumor cell adhesion and invasion. Exp Cell Res. 1985;160:499–513. doi: 10.1016/0014-4827(85)90197-1. [DOI] [PubMed] [Google Scholar]
- 22.Barbolina MV, Moss NM, Westfall SD, Liu Y, Burkhalter RJ, Marga F, et al. Microenvironmental regulation of ovarian cancer metastasis. Cancer Treat Res. 2009;149:319–334. doi: 10.1007/978-0-387-98094-2_15. [DOI] [PubMed] [Google Scholar]
- 23.Tebbe C, Chhina J, Dar SA, Sarigiannis K, Giri S, Munkarah AR, Rattan R. Metformin limits the adipocyte tumor-promoting effect on ovarian cancer. Oncotarget. 2014 Jul 15;5(13):4746–4764. doi: 10.18632/oncotarget.2012. [DOI] [PMC free article] [PubMed] [Google Scholar]
- 24.Krist LF, Kerremans M, Broekhuis-Fluitsma DM, Eestermans IL, Meyer S, Beelen RH. Milky spots in the greater omentum are predominant sites of local tumour cell proliferation and accumulation in the peritoneal cavity. Cancer Immunol Immunother. 1998;47:205–212. doi: 10.1007/s002620050522. [DOI] [PMC free article] [PubMed] [Google Scholar]
- 25.Clark R, Krishnan V, Schoof M, Rodriguez I, Theriault B, Chekmareva M, et al. Milky spots promote ovarian cancer metastatic colonization of peritoneal adipose in experimental models. Am J Pathol. 2013;183:576–591. doi: 10.1016/j.ajpath.2013.04.023. [DOI] [PMC free article] [PubMed] [Google Scholar]
- 26.Hagiwara A, Takahashi T, Sawai K, Taniguchi H, Shimotsuma M, Okano S, et al. Milky spots as the implantation site for malignant cells in peritoneal dissemination in mice. Can Res. 1993;53:687–692. [PubMed] [Google Scholar]
- 27.Gerber SA, Rybalko VY, Bigelow CE, Lugade AA, Foster TH, Frelinger JG, et al. Preferential attachment of peritoneal tumor metastases to omental immune aggregates and possible role of a unique vascular microenvironment in metastatic survival and growth. Am J Path. 2006;169:1739–1752. doi: 10.2353/ajpath.2006.051222. [DOI] [PMC free article] [PubMed] [Google Scholar]
- 28.Nieman KM, Kenny HA, Penicka CV, Ladanyi A, Buell-Gutbrod R, Zillhardt MR, et al. Adipocytes promote ovarian cancer metastasis and provide energy for rapid tumor growth. Nature Medicine. 2011;11:1498–1503. doi: 10.1038/nm.2492. [DOI] [PMC free article] [PubMed] [Google Scholar]
- 29.Roby KF, Taylor CC, Sweetwood JP, Cheng Y, Pace JL, Tawfik O, et al. Development of a syngeneic mouse model for events related to ovarian cancer. Carcinogenesis. 2000;21:585–591. doi: 10.1093/carcin/21.4.585. [DOI] [PubMed] [Google Scholar]
- 30.Brown MV, Compton SA, Milburn MV, Lawton KA, Cheatham B. Metabolomic signatures in lipid-loaded HepaRGs reveal pathways involved in steatotic progression. Obesity. 2013;21:E561–E570. doi: 10.1002/oby.20440. [DOI] [PMC free article] [PubMed] [Google Scholar]
- 31.Kenny HA, Dogan S, Zillhardt M, K Mitra A, Yamada SD, Krausz T, Lengyel E. Organotypic models of metastasis: A three-dimensional culture mimicking the human peritoneum and omentum for the study of the early steps of ovarian cancer metastasis. Cancer Treat Res. 2009;149:335–351. doi: 10.1007/978-0-387-98094-2_16. [DOI] [PMC free article] [PubMed] [Google Scholar]
- 32.Lengyel E, Burdette JE, Kenny HA, Matei D, Pilrose J, Haluska P, Nephew KP, Hales DB, Stack MS. Epithelial ovarian cancer experimental models. Oncogene. 2014;33:3619–3633. doi: 10.1038/onc.2013.321. [DOI] [PMC free article] [PubMed] [Google Scholar]
- 33.Bruney L, Conley KC, Moss NM, Liu Y, Stack MS. Membrane-type I matrix metalloproteinase-dependent ectodomain shedding of mucin16/CA-125 on ovarian cancer cells modulates adhesion and invasion of peritoneal mesothelium. Biol Chem. 2014;395:1221–1231. doi: 10.1515/hsz-2014-0155. [DOI] [PMC free article] [PubMed] [Google Scholar]
- 34.Lewellen K, Metzinger MN, Liu Y, Stack MS. Quantitation of intra-peritoneal ovarian cancer metastasis. JoVE. 2015 doi: 10.3791/53316. in press. [DOI] [PubMed] [Google Scholar]
- 35.Nilsson C, Raun K, Yan F, Larsen MO, Tang-Christensen M. Laboratory animals as surrogate models of human obesity. Acta Pharmacologica Sinica. 2012;33:173–181. doi: 10.1038/aps.2011.203. [DOI] [PMC free article] [PubMed] [Google Scholar]
- 36.Zhang Y, Proenca R, Maffei M, Barone M, Leopold L, Friedman JM. Positional cloning of the mouse obese gene and its huma homologue. Nature. 1994;372:425–431. doi: 10.1038/372425a0. [DOI] [PubMed] [Google Scholar]
- 37.Makowski L, Zhou C, Zhong Y, Kuan PF, Fan C, Sampey BP, et al. Obesity increases tumor aggressiveness in a genetically engineered mouse model of serous ovarian cancer. Gyn Oncol. 2014;133:90–97. doi: 10.1016/j.ygyno.2013.12.026. [DOI] [PMC free article] [PubMed] [Google Scholar]
- 38.Guo D, Bell EH, Mischel P, Chakravarti A. Targeting SREBP1-driven lipid metabolism to treat cancer. Curr. Pharm. Des. 2014:2619–2626. doi: 10.2174/13816128113199990486. [DOI] [PMC free article] [PubMed] [Google Scholar]
- 39.Park J, Morley TS, Kim M, Clegg DJ, Scherer PE. Obesity and cancer – mechanisms underlying tumour progression and recurrence. Nature Rev Endocrinol. 2014;10:455–465. doi: 10.1038/nrendo.2014.94. [DOI] [PMC free article] [PubMed] [Google Scholar]
- 40.Hanahan D, Weinberg RA. Hallmarks of cancer: the next generation. Cell. 2011;144:646–674. doi: 10.1016/j.cell.2011.02.013. [DOI] [PubMed] [Google Scholar]
- 41.Colvin EK. Tumor-associated macrophages contribute to tumor progression in ovarian cancer. Frontiers in Oncology. 2014;4 doi: 10.3389/fonc.2014.00137. article 137. [DOI] [PMC free article] [PubMed] [Google Scholar]
- 42.Brown MS, Goldstein JL. The SREBP pathway: regulation of cholesterol metabolism by proteolysis of a membrane-bound transcriptions factor. Cell. 1997;89:331–340. doi: 10.1016/s0092-8674(00)80213-5. [DOI] [PubMed] [Google Scholar]
- 43.Hawkins JL, Robbins MD, Warren LC, Xia D, Petras SF, Valentine JJ, et al. Pharmacologic inhibition of site 1 protease activity inhibits sterol regulatory element-binding protein processing and reduces lipogenic enzyme gene expression and lipid synthesis in cultured cells and experimental animals. J Pharmacol Exp Ther. 2008:801–808. doi: 10.1124/jpet.108.139626. [DOI] [PubMed] [Google Scholar]
- 44.Slaughter KN, Thai T, Penaroza S, Benbrook DM, Thavathiru E, Ding K, et al. Measurements of adiposity as clinical biomarkers for first-line bevacizumab-based chemotherapy in epithelial ovarian cancer. Gyn Onc. 2014;133:11–15. doi: 10.1016/j.ygyno.2014.01.031. [DOI] [PubMed] [Google Scholar]
- 45.Yang C, Lee H, Pal S, Jove V, Deng J, Zhang W, et al. B cells promote tumor progression via STAT3 regulated angiogenesis. PLoS One. 2013;5:e64159. doi: 10.1371/journal.pone.0064159. [DOI] [PMC free article] [PubMed] [Google Scholar]
- 46.Yang C, Lee H, Jove V, Deng J, Zhang W, Liu X, et al. Prognostic significance of B cells and pSTAT3 in patients with ovarian cancer. PLoS One. 2013;8:e54029. doi: 10.1371/journal.pone.0054029. [DOI] [PMC free article] [PubMed] [Google Scholar]
- 47.Naora H. Heterotypic cellular interactions in the ovarian tumor microenvironment: biological significance and therapeutic implications. Frontiers in Oncology. 2014;4 doi: 10.3389/fonc.2014.00018. article 18. [DOI] [PMC free article] [PubMed] [Google Scholar]
- 48.Zhang M, He Y, Sun X, Li Z, Wang W, Zhao A, et al. A high M1/M2 ratio of tumor-associated macrophages is associated with extended survival in ovarian cancer patients. J Ovar. Res. 2014;7:1–16. doi: 10.1186/1757-2215-7-19. [DOI] [PMC free article] [PubMed] [Google Scholar]
- 49.Grecius G, Westerberg L, Davey EJ, Buentke E, Scheynius A, Thyberg J, Severinson E. Microvilli structures on B lymphocytes: inducible functional domains? Int Immunol. 2004;16:353–364. doi: 10.1093/intimm/dxh031. [DOI] [PubMed] [Google Scholar]
- 50.Murai T, Sato M, Nishiyama H, Suga M, Sato C. Ultrastructural analysis of nanogold-labeled cell surface microvilli in liquid by atmospheric scanning electron microscopy and their relevance in cell adhesion. Int J Mol Sci. 2013;14:20809–20819. doi: 10.3390/ijms141020809. [DOI] [PMC free article] [PubMed] [Google Scholar]
- 51.Lomakina EB1, Marsh G1, Waugh RE. Cell surface topography is a regulator of molecular interactions during chemokine-induced neutrophil spreading. Biophys J. 2014;107:1302–1312. doi: 10.1016/j.bpj.2014.07.062. [DOI] [PMC free article] [PubMed] [Google Scholar]
Associated Data
This section collects any data citations, data availability statements, or supplementary materials included in this article.