

Abstract
Bladder cancer is a common and deadly malignancy but its treatment has advanced little due to poor understanding of the factors and pathways that promote disease. ATDC/TRIM29 is a highly expressed gene in several lethal tumor types, including bladder tumors, but its role as a pathogenic driver has not been established. Here we show that overexpression of ATDC in vivo is sufficient to drive both non-invasive and invasive bladder carcinoma development in transgenic mice. ATDC-driven bladder tumors were indistinguishable from human bladder cancers, which displayed similar gene expression signatures. Clinically, ATDC was highly expressed in bladder tumors in a manner associated with invasive growth behaviors. Mechanistically, ATDC exerted its oncogenic effects by suppressing miR-29 and subsequent upregulation of DNMT3A, leading to DNA methylation and silencing of the tumor suppressor PTEN. Taken together, our findings established a role for ATDC as a robust pathogenic driver of bladder cancer development, identified downstream effector pathways and implicated ATDC as a candidate biomarker and therapeutic target.
Keywords: Bladder cancer, ATDC, TRIM29, PTEN, DNA methylation, microRNA
Introduction
Bladder cancer (BC) is the fifth most common malignancy and the second most common cause of death among genitourinary tumors in the United States (1). Risk factors for BC development include smoking, male sex and inflammation (2). Ninety percent of BCs are urothelial carcinomas, which are divided into two types: noninvasive and invasive tumors. Noninvasive BC accounts for 80% of bladder tumors, is low-grade, multifocal and frequently recurs after resection (3). Only 15% of these tumors will progress to lethal, muscle-invasive BCs, and identification of those at risk for progression has been challenging. Muscle-invasive high grade BC accounts for 20% of all bladder tumors and ~ 50% of patients develop lethal metastases despite aggressive therapy (4). Therefore, understanding the pathways that govern tumor behavior is essential to develop better treatment strategies.
Non-invasive and invasive BC have distinct molecular signatures. Noninvasive tumors harbor activating mutations in HRAS (~30%), fibroblast growth factor receptor 3 (FGFR3; 45–85%), PI3K (28%) and RAF (7%) (4). In contrast, high-grade BC including carcinoma-in-situ (CIS) and muscle-invasive BC are characterized by alteration of the p53/retinoblastoma protein (RB) pathway (93%), activation of the RTK, RAS/PI3K pathways (although mutational events in PTEN are rare) and changes in epigenetic regulatory pathways (5–7). Furthermore, invasive bladder cancers can be subdivided into basal or luminal subtypes based on molecular signatures (8,9). Basal bladder cancers express KRT5/6, KRT14 and TP63 and exhibit a worse prognosis than the luminal subtype (10).
Transgenic (tg) mouse models have identified several important genes involved in bladder tumorigenesis. Tg mice over-expressing activated Hras in the uroplakin-expressing urothelial cells (mUPII-Hras) develop urothelial hyperplasia and non-invasive tumors but never develop muscle-invasive BC (11,12). Activation of the β-catenin/Wnt signaling pathway in uroplakin-expressing urothelial cells cooperates with Hras mutation or Pten inactivation to drive noninvasive BC in mice (13,14). Inactivation of p53, Rb or Pten individually in tg mice results in urothelial hyperplasia, but is insufficient to induce invasive BC (15,16). p53−/− and Rb1−/−double knockout mice develop urothelial hyperplasia, but only develop muscle-invasive BCs when treated with the carcinogen, N-butyl-N-(4-hydroxybutyl)nitrosamine (BBN)(15). In contrast, combined Pten and p53 deficiency or conditional inactivation of Notch signaling alone promoted formation of muscle-invasive BCs in mice without addition of BBN (16,17).
The Ataxia-Telangiectasia Group D Complementing (ATDC) gene (also known as TRIM29) belongs to the tripartite motif protein family. ATDC has been reported to be expressed in BCs (18), but its functions are unclear. ATDC promotes pancreatic cancer cell proliferation in vitro and tumor growth and metastasis in vivo by up-regulation of β-catenin signaling (19) and has also been shown to bind p53 and antagonize p53-mediated functions (20). To determine the function of ATDC in tumor formation, we constitutively overexpressed ATDC in a genetically-engineered mouse model. ATDC overexpression induced nonmuscle-invasive and muscle-invasive urothelial carcinomas that were phenotypically indistinguishable from their human counterparts. Further, ATDC expression was common in human BC and molecular alterations present in human BCs were similar to those present in the invasive BCs that developed in ATDC transgenic mice. Here we characterize the role of ATDC in BC and identify molecular mechanisms by which ATDC promotes bladder tumorigenesis.
Materials and Methods
Generation of Transgenic Mice
The CAG-ATDC transgene (construction described in Supplemental Materials and Methods) was linearized and microinjected into the pronuclei of fertilized eggs of FVB/NJ mice (Jackson Laboratory, Bar Harbor, Maine) by the University of Michigan Transgenic Animal Model Core. CAG-ATDC founder lines were identified by PCR analysis using FLAG-ATDC specific primers (Fig 1A, Supplemental Material and Methods). Three founder lines were identified carrying 4 (line A), 4 (line B) and 2 (line C) copies of the transgene. The mice were inbred with FVB/NJ mice and studies were performed using the 2–4th generations. Animal experiments were approved by the University of Michigan Animal Care and Use Committee and were performed in accordance with established guidelines.
Figure 1.
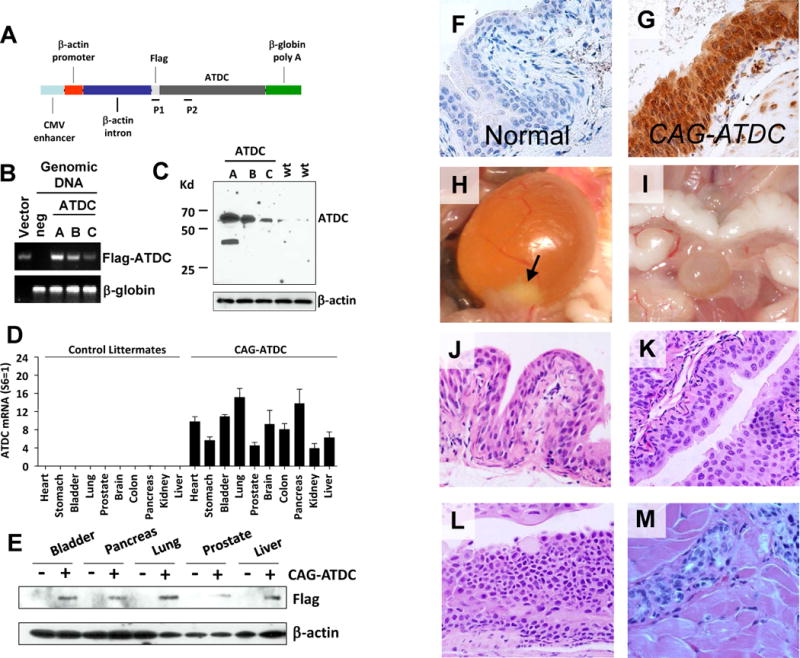
CAG-ATDC tg mice develop urothelial tumors similar to human tumors. (A) Diagrammatic illustration of the pCAGGS-flag-ATDC expression vector (CAG-ATDC). P1 and P2 indicate locations of primers for genotyping PCR. (B) Genotyping by qPCR of three CAG-ATDC transgenic mouse lines (A, B, and C) and an age-matched flag-ATDC negative littermate. pCAGGS-Flag-ATDC expression vector (Vector) was used as a positive control. β-globin was used as a PCR loading control. (C) Whole-cell lysates from the bladders of transgenic line A, B and C or control littermates were subjected to western blotting, and probed with ATDC antibody confirming ATDC tg expression. β-actin served as loading control. (D) Quantitative RT-PCR of flag-ATDC mRNA detected transgene expression in a wide variety of tissues in CAG-ATDC line A mice, but not in control littermates (n=6, mean±SE). (E) Western blotting of ATDC in protein lysates from various tissues confirms transgene protein expression in multiple tissues. (F) Immunostaining for ATDC in normal bladder littermate urothelium lacking transgene. (G) Immunostaining for ATDC in CAG-ATDC urothelium demonstrates high levels of expression. (H) A representative image of a bladder tumor (arrow) in CAG-ATDC mice (10 months of age). (I) A representative image of a normal bladder in a control littermate. (J) Representative H&E-stained sections depicting normal bladder urothelial histology in a control littermate (10 months of age). (K–M) Representative H&E-stained sections of CAG-ATDC lesions at 8–12 months of age showing low-grade noninvasive (K), carcinoma in situ (CIS) (L), and muscle-invasive (M) urothelial tumors.
Quantitative RT-PCR
Similar to previously described methods (19). Detailed information about probes and methods available in Supplemental Materials and Methods.
Immunohistochemical Staining
Bladder cancer or normal bladder samples were fixed, stained and examined as previously described (19). All human samples were obtained following approval by the Institutional Review Board of the University of Michigan Medical Center. A bladder cancer tissue microarray (TMA) was constructed by the University of Michigan Medical Center’s Tissue Procurement Facility and a bladder cancer TMA was provided by Dr. Lotan (UT Southwestern). The primary antibodies for immunohistochemical staining were ATDC (Sigma, St Louis, MD), PTEN (Cell Signaling Technology, Danvers, MA), DNMT3A (ABCAM, Cambridge, MA). Quantitation and scoring of IHC was done as previously described (21,22).
Cell Culture and Transfection
Cell lines (UC9, UC14, UC10, T24, SV-HUC1) and primary cells (w81, pa19) were purchased from American Type Culture Collection (ATCC) or derived as previous described (23,24). All cell lines were analyzed and authenticated by targeted genomic and RNA sequencing. Cells were grown in DMEM or F12K media with 10% serum (Gibco) under standard culture conditions. ATDC and PTEN lentiviral expression constructs were created by cloning relevant restriction-digested (NheI/XbaI) cDNA into a pLentiLoxRSV vector (University of Michigan Vector Core) using restriction digestion and ligation. Viral particles were packaged by University of Michigan Vector Core. ATDC, PTEN and DNMT3A shRNA and control shRNA constructs were purchased from Sigma-Aldrich (St. Louis, MO). Transfection and generation of stable cell lines was done as previously described (19).
Immunoblot Analysis
Immunoblot analysis was done as previously described (19) using antibodies directed against ATDC (Santa Cruz Biotechnology), PTEN and RELA (Cell Signaling Technology, Danvers, MA), DNMT3A and DNMT3B (Santa Cruz Biotechnology), at a 1:1000 dilution. β-actin antibody (Sigma, St Louis, MD) served as a loading control.
Proliferation Assays
Cell proliferation was measured using a CellTiter 96® AQueous Non-Radioactive Cell Proliferation Assay (MTS) Kit (Promega, San Luis Obispo, CA) as described (19).
Invasion Assays
In vitro invasion assay were done using Cell Invasion Assay Kit (Chemicon/Milipore International, Billerica, MA) and performed as previously described (19).
Orthotopic Bladder Xenograft Assays
Luciferase was transduced into UC9 or UC14 cell lines stably transfected with ATDC-targeting shRNA or control shRNA as noted above. The protocol for generation of orthotopic bladder xenograft tumors has been previously described (25). A 24g catheter was inserted into the bladders of 6 week-old female NOD/SCID mice and 2.5% trypsin was instilled and then washed. 1×10⁵ cells were then instilled into each bladder. Tumor formation and growth was followed using bioluminescence as previously described (19) using an IVIS 200 imaging system (Xenogen Biosciences). Five weeks after cancer cell injection, mice were euthanized with carbon dioxide inhalation and extent of primary tumor growth assessed.
Methylation Specific PCR
Specific methods used for methylation specific PCR, quantitative methylation specific PCR, primers and conditions are available in Supplemental Material and Methods.
Affymetrix Gene Expression Profiling Analysis
Gene expression profiles of normal control bladders from wt littermates and invasive bladder carcinoma samples from CAG-ATDC mice were obtained using the Affymetrix 3000 7G Gene Chip platform, as we have described previously and as outlined in Supplemental Material and Methods (26).
Oncomine Molecular Concepts Analysis
A CAG-ATDC gene expression signature was generated by taking all genes up-regulated 2-fold or greater in our invasive CAG-ATDC bladder tumors compared to littermate control bladder tissue and then identifying the subset of these genes up-regulated in all three tumors and with human homologs. This produced a 77 gene-expression signature unique to our CAG-ATDC BC tumors (Supplementary Table 3). Automated enrichment analysis using Oncomine, where concepts are automatically evaluated for enrichment by disproportional overlap with over 10,000 molecular concepts, including other gene expression signatures (27,28) was performed using our 77 gene CAG-ATDC bladder tumor signature (↑ in CAG-ATDC BlCa tumors- uploaded into Oncomine as a custom concept). Enriched concepts were identified by automated analysis in Oncomine and selected interaction nodes and edges were exported into Cytoscape for visualization using force directed layout.
MicroRNA Transfection and Detection
miR-29A, B and C specific primers and TaqMan probes and mirVana™ qRT-PCR miRNA Detection Kits were obtained from Life Technologies (Grand Island, NY). MiR-29A, B and C mimics, antisense oligo’s and scrambled control miR were also obtained from Life Technologies (Grand Island, NY). Mimic and antisense oligonucleotides corresponded to the 3′ of the published hairpin sequences. Sequences are available on the Life Technologies website. Mimic and antisense miRNA were transfected in six-well plates by using Lipofectamine RNAiMAX reagent (Life Technologies) according to the manufacturer protocol. MicroRNA from UC9 or UC14 cells with or without ATDC shRNA expression were isolated and purified using mirVana™ miRNA Isolation Kit (Life Technologies). qRT-PCR analysis for miRNAs was performed in triplicate with TaqMan® MicroRNA Reverse Transcription Kit and TaqMan® Universal Master Mix II (Applied Biosystems, Carlsbad, CA) according to the instructions of the manufacturer. Real-time RT-PCR was performed on ViiA 7 system (Applied Biosystems) using the following conditions: after 10 min at 95° C, 40 cycles were performed at 95° C for 15 sec, and 60° C for 1 min. The data were normalized to small nucleolar RNA U6 (housekeeping control) using the Ct method.
siRNA Transfection
Non-targeting control sequences (D-001810-10-05) or smart-pool MYC (L-003282-02) or RELA (L-003533-00) targeting siRNA were purchased from Dharmacon. Transfections were carried out using Lipofectamine RNAiMAX (Life Technologies) as above.
Statistical Analysis
Proliferation and invasion data are represented as mean ± SEM from at least three independent experiments. Significance of differences between groups was evaluated by Student’s t test or ANOVA. p < 0.05 was considered significant. Pairwise association of expression between ATDC and DNMT3A and PTEN was tested using the Jonckheere-Terpstra test to compare IHC intensity scores (1–4). The association between bladder cancer stage and ATDC expression classified as Medium or High compared to absent or Low was also tested with the Jonckheere-Terpstra test.
Results
ATDC induces bladder tumor formation in a transgene dosage-dependent manner
To determine the contribution of ATDC to BC formation, we generated mice globally overexpressing ATDC from a constitutive promoter (CAG-ATDC, Fig 1A). Using quantitative PCR and immunoblotting we identified three founder transgenic lines (A, B and C) harboring 6, 4 and 2 copies of the CAG-ATDC transgene, respectively (Figure 1A, B and C). We then examined ATDC transgene expression in founder lines by qRT-PCR, Western analysis and IHC and found transgene dosage-dependent overexpression in all tissue types (Figure 1B–G, Supplemental Fig 1).
CAG-ATDC transgenic mice were observed closely for phenotypic abnormalities. Starting at 8 months of age, the predominant phenotype was the development of bladder outlet obstruction secondary to tumor formation (Figure 1H). While control mice lacking the ATDC transgene displayed normal urothelial histology (Figure 1I and J), analysis of bladders from line A (6 tg copies) demonstrated a spectrum of urothelial neoplasia ranging from dysplasia to muscle-invasive urothelial carcinoma (Figure 1K–M, Supplemental Fig 2 and Supplemental Table 1). 14% of line A mice (6 tg copies) (3/21) developed only low-grade non-invasive tumors and 29% (6/21) developed either invasive carcinoma or CIS. Nine percent (2/22) of line B mice (4 tg copies) developed non-invasive and 5% (1/22) developed invasive carcinoma (Table 1). Mice from line C (2 tg copies) developed hyperplasia (2/19), but none developed tumors over an 18 month observation period. All invasive tumors demonstrated muscle invasion. Histologically, tumors were indistinguishable from human urothelial carcinomas. Superficial papillary carcinomas were multifocal with fibrovascular stalks projecting into the bladder lumen similar to human tumors (Supplemental Fig 2D). Muscle-invasive tumors consisted of malignant cells infiltrating into the muscularis (Figure 1M). Tumors isolated from CAG mice demonstrated elevated ATDC compared to littermate control bladders (Supplemental Fig 1), and ATDC expression was similar to that seen in human bladder tumors (Supplemental Fig 3). These results demonstrate that ATDC overexpression induces formation of noninvasive and muscle-invasive BC in a dosage-dependent manner.
Table 1.
Bladder urothelial malignant transformation in CAG-ATDC transgenic line A, B, C.
| Genotype | WT | ATDC, line A | ATDC, line B | ATDC, line C |
|---|---|---|---|---|
| Transgene Copy Number | 0 | 6 | 4 | 2 |
| Non-invasive Tumor | 0/9 (0%) | 3/21 (14%) | 2/22 (9%) | 0/19 (0%) |
| Carcinoma in situ | 0/9 (0%) | 2/21 (10%) | 0/22 (0%) | 0/19 (0%) |
| Muscle-invasive Tumor | 0/9 (0%) | 4/21 (19%) | 1/22 (5%) | 0/19 (0%) |
ATDC is highly expressed in human bladder cancer and correlates with invasive disease
To confirm that ATDC is expressed in human BC, we analyzed mRNA expression in two large multi-cancer studies in the Oncomine database (28,29). Human BCs had the highest expression of ATDC compared to any other tumor type (p value <106) (Figure 2A, lane 1). Further, both non-invasive BCs and muscle-invasive specimens had significantly higher ATDC expression than normal bladder tissues (Figure 2B and C) (18,30).
Figure 2.
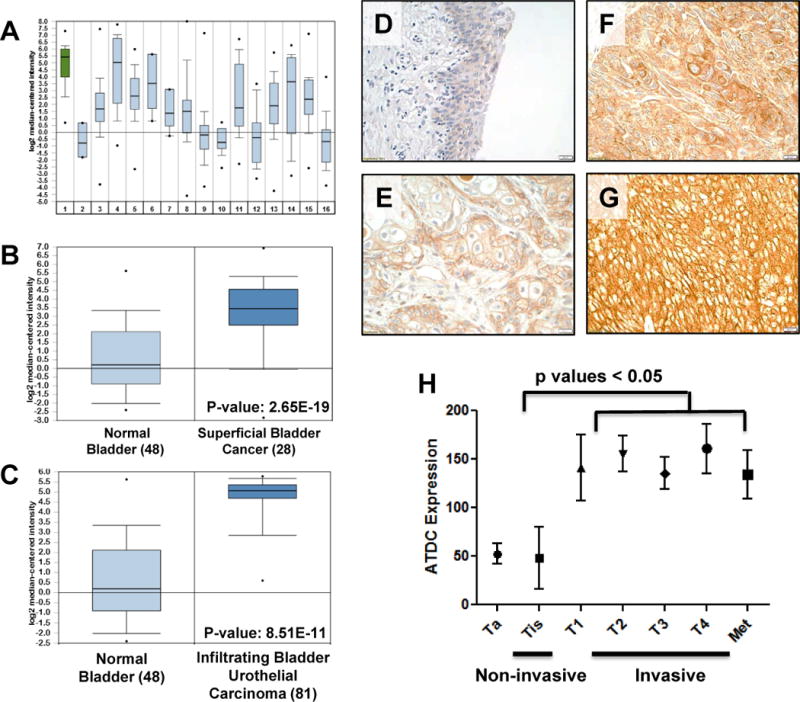
ATDC is highly expressed in human bladder cancers and correlates with invasive disease. (A) Comparison of ATDC expression in various tumor types in gene expression array data derived from Oncomine demonstrated that ATDC was most highly expressed in bladder tumors (p value = 2.98 × 10⁻¹²). 1: Bladder, 2: CNS, 3: Breast, 4: Cervical, 5: Colon, 6: Esophagus, 7: Gastric, 8: Head and Neck, 9: Kidney, 10: Liver, 11: Lung, 12: Lymphoma, 13: Ovarian, 14: Pancreatic, 15: Prostate, 16: Sarcoma. (B) Comparison of ATDC expression in normal human bladder and superficial human bladder tumors in Oncomine database demonstrated that ATDC was up-regulated in superficial tumors (p value =2.65×10⁻¹⁹) (30). (C) Comparison of ATDC expression in normal bladder and infiltrating (invasive) human bladder tumors demonstrated significant up-regulation of ATDC in tumors (p value = 8.51×10⁻¹¹) (30). For A–C, error bars represent 95% confidence intervals. (D–G) Representative images demonstrating absent ATDC expression in normal human urothelium (D) and low (E), moderate (F) or strong (G) expression in human invasive bladder tumor specimens. (H) Quantification of ATDC expression in non-invasive (n = 27) and invasive (n = 153) human urothelial tumors demonstrated higher ATDC expression in invasive human tumors (mean±SE). Each specimen was given a composite score (0–300) by a blinded bladder pathologist.
To confirm ATDC protein levels were up-regulated in human BCs, we analyzed tissue microarrays (TMA) of human primary BCs (297 samples). The staining intensity of each tissue core was graded 0 (negative), 1 (low), 2 (moderate) or 3 (strong), and according to percentage of tissue positive (0–100%) with a composite score (grade × percentage) generated (0–300) for each sample (representative images in Figure 2D–G). ATDC was significantly overexpressed in both human non-invasive and muscle-invasive BCs compared to normal human bladder specimens (Figure 2D–G and Supplemental Table 2). ATDC was expressed predominately in the cytoplasm, although it was also found in the nucleus in some samples (Supplemental Fig 4)(31). Among 283 human BC samples 53% of muscle-invasive tumors and 50% of CIS specimens stained positively for ATDC. In contrast, 22% of the non-invasive bladder tumors demonstrated elevated ATDC staining.
To determine if ATDC expression correlated with tumor behavior in patients, we next correlated ATDC expression levels with tumor pathologic stage. We found that increased ATDC expression correlated with invasive disease. Noninvasive tumors had lower scores (n=27, mean=65) of ATDC expression as compared to invasive tumors (n=153, mean=121, p<0.05) (Figure 2H), with no further increase in ATDC expression evident in metastatic lesions. These results are consistent with increasing ATDC expression in invasive BC.
CAG-ATDC bladder cancers have a similar gene expression signature to human cancers
To characterize the molecular signature of ATDC-induced tumors, we carried out Affymetrix gene expression profiling of muscle-invasive BCs and matching normal bladder samples from control littermates (n = 3 per group, Figure 3A). Selected genes which were the most up or down-regulated in ATDC tumors are listed next to the heat map and include vascular endothelial growth factor receptor (VEGFR), connective tissue growth factor, insulin-like growth factor and genes involved in the WNT1 inducible pathway (Figure 3A). To establish a gene-expression signature unique to CAG-ATDC BC tumors, we identified all of the genes up-regulated > 2 fold compared to littermate control bladders (Supplemental Table 3). Of these 77 genes, many, including CYR61, IGFBP2, LOXL2, and THBS1, have been previously reported to enhance migration of human BC cell lines and drive invasion (32). To determine if there was an overlap between transcriptional programs in CAG-ATDC and human BCs, we uploaded this 77 gene signature into Oncomine (28) as a custom concept. In Oncomine, this concept (↑ in CAG-ATDC BlCa tumors) was automatically evaluated for enrichment by disproportional overlap with over 10,000 molecular concepts, including other gene expression signatures and biologically annotated gene sets (27). The genes over-expressed in CAG-ATDC bladder tumors significantly overlapped with multiple expression profiling signatures of genes over-expressed in human bladder cancers and human infiltrating vs. superficial human urothelial BCs (Figure 3B and C, Supplemental Table 4 and 5). These data demonstrate that the CAG-ATDC tumors possess a morphologic and molecular phenotype typically seen in human muscle-invasive BC and that ATDC drives an invasive gene expression program.
Figure 3.
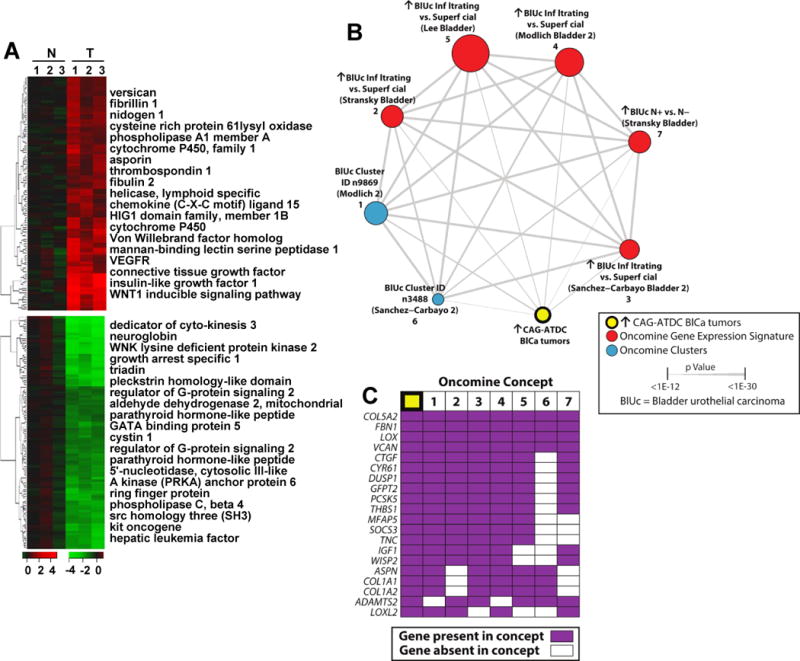
Gene expression analysis of CAG-ATDC bladder tumors reveals a similar profile to human invasive bladder tumors. (A) Heat map representation of up- (red) and down- (green) regulated genes in CAG-ATDC bladder tumors as compared to normal littermate control bladder tissue. Top genes from each category are listed to the right. (B) A molecular concepts map of the ↑ in CAG-ATDC BlCa tumors signature (ringed yellow node, n= 77 genes) and selected enriched molecular concepts demonstrated highly statistically significant overlap with human bladder cancer concepts. Each node represents a molecular concept, with node size proportional to the number of genes in the concept. The concept color indicates the concept type according to the legend. Each edge represents a significant enrichment (P < 1E–7), and the edge thickness is proportional to significance as indicated. Concepts and enrichments with the ↑ in CAG-ATDC BlCa tumors signature are given in Supplemental Table 5. (C) The top 20 most represented genes across the indicated enriched concepts are shown, with genes present in each concept indicated by purple box. Concepts are numbered as in (B).
ATDC is highly expressed in human bladder cancer cell lines and drives proliferation and invasion
To explore the functional role of ATDC in BC tumorigenesis, we next interrogated ATDC levels in human urothelial cell lines. ATDC mRNA and protein expression levels were elevated in the T24, UC9 and UC14 human BC cell lines, but not in w81 or PAL19 primary urothelial cells (Figure 4A and B) or the SV-HUC1 immortalized human urothelial cell line (Figure 5E). To assess the contribution of ATDC to the malignant phenotype of UC9 and UC14 cells, we transfected control or 2 ATDC-shRNAs targeting distinct regions of the gene into these cell lines (Figure 4C and D). We found that ATDC knockdown significantly inhibited proliferation in both UC14 and UC9 cell lines (Figure 4E and F, n=4, *p<0.01 for each cell line).
Figure 4.
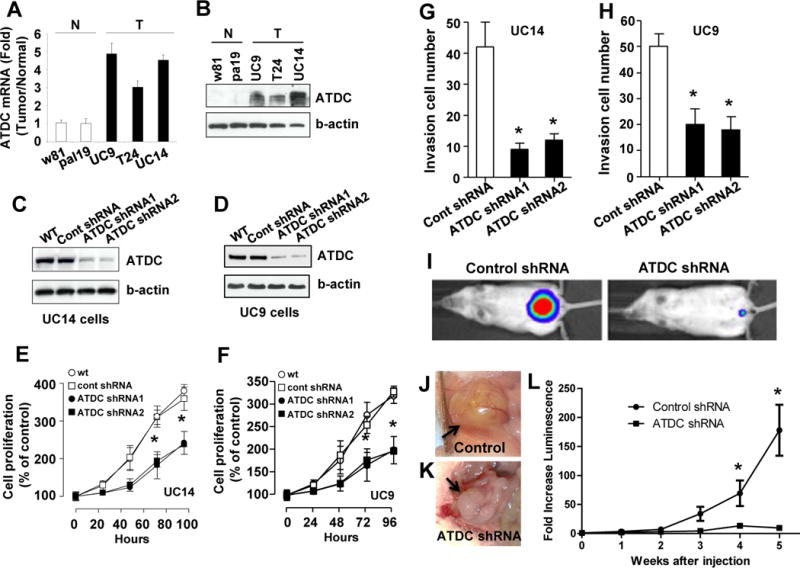
Silencing of ATDC inhibits human bladder cancer cell proliferation and invasion. (A) Quantitative RT-PCR of ATDC mRNA levels in human bladder cancer cell lines (T) and primary urothelial cells (N) (n=3, mean±SE). (B) Western blotting of ATDC expression levels in human bladder cancer cell lines (T) and primary urothelial cells (N). (C and D) Western blot analysis of ATDC knockdown by ATDC shRNA 1 and 2 in UC14 and UC9 cells. (E and F) ATDC knockdown inhibits cellular proliferation in UC14 and UC9 bladder cancer cell lines (n=6, mean±SE, *p<0.05 for each). (G and H) ATDC knockdown decreases invasiveness in UC14 and UC9 bladder cancer cell lines (n=4, mean±SE, *p<0.01 for each cell line). (I–L) Knockdown of ATDC using targeting shRNA inhibits growth of luciferase labeled UC9 orthotopic xenograft bladder tumors (n = 6 animals per group). (I) Representative images of luciferase-labeled control shRNA and ATDC shRNA tumors in mice at 5 weeks after injection. (J and K) Representative pictures of control and ATDC shRNA tumors at 5 weeks. (L) Tumor growth as measured by fold-increase in bioluminescence compared to luminescence at time of injection in animals injected with UC9 bladder tumor cells expressing control and ATDC shRNA (n=6 per group, mean±SD,*p<0.05).
Figure 5.
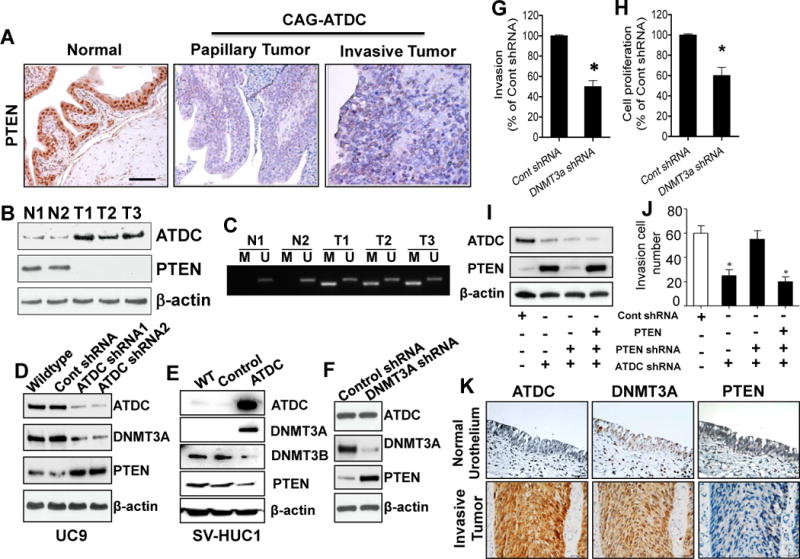
ATDC overexpression results in epigenetic silencing of PTEN expression by up-regulation of DNMT3A. (A) Immunohistochemical staining reveals loss of PTEN expression in CAG-ATDC bladder tumors. Bar, 100 μm. (B) Western blotting of total protein extracts from normal bladder tissues (N1, N2) from control littermates or invasive bladder tumors (T1, T2, T3) from CAG-ATDC transgenic mice confirms loss of PTEN expression in ATDC-expressing tumors. (C) Methylation-specific PCR assay (MSP) analysis of PTEN promoter from genomic DNA derived from CAG-ATDC invasive bladder tumors demonstrates PTEN promoter methylation in tumors. N1 and N2: Normal bladder from control littermates; T1, T2 and T3: invasive bladder tumors from CAG-ATDC mice. (D) Western blotting for ATDC, PTEN and DNMT3A in lysates derived from UC9 cells transfected with control or ATDC shRNA demonstrates decreased DNMT3A and increased PTEN expression. β-actin serves as a loading control. (E) Overexpression of ATDC in the immortalized urothelial SV-HUC1 cells increases DNMT3A and decreases PTEN expression (n=4). (F) Knockdown of DNMT3A in UC9 cells increases PTEN expression. (F–H) Knockdown of DNMT3A in UC9 cells reduces cellular invasion and proliferation (n = 3, mean±SE, *p < 0.05 vs control shRNA). (I) Western blotting of lysates from UC9 cells transfected with either control, ATDC or PTEN targeting shRNA or PTEN expression vector demonstrates silencing of ATDC and/or PTEN by shRNA and recovery of PTEN expression by ectopic expression. (J) Silencing of ATDC expression reduces invasion which is restored by silencing of PTEN. Ectopic of expression of PTEN decreases invasion. (n =3, mean±SE, *p < 0.05 for groups indicated with asterisks when compared to control shRNA group). (K) Representative images depicting ATDC, DNMT3A and PTEN expression in normal human urothelium and invasive human bladder cancer. (n=120, ATDC-DNMT3A p value = 0.03, ATDC-PTEN p value = 0.07).
Since gene-expression profiling indicated that ATDC tg tumors harbored an invasive gene signature, we next assessed the role of ATDC in invasion using a modified Boyden-chamber invasion assay. Knockdown of ATDC in UC14 and UC9 cells inhibited invasion compared to cells transfected with control shRNA (Figure 4G and H, n=4, *p<0.01). To confirm that ATDC promoted invasion, we overexpressed ATDC in the UC10 bladder cancer cell line which has low endogenous ATDC expression (Supplemental Fig 5A). ATDC overexpression in UC10 resulted in a 37% increase invasion compared to control (Supplemental Fig 5B). Therefore, ATDC promotes both proliferation and invasion of human BC cell lines.
To determine if ATDC expression modulates BC growth in vivo, we established UC9 orthotopic bladder xenograft tumors stably transduced with either control or ATDC shRNA vectors. All cells also stably expressed luciferase, allowing tumor monitoring using bioluminescence. ATDC silencing significantly decreased tumor growth in vivo (Figure 4I–L, n=6 animals per group, *p<0.05). These results demonstrate that ATDC is a determinant of growth and tumorigenicity in vitro and in vivo.
ATDC induces upregulation of DNMT3A and epigenetic silencing of PTEN
Loss of PTEN expression contributes to the development of both nonmuscle-invasive and muscle-invasive BCs in tg mice (13,16,33). Since ATDC overexpression induced both of these bladder tumor types, we assessed PTEN expression in both CAG-ATDC BCs and bladder tissue from wild type (WT) littermates by IHC and Western blotting. PTEN protein expression was lost in both non-invasive and muscle-invasive CAG-ATDC BCs, but maintained in normal bladder tissue, indicating PTEN loss occurred during ATDC-induced bladder tumor formation (Figure 5A and B)(Supplemental Fig 6).
Tumor suppressor gene expression can be lost by mechanisms including mutation, deletion, loss of transcription factors, histone modification, ncRNA interference or epigenetic silencing by DNA methylation. PTEN promoter DNA methylation is a common mechanism by which expression is lost in many tumor types (34). We next hypothesized that ATDC overexpression might down-regulate PTEN expression in BCs via promoter DNA methylation. To determine the methylation status of the Pten promoter in CAG-ATDC mouse tumors, we extracted genomic DNA and performed methylation-specific PCR (MSP). Genomic DNA from CAG-ATDC invasive BCs, but not from normal littermate bladder tissue, revealed hypermethylation at the promoter region of Pten (Figure 5C). To determine if ATDC expression correlated with methylation of the PTEN promoter in human cancer, we assessed methylation status of the PTEN promoter in invasive bladder cancer cell lines (UC14 and UC9) with and without ATDC knockdown and the immortalized normal urothelial cell line, SVHUC1 with and without ATDC overexpression using quantitative methylation specific PCR. Knockdown of ATDC expression by shRNA reduced PTEN promoter methylation in both UC14 and UC9 and overexpression of ATDC in SVHUC1 increased PTEN promoter methylation (Supplemental Fig 7). In ovarian cancer, reduction in DNA methylation can induce recovery of PTEN expression (35). To determine if ATDC knockdown correlated with recovery of PTEN expression, we transfected ATDC targeting shRNA into the UC9 and UC14 cell lines with high ATDC levels. ATDC knockdown resulted in increased PTEN expression in these human BC cell lines (Figure 5D, Supplemental Fig 8). To confirm that this effect was attributable to ATDC, we next overexpressed ATDC in immortalized normal urothelial cells with low endogenous ATDC expression (SV-HUC1) and measured PTEN levels by Western blotting. ATDC overexpression decreased PTEN expression in SV-HUC1 cells (Figure 5E).
DNA methyltransferases 3A and 3B (DNMT3A or DNMT3B) are responsible for most de novo DNA methylation (36). Since DNMT3A has been previously implicated in PTEN silencing, we next examined the impact of ATDC expression on DNMT3A (37). ATDC silencing in UC9 cells decreased levels of DNMT3A and increased PTEN expression by Western blotting (Figure 5D). Similarly, overexpression of ATDC in immortalized normal urothelial SV-HUC1 cells resulted in up-regulation of DNMT3A and reduction of PTEN (Figure 5E). In contrast, expression of DNMT1 and DNMT3B was not regulated by altered ATDC expression and did not correlate with PTEN loss (Figure 5E, Supplemental Fig 8). These results imply that ATDC up-regulates DNMT3A, which induces methylation and silencing of PTEN expression.
To determine if the effects of ATDC on PTEN expression, invasion and proliferation are mediated by DNMT3A, we knocked down DNMT3A expression using targeting or control shRNA in UC9 cells. DNMT3A knockdown increased PTEN expression (Figure 5F) and reduced invasion and proliferation (Figure 5G and H) when compared to control shRNA transduced cells. To determine if the BC invasive phenotype was mediated directly by PTEN loss, we next knocked down PTEN expression and observed a significant increase in invasive capacity when compared to cells transduced with control shRNA (Figure 5I and J). To confirm that this was attributable to PTEN loss, we re-introduced PTEN expression in these cells using a lentiviral expression vector and were able to suppress the invasive phenotype induced by PTEN knockdown (Figure 5I and J), suggesting that the dominant effect of ATDC is mediated through loss of PTEN expression. These results imply that ATDC drives bladder tumor invasion and proliferation via up-regulation of DNMT3A which silences PTEN, driving tumor invasion and proliferation.
To determine whether increased ATDC expression correlated with increased DNMT3A and loss of PTEN in patients, we measured expression of all three proteins by IHC in a TMA containing human muscle-invasive BC specimens (n =120) (each core was assigned a score 1–4 by a blinded pathologist). Using the Jonckheere-Terpstra test we identified a statistically significant correlation between increased ATDC expression and DNMT3A expression in invasive human BC specimens (n = 120, p value = 0.036, Supplemental Table 6, Figure 5K). Most specimens also displayed loss of PTEN, but the correlation between DNMT3A and PTEN did not reach statistical significance (p value= 0.07), possibly because these advanced human bladder tumors may have lost PTEN expression via other mechanisms.
To confirm that DNMT3A and PTEN expression was modulated by ATDC in our CAG-ATDC bladder tumors, we examined mRNA levels in 3 CAG-ATDC invasive tumors and compared these to 3 normal mouse bladders lacking ATDC using qRT-PCR. As anticipated, overexpression of ATDC resulted in loss of PTEN mRNA and upregulation of DNMT3A (p < 0.05, Supplemental Fig 9A). These data demonstrate that ATDC overexpression in BC up-regulates DNMT3A, silencing PTEN and driving a malignant phenotype.
ATDC up-regulates DNMT3A via MYC-mediated suppression of miR-29
In other tumor types, the miR-29 family (A, B and C) has been shown to regulate the mRNA levels of DNMT3A by binding to complimentary sequences in the 3′ UTR, leading to degradation of the mRNA message (38,39). Further, miR-29A and B1 are transcriptionally repressed by direct binding of MYC to the miR-29 promoter (40,41). We have previously reported that ATDC binds to DVL2, resulting in stabilization of β-catenin and activation of the WNT pathway in pancreatic cancer (19). We observed that ATDC upregulated β-catenin and its target gene, MYC, in BC (Supplemental Fig 9A and B) therefore we hypothesized that ATDC-mediated up-regulation of DNMT3A might be orchestrated by MYC-mediated suppression of miR-29 family members.
To determine whether miR29- A, B or C regulated DNMT3A expression in urothelial cell lines, we transfected miR-29A, B and C mimics into UC14 and UC9 cell lines and found that all three down-regulated DNMT3A levels but did not effect ATDC expression (Figure 6A and B). Next, we used miR-29 antisense (AS) oligonucleotides to determine if blocking miR-29 family members modulated DNMT3A expression and found that they resulted in up-regulation of DNMT3A (Figure 6C). To determine if ATDC suppressed miR-29 A, B or C expression, we measured each in UC14 and UC9 cells transfected with control or ATDC-targeting shRNA and found that knockdown of ATDC increased miR-29A and B, but not miR-29C in both cell lines (Figure 6D). ATDC knockdown also resulted in DNMT3A mRNA reduction similar to previous western blotting data (Figure 6E). To determine if miR-29A and B mediated DNMT3A suppression in our ATDC knockdown cells, we transfected antisense oligonucleotides into UC9 and UC14 cell lines stably transfected with either control or ATDC-targeting shRNAs. miR-29A and B antisense oligos together, but not individually, rescued DNMT3A expression (Figure 6F). These results demonstrate that ATDC can regulate DNMT3A expression by suppression of the miR-29 family members 29A and 29B.
Figure 6.
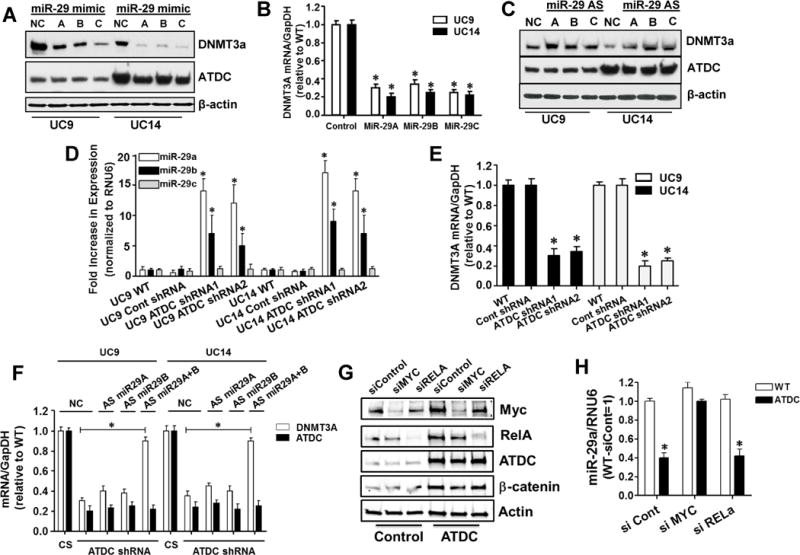
ATDC suppresses miR-29 expression resulting in increased expression of DNMT3A. (A and B) Transfection of miR-29A, B and C into UC9 and UC14 bladder cancer cells lines suppresses DNMT3A protein and mRNA expression (mean±SE, n=3, * p < 0.05 vs WT). (C) Transfection of miR-29A, B and C antisense (AS) oligonucleotides into UC9 and UC14 cells results in increased DNMT3A protein expression. (D) Stable expression of ATDC-targeting shRNAs in UC9 and UC14 but not control shRNA, resulted in increased miR-29A and B, but not miR-29C levels as measured by TaqMan qRT-PCR (mean±SE, n=3, * p < 0.05 vs WT). (E) Knockdown of ATDC results in lower levels of DNMT3A mRNA as measured by RT-PCR (mean±SE, n=3, * p < 0.05 vs WT). (F) Transfection of both miR-29A and B antisense oligonucleotides allows recovery of DNMT3A expression in ATDC knockdown cell lines, NC = negative control miRNA, CS = control shRNA, AS = antisense miRNA (mean±SE, n=3, * p < 0.05 vs CS) . (G) ATDC overexpression in SV-HUC1 cells induces increased MYC and β-catenin expression and transfection of siRNA targeting MYC and RELA knocked down protein expression. (H) Overexpression of ATDC suppressed miR-29A in SV-HUC1 cells and knockdown of MYC, but not RELA eliminated ATDC suppression of miR-29A (mean±SE, n=3, * p < 0.05 vs siCont).
To determine if ATDC regulation of miR-29 was mediated by MYC or NFKB p65 (RELA) as previously reported in other cell types (40), we overexpressed ATDC in SV-HUC1 immortalized urothelial cells and then knocked down MYC or RELA expression using control or targeting siRNA and measured protein and miR-29 expression. ATDC expression increased β-catenin and MYC expression in urothelial cells (Fig 6G) and resulted in suppression miR-29A expression (Fig 6H). Interestingly, knockdown of MYC, but not RELA, abrogated ATDC-induced suppression of miR-29A (Figure 6H). This result was also observed in the UC9 and UC14 BC cell lines (Supplemental Fig 10). These results demonstrate that ATDC expression upregulated MYC, which repressed transcription of miR-29 and resulted in upregulation of DNMT3A.
Discussion
Although BC is common and can be deadly in its invasive form, the molecular drivers of bladder tumorigenesis are incompletely understood (42). Here, we find that overexpression of ATDC is sufficient to drive formation of both non-invasive and invasive BC in vivo. We report that ATDC is upregulated in the majority of human invasive BCs and we elucidate a mechanism whereby ATDC expression drives MYC upregulation, repressing miR-29, allowing upregulation of DNMT3A and subsequent silencing of PTEN which promotes urothelial tumorigenesis.
While PTEN is important in many tumor types, its contribution to BC is complex. Tg mouse models expressing activated β-catenin in combination with loss of PTEN or activated RAS in uroplakin-expressing cells, develop non-invasive BC, but not muscle-invasive tumors (13,14). In contrast, tg mice with combined PTEN and p53 loss throughout the urothelium (induced by adenoviral Cre recombinase) rapidly develop muscle-invasive disease (16). These results illustrate the importance of PTEN loss to the development of BC and we therefore hypothesized that ATDC induced its tumorigenic effects in the bladder through alterations in PTEN signaling. Consistent with this hypothesis and the PTEN effect in both prior models, tumors from CAG-ATDC mice consistently demonstrated loss of PTEN expression. Further work in vitro and in vivo demonstrated that ATDC up-regulated MYC expression which repressed miR-29A and B1 expression, two microRNAs which bind to complimentary regions in the 3′ UTR of DNMT3A, causing degradation of the mRNA message. ATDC suppressed these microRNAs and in turn drove increased expression of DNMT3A, leading to DNA promoter methylation of PTEN and silencing, events which mediated tumor invasion and proliferation. This novel mode of epigenetic regulation of PTEN may reconcile the low rate of PTEN expression observed in BC with the published reports indicating infrequent PTEN mutation or deletion in BC (5,7).
We have previously shown that ATDC up-regulates β-catenin signaling and induces increased expression of β-catenin transcriptional targets such as MYC (19). The role of β-catenin in invasive BC is poorly defined (19). Interestingly, while ATDC overexpression in the urothelium was sufficient to drive development of both invasive and noninvasive BC, β-catenin and PTEN loss was insufficient to promote development of muscle-invasive tumors in other tg mouse models. We hypothesize that the distinction between CAG-ATDC tumors and other uroplakin-based systems may be related to the urothelial cell subpopulation in which these genes are altered. Recent work suggests that noninvasive and invasive BCs arise from distinct cell populations with the urothelium. The uroplakin expressing intermediate cells give rise to noninvasive tumors while muscle-invasive BC arise exclusively from keratin-5 (K5) expressing basal cells (43,44). Thus PTEN and p53 deletion driven by an adeno-Cre system may have resulted in PTEN deletion in both basal and intermediate cells and resulted in invasive tumor formation whereas; PTEN deletion driven by uroplakin (perhaps limited to the intermediate cell population) resulted in non-invasive tumors. In contrast, the CAG-ATDC transgene was expressed in all urothelial cells inducing both non-invasive and muscle-invasive tumors, a unique aspect of this system.
Here we provide data demonstrating ATDC suppression of miR-29 as a novel mechanism by which DNMT3A and DNA methylation and thereby PTEN is regulated in BC. While miR-29 has been implicated in the regulation DNMT3 and DNA methylation in basal-like breast cancers (45), this is the first report to establish a role in bladder tumor cells. ATDC is highly expressed in multiple tumor types and PTEN loss and miR-29 supression are increasingly recognized as important molecular events in tumor formation and growth. Therefore because ATDC is highly expressed in multiple tumor types including pancreatic, lung, head and neck, and cervical cancers, these findings establish a molecular mechanism of ATDC-mediated tumorigenesis which is likely important across multiple tumor types.
Approximately 15% of non-invasive tumors progress to muscle-invasive disease but the mechanisms that drive invasive progression in this subset are unknown. Interestingly, we show here that ATDC is a driver in the development of both nonmuscle-invasive and muscle-invasive BC in tg mice, with the distribution of tumors that develop dependent on the dose of the ATDC transgene. Furthermore, we provide data highlighting that ATDC is highly expressed in about 20% of human noninvasive BCs. This raises the intriguing hypothesis that ATDC expression in noninvasive BC may predict progression from non-invasive tumors to muscle-invasive disease. This hypothesis is further supported by the invasive gene expression signature of BCs derived from CAG-ATDC mice and by the loss of invasive capacity in BC cell lines when ATDC expression is down-regulated. Although ATDC is beginning to be explored as a prognostic marker (46), additional studies are needed to determine if it is biomarker for a subset of human BCs that are at risk for invasive progression.
In summary, we have identified ATDC overexpression as a driver in bladder tumor formation and identified miR-29 suppression, DNMT3A up-regulation and PTEN silencing as a key mechanism by which ATDC exerts its oncogenic function in mouse models of BC and it’s human counterpart. These data place ATDC as a multifaceted player in bladder tumor formation and progression with important implications for human disease. Given its relevance to human BC, further studies of ATDC-induced tumorigenesis are likely to provide insight into the biology of invasive BC, and potentially provide novel diagnostic and therapeutic strategies for patients.
Supplementary Material
Acknowledgments
We thank the Evan Keller lab for assistance in developing the orthotopic bladder cancer model used in this study. This work was funded by grants from the University of Michigan Cancer Center, the Pardee Foundation, NIH R01 CA131045 and CA17483601A1 (DMS), NIH T32 CA009357 (PLP) and ASCO Young Investigator Award (PLP). We are grateful for assistance received from the University of Michigan Transgenic Animal Model and Vector Cores. The authors disclose no potential conflicts of interest.
Financial Support: This work was funded by grants from the University of Michigan Cancer Center, the Pardee Foundation, NIH R01 CA131045 and CA17483601A1 (DMS), NIH T32 CA009357 (PLP) and ASCO Young Investigator Award (PLP).
Footnotes
The authors disclose no potential conflicts of interest.
References
- 1.Siegel R, Naishadham D, Jemal A. Cancer statistics, 2012. CA Cancer J Clin. 2012;62:10–29. doi: 10.3322/caac.20138. [DOI] [PubMed] [Google Scholar]
- 2.Burger M, Catto JW, Dalbagni G, Grossman HB, Herr H, Karakiewicz P, et al. Epidemiology and risk factors of urothelial bladder cancer. Eur Urol. 2013;63:234–41. doi: 10.1016/j.eururo.2012.07.033. [DOI] [PubMed] [Google Scholar]
- 3.Dinney CP, McConkey DJ, Millikan RE, Wu X, Bar-Eli M, Adam L, et al. Focus on bladder cancer. Cancer Cell. 2004;6:111–6. doi: 10.1016/j.ccr.2004.08.002. [DOI] [PubMed] [Google Scholar]
- 4.Wu X-R. Urothelial tumorigenesis: a tale of divergent pathways. Nature Reviews Cancer. 2005;5:713–25. doi: 10.1038/nrc1697. [DOI] [PubMed] [Google Scholar]
- 5.Platt FM, Hurst CD, Taylor CF, Gregory WM, Harnden P, Knowles MA. Spectrum of phosphatidylinositol 3-kinase pathway gene alterations in bladder cancer. Clin Cancer Res. 2009;15:6008–17. doi: 10.1158/1078-0432.CCR-09-0898. [DOI] [PubMed] [Google Scholar]
- 6.Iyer G, Al-Ahmadie H, Schultz N, Hanrahan AJ, Ostrovnaya I, Balar AV, et al. Prevalence and co-occurrence of actionable genomic alterations in high-grade bladder cancer. J Clin Oncol. 2013;31:3133–40. doi: 10.1200/JCO.2012.46.5740. [DOI] [PMC free article] [PubMed] [Google Scholar]
- 7.TCGAR Network. Comprehensive molecular characterization of urothelial bladder carcinoma. Nature. 2014 doi: 10.1038/nature12965. [DOI] [PMC free article] [PubMed] [Google Scholar]
- 8.Choi W, Czerniak B, Ochoa A, Su X, Siefker-Radtke A, Dinney C, et al. Intrinsic basal and luminal subtypes of muscle-invasive bladder cancer. Nat Rev Urol. 2014;11:400–10. doi: 10.1038/nrurol.2014.129. [DOI] [PubMed] [Google Scholar]
- 9.Damrauer JS, Hoadley KA, Chism DD, Fan C, Tiganelli CJ, Wobker SE, et al. Intrinsic subtypes of high-grade bladder cancer reflect the hallmarks of breast cancer biology. Proc Natl Acad Sci U S A. 2014;111:3110–5. doi: 10.1073/pnas.1318376111. [DOI] [PMC free article] [PubMed] [Google Scholar]
- 10.Hoadley KA, Yau C, Wolf DM, Cherniack AD, Tamborero D, Ng S, et al. Multiplatform Analysis of 12 Cancer Types Reveals Molecular Classification within and across Tissues of Origin. Cell. 2014;158:929–44. doi: 10.1016/j.cell.2014.06.049. [DOI] [PMC free article] [PubMed] [Google Scholar]
- 11.Zhang ZT, Pak J, Huang HY, Shapiro E, Sun TT, Pellicer A, et al. Role of Ha-ras activation in superficial papillary pathway of urothelial tumor formation. Oncogene. 2001;20:1973–80. doi: 10.1038/sj.onc.1204315. [DOI] [PubMed] [Google Scholar]
- 12.Mo L, Zheng X, Huang HY, Shapiro E, Lepor H, Cordon-Cardo C, et al. Hyperactivation of Ha-ras oncogene, but not Ink4a/Arf deficiency, triggers bladder tumorigenesis. J Clin Invest. 2007;117:314–25. doi: 10.1172/JCI30062. [DOI] [PMC free article] [PubMed] [Google Scholar]
- 13.Ahmad I, Morton JP, Singh LB, Radulescu SM, Ridgway RA, Patel S, et al. β-Catenin activation synergizes with PTEN loss to cause bladder cancer formation. Oncogene. 2010;30:178–89. doi: 10.1038/onc.2010.399. [DOI] [PMC free article] [PubMed] [Google Scholar]
- 14.Ahmad I, Patel R, Liu Y, Singh LB, Taketo MM, Wu XR, et al. Ras mutation cooperates with β-catenin activation to drive bladder tumourigenesis. Cell Death Dis. 2011;2:e124. doi: 10.1038/cddis.2011.7. [DOI] [PMC free article] [PubMed] [Google Scholar]
- 15.He F, Mo L, Zheng XY, Hu C, Lepor H, Lee EY, et al. Deficiency of pRb family proteins and p53 in invasive urothelial tumorigenesis. Cancer Res. 2009;69:9413–21. doi: 10.1158/0008-5472.CAN-09-2158. [DOI] [PMC free article] [PubMed] [Google Scholar]
- 16.Puzio-Kuter AM, Castillo-Martin M, Kinkade CW, Wang X, Shen TH, Matos T, et al. Inactivation of p53 and Pten promotes invasive bladder cancer. Genes Dev. 2009;23:675–80. doi: 10.1101/gad.1772909. [DOI] [PMC free article] [PubMed] [Google Scholar]
- 17.Rampias T, Vgenopoulou P, Avgeris M, Polyzos A, Stravodimos K, Valavanis C, et al. A new tumor suppressor role for the Notch pathway in bladder cancer. Nat Med. 2014;20:1199–205. doi: 10.1038/nm.3678. [DOI] [PubMed] [Google Scholar]
- 18.Dyrskjot L, Kruhoffer M, Thykjaer T, Marcussen N, Jensen JL, Moller K, et al. Gene expression in the urinary bladder: a common carcinoma in situ gene expression signature exists disregarding histopathological classification. Cancer Res. 2004;64:4040–8. doi: 10.1158/0008-5472.CAN-03-3620. [DOI] [PubMed] [Google Scholar]
- 19.Wang L, Heidt DG, Lee CJ, Yang H, Logsdon CD, Zhang L, et al. Oncogenic function of ATDC in pancreatic cancer through Wnt pathway activation and beta-catenin stabilization. Cancer Cell. 2009;15:207–19. doi: 10.1016/j.ccr.2009.01.018. [DOI] [PMC free article] [PubMed] [Google Scholar]
- 20.Yuan Z, Villagra A, Peng L, Coppola D, Glozak M, Sotomayor EM, et al. The ATDC (TRIM29) protein binds p53 and antagonizes p53-mediated functions. Mol Cell Biol. 2010;30:3004–15. doi: 10.1128/MCB.01023-09. [DOI] [PMC free article] [PubMed] [Google Scholar]
- 21.Asangani IA, Ateeq B, Cao Q, Dodson L, Pandhi M, Kunju LP, et al. Characterization of the EZH2-MMSET histone methyltransferase regulatory axis in cancer. Mol Cell. 2013;49:80–93. doi: 10.1016/j.molcel.2012.10.008. [DOI] [PMC free article] [PubMed] [Google Scholar]
- 22.Udager AM, Shi Y, Tomlins SA, Alva A, Siddiqui J, Cao X, et al. Frequent discordance between ERG gene rearrangement and ERG protein expression in a rapid autopsy cohort of patients with lethal, metastatic, castration-resistant prostate cancer. Prostate. 2014;74:1199–208. doi: 10.1002/pros.22836. [DOI] [PMC free article] [PubMed] [Google Scholar]
- 23.Tseng-Rogenski S, Lee IL, Gebhardt D, Fischer SM, Wood C, Park JM, et al. Loss of 15-hydroxyprostaglandin dehydrogenase expression disrupts urothelial differentiation. Urology. 2008;71:346–50. doi: 10.1016/j.urology.2007.10.034. [DOI] [PMC free article] [PubMed] [Google Scholar]
- 24.DeGraff DJ, Robinson VL, Shah JB, Brandt WD, Sonpavde G, Kang Y, et al. Current preclinical models for the advancement of translational bladder cancer research. Mol Cancer Ther. 2013;12:121–30. doi: 10.1158/1535-7163.MCT-12-0508. [DOI] [PubMed] [Google Scholar]
- 25.Seager C, Puzio-Kuter AM, Cordon-Cardo C, McKiernan J, Abate-Shen C. Mouse models of human bladder cancer as a tool for drug discovery. Curr Protoc Pharmacol. 2010 doi: 10.1002/0471141755.ph1414s49. Chapter 14:Unit14.14. [DOI] [PMC free article] [PubMed] [Google Scholar]
- 26.Logsdon CD, Simeone DM, Binkley C, Arumugam T, Greenson JK, Giordano TJ, et al. Molecular profiling of pancreatic adenocarcinoma and chronic pancreatitis identifies multiple genes differentially regulated in pancreatic cancer. Cancer Res. 2003;63:2649–57. [PubMed] [Google Scholar]
- 27.Rhodes DR, Kalyana-Sundaram S, Tomlins SA, Mahavisno V, Kasper N, Varambally R, et al. Neoplasia. Vol. 9. New York, NY: 2007. Molecular concepts analysis links tumors, pathways, mechanisms, and drugs; pp. 443–54. [DOI] [PMC free article] [PubMed] [Google Scholar]
- 28.Oncomine™. (Compendia Bioscience, Ann Arbor, MI) was used for analysis and visualization.
- 29.Su AI, Welsh JB, Sapinoso LM, Kern SG, Dimitrov P, Lapp H, et al. Molecular classification of human carcinomas by use of gene expression signatures. Cancer Res. 2001;61:7388–93. [PubMed] [Google Scholar]
- 30.Sanchez-Carbayo M, Socci ND, Lozano J, Saint F, Cordon-Cardo C. Defining molecular profiles of poor outcome in patients with invasive bladder cancer using oligonucleotide microarrays. J Clin Oncol. 2006;24:778–89. doi: 10.1200/JCO.2005.03.2375. [DOI] [PubMed] [Google Scholar]
- 31.Masuda Y, Takahashi H, Sato S, Tomomori-Sato C, Saraf A, Washburn MP, et al. TRIM29 regulates the assembly of DNA repair proteins into damaged chromatin. Nat Commun. 2015;6:7299. doi: 10.1038/ncomms8299. [DOI] [PubMed] [Google Scholar]
- 32.Wu Y, Siadaty MS, Berens ME, Hampton GM, Theodorescu D. Overlapping gene expression profiles of cell migration and tumor invasion in human bladder cancer identify metallothionein 1E and nicotinamide N-methyltransferase as novel regulators of cell migration. Oncogene. 2008;27:6679–89. doi: 10.1038/onc.2008.264. [DOI] [PMC free article] [PubMed] [Google Scholar]
- 33.Tsuruta H, Kishimoto H, Sasaki T, Horie Y, Natsui M, Shibata Y, et al. Hyperplasia and carcinomas in Pten-deficient mice and reduced PTEN protein in human bladder cancer patients. Cancer Res. 2006;66:8389–96. doi: 10.1158/0008-5472.CAN-05-4627. [DOI] [PubMed] [Google Scholar]
- 34.Hollander MC, Blumenthal GM, Dennis PA. PTEN loss in the continuum of common cancers, rare syndromes and mouse models. Nat Rev Cancer. 2011;11:289–301. doi: 10.1038/nrc3037. [DOI] [PMC free article] [PubMed] [Google Scholar]
- 35.Dai F, Zhang Y, Zhu X, Shan N, Chen Y. Anticancer role of MUC1 aptamer-miR-29b chimera in epithelial ovarian carcinoma cells through regulation of PTEN methylation. Target Oncol. 2012;7:217–25. doi: 10.1007/s11523-012-0236-7. [DOI] [PubMed] [Google Scholar]
- 36.Chédin F. The DNMT3 family of mammalian de novo DNA methyltransferases. Prog Mol Biol Transl Sci. 2011;101:255–85. doi: 10.1016/B978-0-12-387685-0.00007-X. [DOI] [PubMed] [Google Scholar]
- 37.Zhao Z, Wu Q, Cheng J, Qiu X, Zhang J, Fan H. Depletion of DNMT3A suppressed cell proliferation and restored PTEN in hepatocellular carcinoma cell. J Biomed Biotechnol. 2010;737535 doi: 10.1155/2010/737535. [DOI] [PMC free article] [PubMed] [Google Scholar]
- 38.Fabbri M, Garzon R, Cimmino A, Liu Z, Zanesi N, Callegari E, et al. MicroRNA-29 family reverts aberrant methylation in lung cancer by targeting DNA methyltransferases 3A and 3B. Proc Natl Acad Sci U S A. 2007;104:15805–10. doi: 10.1073/pnas.0707628104. [DOI] [PMC free article] [PubMed] [Google Scholar]
- 39.Morita S, Horii T, Kimura M, Ochiya T, Tajima S, Hatada I. miR-29 represses the activities of DNA methyltransferases and DNA demethylases. Int J Mol Sci. 2013;14:14647–58. doi: 10.3390/ijms140714647. [DOI] [PMC free article] [PubMed] [Google Scholar]
- 40.Mott JL, Kurita S, Cazanave SC, Bronk SF, Werneburg NW, Fernandez-Zapico ME. Transcriptional suppression of mir-29b-1/mir-29a promoter by c-Myc, hedgehog, and NF-kappaB. J Cell Biochem. 2010;110:1155–64. doi: 10.1002/jcb.22630. [DOI] [PMC free article] [PubMed] [Google Scholar]
- 41.Zhang X, Zhao X, Fiskus W, Lin J, Lwin T, Rao R, et al. Coordinated silencing of MYC-mediated miR-29 by HDAC3 and EZH2 as a therapeutic target of histone modification in aggressive B-Cell lymphomas. Cancer Cell. 2012;22:506–23. doi: 10.1016/j.ccr.2012.09.003. [DOI] [PMC free article] [PubMed] [Google Scholar] [Retracted]
- 42.Jemal A, Siegel R, Ward E, Hao Y, Xu J, Thun MJ. Cancer statistics, 2009. CA Cancer J Clin. 2009;59:225–49. doi: 10.3322/caac.20006. [DOI] [PubMed] [Google Scholar]
- 43.Shin K, Lim A, Odegaard JI, Honeycutt JD, Kawano S, Hsieh MH, et al. Cellular origin of bladder neoplasia and tissue dynamics of its progression to invasive carcinoma. Nat Cell Biol. 2014;16:469–78. doi: 10.1038/ncb2956. [DOI] [PMC free article] [PubMed] [Google Scholar]
- 44.Van Batavia J, Yamany T, Molotkov A, Dan H, Mansukhani M, Batourina E, et al. Bladder cancers arise from distinct urothelial sub-populations. Nat Cell Biol. 2014;16:982–91. 1–5. doi: 10.1038/ncb3038. [DOI] [PubMed] [Google Scholar]
- 45.Sandhu R, Rivenbark AG, Mackler RM, Livasy CA, Coleman WB. Dysregulation of microRNA expression drives aberrant DNA hypermethylation in basal-like breast cancer. Int J Oncol. 2014;44:563–72. doi: 10.3892/ijo.2013.2197. [DOI] [PMC free article] [PubMed] [Google Scholar]
- 46.Fristrup N, Birkenkamp-Demtröder K, Reinert T, Sanchez-Carbayo M, Segersten U, Malmström PU, et al. Multicenter Validation of Cyclin D1, MCM7, TRIM29, and UBE2C as Prognostic Protein Markers in Non-Muscle-Invasive Bladder Cancer. Am J Pathol. 2013;182:339–49. doi: 10.1016/j.ajpath.2012.10.017. [DOI] [PubMed] [Google Scholar]
Associated Data
This section collects any data citations, data availability statements, or supplementary materials included in this article.