Abstract
Previous research has demonstrated that acoustic radiation force enhances intravascular microbubble adhesion to blood vessels in the presence of flow for molecular-targeted ultrasound imaging and drug delivery. A prototype acoustic radiation force intravascular ultrasound (ARFIVUS) catheter was designed and fabricated to displace a microbubble contrast agent in flow representative of conditions encountered in the human carotid artery. The prototype ARFIVUS transducer was designed to match the resonance frequency of 1.4- to 2.6-μm-diameter microbubbles modeled by an experimentally verified 1-D microbubble acoustic radiation force translation model. The transducer element was an elongated Navy Type I (hard) lead zirconate titanate (PZT) ceramic designed to operate at 3 MHz. Fabricated devices operated with center frequencies of 3.3 and 3.6 MHz with −6-dB fractional bandwidths of 55% and 50%, respectively. Microbubble translation velocities as high as 0.86 m/s were measured using a high-speed streak camera when insonating with the ARFIVUS transducer. Finally, the prototype was used to displace microbubbles in a flow phantom while imaging with a commercial 45-MHz imaging IVUS transducer. A sustained increase of 31 dB in average video intensity was measured following insonation with the ARFIVUS, indicating microbubble accumulation resulting from the application of acoustic radiation force.
I. Introduction
Microbubbles are ultrasound contrast agents with diameters typically less than 5 μm that are comprised of a polymer, albumin, or lipid shell that surrounds a gas core [1]. Microbubbles have demonstrated utility for molecular-targeted imaging [2]–[5] and therapeutic applications [6]–[10]. Molecular targeting is achieved by conjugating ligands to the microbubble shell, which are targeted to specific cell surface proteins, such as disease markers [1], [2], [11]. Thus, disease can be detected based on a molecular signature before anatomical or functional manifestation, providing the opportunity for preventative action such as drug therapy or lifestyle change [1]. In addition to early disease detection, enhanced local delivery of therapeutic agents (i.e., genes or drugs) has been demonstrated using microbubbles through a process known as sonoporation [12], [13]. A variety of methods for drug/gene loading of microbubbles have been adapted to incorporate different therapeutic agents (e.g., plasmid DNA, lipophilic drug, hydrophilic drug) according to solubility [9], [14]–[21]. Incorporation of a therapeutic agent into a molecular-targeted microbubble produces a microbubble capable of molecular targeting and therapy [17], [22]. The application of ultrasound in the presence of microbubbles and therapeutic agent simultaneously increases cell permeability and releases therapeutic agent at the precise location of disease, achieving enhanced therapeutic agent delivery relative to treatment with ultrasound and therapeutic agent without microbubbles [23]. Increasing acoustic pressure promotes unstable microbubble cavitation which enhances cell permeabilization but decreases cell viability [24], [25].
Although molecular targeting of microbubbles increases the affinity and specificity for a target [1], microbubble adhesion is limited in large vessels by high-shear flow conditions [26] and flotation resulting from blood vessel orientation [27]. In light of these challenges, acoustic radiation force (ARF) has been applied, which produces a pressure gradient that displaces the microbubbles away from the acoustic source, enhances microbubble localization and accumulation near the disease site, and overcomes flow and flotation limitations [28]–[30]. For enhanced ARF application, custom ultrasound transducers have been designed which generally incorporate separate elements to stimulate lipid-shelled microbubbles at the microbubble's resonance frequency (typically less than 5 MHz) and image at higher frequencies [31]–[33]. Although noninvasive methods are preferred, in vascular applications, uniform accumulation along the circumference of the vessel wall requires insonating from multiple sides of the vessel, complicating microbubble imaging and delivery. Further, regions of interest including the coronary artery can be masked by the lungs or ribs, preventing reliable access using transcutaneous ultrasound.
Intravascular ultrasound (IVUS) is a catheter-based imaging approach that produces tomographic images of the vessel lumen and surrounding tissue, overcoming penetration depth issues by placing the ultrasound transducer in the body [34]. In a clinical setting, IVUS has many uses, including selection of intravascular interventions based on plaque shape, composition, and vessel anatomy [34], [35] and verification of proper application of intravascular intervention (e.g., angioplasty, atherorectomy, stent deployment) [35]. There are few IVUS transducers that have been designed specifically for microbubble applications, and these IVUS transducers have been modified from high-frequency applications, resulting in frequencies much higher than the resonance frequencies of microbubbles [36]–[39].
In this paper, we present the first acoustic radiation force IVUS (ARFIVUS) transducer designed to translate microbubbles to the vessel wall under flow velocities comparable to the human common carotid artery (minimum velocity = 209 mm/s) or coronary artery (minimum velocity = 44 mm/s, average systolic peak velocity = 107 mm/s [40]–[42]) for the purpose of enhancing intravascular microbubble binding efficiency and drug delivery. A 1-D microbubble ARF translation model, derived from prior work [43], is used to predict the optimal ultrasound frequency within the dimensional constraints of the coronary artery. The fabrication of the ARFIVUS prototype is described in detail. Microbubble displacements are recorded using a high-speed streak (1-D versus time) camera and the resulting microbubble displacements determined from the streak images are then compared with the 1-D microbubble translation model results. Finally, video intensity is monitored with a commercial IVUS transducer while the ARFIVUS-induced microbubble displacements are observed using a commercial IVUS imaging system under flow velocities comparable to the human carotid artery.
II. Methods
A. Microbubble ARF Translation Model
An experimentally verified 1-D microbubble ARF translation model developed by Dayton et al. [43] was implemented in Matlab (The MathWorks Inc., Natick, MA) to guide the design of the ARFIVUS transducer. A correction to the friction term of the force balance equation, based on the original work of Krishnan and Leighton [44], was applied to account for the small diameter of the capillary tube used in the experiments (see Appendix A).
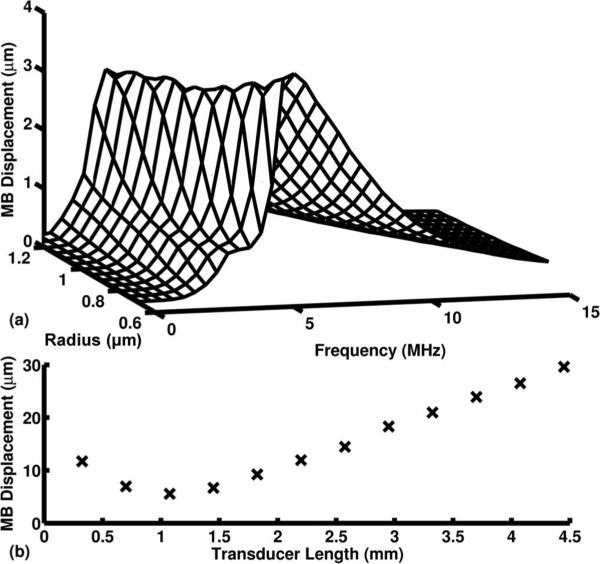
Microbubble translation was simulated for excitation frequencies from 0.1 to 15 MHz for microbubble radii from 0.7 to 1.3 μm at peak negative pressure (PNP) = 180 kPa and a pulse length of 6.67 μs. The center frequency selected for the ARFIVUS (3 MHz) was the frequency of the greatest microbubble displacements. This selection was consistent with PZT lateral-mode transducer designs dimensionally compatible with the intended application (i.e., <6F-catheter).
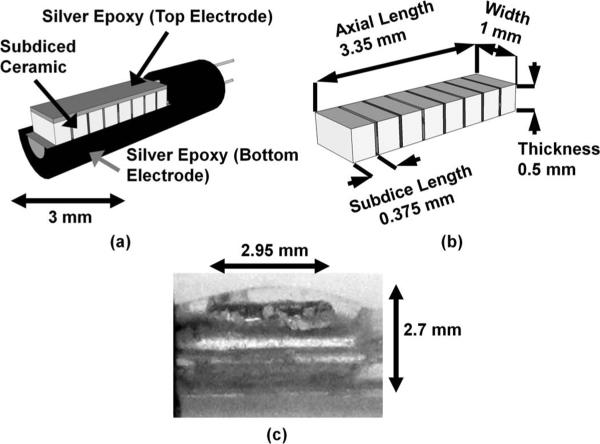
The expected ARF translations of microbubbles, when varying transducer dimensions, were simulated using the 1-D microbubble ARF translation model and finite element analysis (FEA) modeled azimuthal beam profiles. The transducer width is constrained to <1 mm by the diameter of the catheter, and the axial length of the transducer was varied between 0.375 and 5.050 mm [Fig. 1(b)]. A microbubble with a 2.2-μm diameter and a constant flow velocity of 40 mm/s was simulated. A 20-cycle, 3-MHz Gaussian ramped sinusoid pulse, previously used by Dayton et al. [43], was weighted by the normalized beam profile at 2 mm depth with a maximum PNP = 180 kPa along the beam axis.
Fig. 1.
(a) Isometric view of the acoustic radiation force intravascular ultrasound (ARFIVUS) transducer schematic illustrating the ceramic subdicing. (b) Isometric view of the ARFIVUS transducer element schematic illustrating dimensions. (c) Side view of completed ARFIVUS transducer.
B. IVUS Transducer Finite Element Modeling
An ARFIVUS transducer with an optimal center frequency as simulated in the preceding section was designed iteratively using PZFlex FEA software (Weidlinger Associates Inc., Mountain View, CA). A hard Navy Type-I PZT ceramic with a high Curie temperature and a low dissipation factor was selected for reliable high-duty-cycle operation. The 3-D finite element model used quarter symmetry and was excited with a 3-MHz, 200% −6-dB fractional bandwidth Gaussian pulse. The finite element model grid element dimensions, specified as length × width × depth, were 18.5 × 18.5 × 9.25 μm (λ/20 × λ/20 × λ/40) in the region of the transducer, and 37 μm (λ/10) in the surrounding region (nonlinear water medium). The grid dimensions were selected to minimize dispersion errors in the FEA [32]. An absorbing condition was applied along the outer boundaries of the model (boundaries 1, 3, 4, and 5). A subdiced, nonconducting epoxy filled (ρ = 1180 kg/m3, Vl = 2530 m/s, Vs = 1246 m/s) [45], elongated, single-element transducer was designed to promote lateral-mode operation in the axial length dimension and mitigate the risk of spurious thickness and width mode operation. The simulated acoustic output was later compared with experimental acoustic output from a fabricated prototype for model validation. The final subdiced element design dimensions were 1 mm wide × 0.375 mm long [Fig. 1(b)].
C. Catheter Fabrication
The transducer ceramic used for prototype fabrication was a 508-μm-thick EBL #1 ceramic (EBL Products Inc., East Hartford, CT). The ceramic was subdiced into 0.95-mm-wide × 0.325-mm-long elements using a dicing saw (DAD 3220, DISCO Hi-Tec America Inc., Santa Clara, CA) and 50-μm kerfs were backfilled with a 10:3 weight ratio of RE2039 epoxy and HD3561 hardener (Henkel Corp., City of Industry, CA); see Fig. 1. The ground electrode, which also served as the backing layer, and the signal electrode on the face of the transducer were applied using CHO-BOND 584 silver epoxy (Chomerics, Woburn, MA). The final device was sealed with RE2039/HD3561 epoxy to prevent water damage and short-circuiting [Fig. 1(c)]. The transducer consisted of 8 subdiced elements for a total length of 2.95 mm.
D. IVUS Transducer Prototype Characterization
Transducer performance measurements were collected in deionized water using a capsule hydrophone and 17-dB preamplifier (GL-0085, Onda Corp., Sunnyvale, CA). The transducer was excited by a 3-MHz, 200% −6-dB fractional bandwidth (pulse length = 0.38 μs), Vpeak = 117 V Gaussian pulse produced by a waveform generator (AWG2021, Tektronix Inc., Beaverton, OR) and 55-dB RF amplifier (A150, Electronic Navigation Industries, Rochester, NY). The voltage was measured from the amplifier output with the transducer connected in the circuit. The transducer beam profile was measured by translating the hydrophone with a 3-axis motion stage (ESP 300, Newport Corp., Irvine, CA) and collecting output voltage with an oscilloscope (LC334, LeCroy Corp., Chestnut Ridge, NY). Both instruments were controlled by a custom Labview (National Instruments Corp., Austin, TX) computer program. All transducer measurements were performed in the far field (z = 11 mm).
E. Microbubble Preparation
Microbubbles were prepared as described in previous studies by our laboratory [15]. Briefly, phosphatidylcholine and polyethylene glycol stearate (2 mg/mL in normal saline) were sonicated (XL2020, Misonix Inc., Farmingdale, NY) to generate an aqueous micellar dispersion. Decafluorobutane gas was then sparged through the aqueous phase and the sonication continued at maximum power, creating gas microbubbles. The bubble dispersion was stored under decafluorobutane atmosphere, in sealed vials, under refrigeration. Microbubble distributions and concentrations were determined using a Multisizer 3 (Beckman Coulter Inc., Brea, CA); see Table I. Microbubbles were diluted in saline for streak imaging and in deionized water for flow experiments.
TABLE I.
Microbubble Statistics from Multisizer 3 Measurements of Microbubbles Used in Experiments.
| Use | Vial concentration (microbubbles/mL) | Mean bubble diameter (μm) | Standard deviation (μm) | Median bubble diameter (μm) |
|---|---|---|---|---|
| Streak images | 2.44 × 10⁹ | 2.18 | 1.11 | 1.85 |
| Wall-less flow phantom experiments (40 mm/s, 200 mm/s) | 7.53 × 10⁹ | 2.26 | 1.19 | 1.91 |
| Wall-less flow phantom experiment (100 mm/s) | 4.07 × 10⁹ | 2.30 | 1.57 | 1.84 |
F. High-Speed Microbubble Displacement Measurements
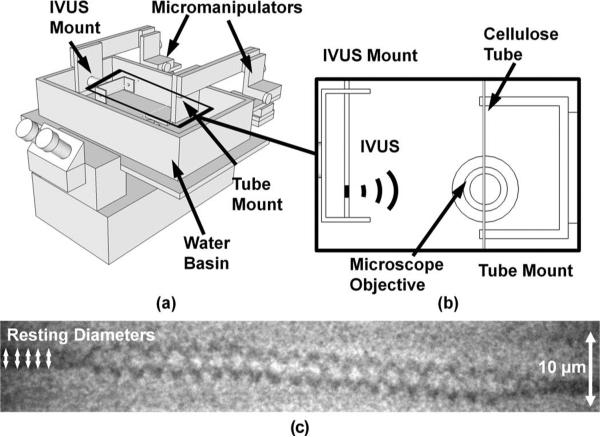
Microbubble displacements resulting from acoustic radiation force were measured using a high-speed streak camera (SC-10, Optronis, Kehl, Germany) and an inverted microscope (IX71, Olympus Corp., Center Valley, PA); see Fig. 2. Streak images (1-D versus time) were collected with a temporal resolution of 7.18 ns (streak rate = 500 ns/mm, slit width = 5 μm). A Xenon flash lamp (SIAD300-IMS, Specialised Imaging Inc., Simi Valley, CA) provided illumination during streak image acquisition. The microbubble dispersions were diluted in saline to concentrations of approximately 1 microbubble/μL to minimize secondary radiation forces between microbubbles. A 200-μm cellulose tube (Spectra/Por Spectrum Laboratories Inc., Los Angeles, CA) was submerged in a deionized water bath and imaged using a 100× water immersion objective (numerical aperture = 1.0); see Fig. 2. The ARFIVUS transducer was aligned by measuring the peak negative voltage from a needle hydrophone (HNC-0200, Onda Corp.) in the optical focus. The cellulose tube, acting as a container for the microbubble dispersion, was then placed in the optical focus and the dilute microbubble dispersion was drawn into the cellulose tube. Then, the ARFIVUS transducer transmitted a single pulse while a streak image was recorded. Microbubbles (diameters = 1.2 to 3.8 μm) were insonated with a 20-cycle, 3-MHz Gaussian ramped sinusoid pulse at PNP = 350 kPa (17 microbubbles) and PNP = 545 kPa (40 microbubbles).
Fig. 2.
(a) Schematic diagram of the high-speed streak camera apparatus. (b) Top view of the center of the water basin with the microscope objective. The intravascular ultrasound (IVUS) transducer was located 1.2 cm from the optical focus of the microscope objective. (Placement was limited by mechanical interference.) (c) An example streak image from the SC-10 high-speed streak camera with a total duration of 10 μs. The transducer was located above the image and the microbubble was displaced away from the transducer by the acoustic radiation force.
G. Comparison of High-Speed Streak Data With 1-D Model
The acquired streak image [Fig. 2(c)] intensity was adjusted for flash illumination by subtracting the mean intensity as it varied with time. Image contrast was improved using the Matlab imadjust command to saturate 1% of the pixels at the lowest and highest intensities. The streak image spatial resolution was 0.5 μm, as determined by the microscope objective and the streak camera. The initial microbubble diameter was measured by selecting the upper and lower boundary of the microbubble in the streak image at 5 time points before insonation began [Fig. 2(c)], and averaging the result. Microbubble translation was tracked by manually selecting the center of the microbubble across the streak image. Microbubble displacements less than the resolution of the streak imaging system (0.5 μm) were not included in the analysis. For the smallest measured displacement (0.54 μm), the maximum possible error due to measurement uncertainty was 46%.
1-D simulations of microbubble translation were compared with optical displacement measurements by simulating displacement for the measured microbubble diameters. The percent error was calculated as the absolute value of the difference between the simulated and experimental results divided by the simulated result and multiplied by 100.
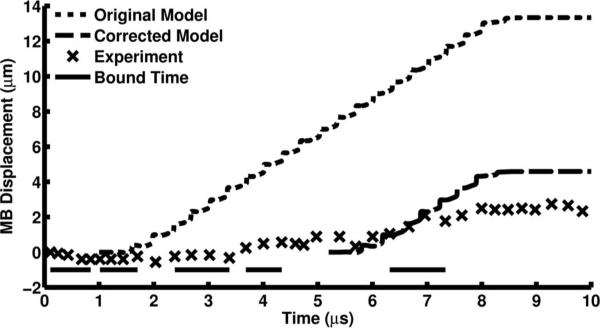
Nonspecific binding of microbubbles to the 200-μm cellulose tube was observed in most of the microbubble translation experiments and is consistent with previous observations [46]. To compensate for microbubbles binding to the cellulose tube, the microbubble “bound time” was determined. The microbubble translation slope was measured as the difference in displacement divided by the time between measurements. The microbubble was considered bound when the microbubble translation slope was less than a selected value (0.64 μm/μs) for more than two experimental time points during microbubble insonation, from 1 to 8.5 μs (Fig. 3). The lengths of time the microbubble was bound for each bound period were summed to determine the bound time and subtracted from the total insonation time (7.5 μs) to compute the time that the microbubble was unbound during insonation, resulting in a corrected insonation time (Fig. 3). Translation was simulated again using these corrected insonation times and compared with the original simulation and experimental results.
Fig. 3.
An example position time curve collected from a high-speed streak image and the simulated microbubble displacement. The 1.9-μm-diameter microbubble was excited with a PNP = 545 kPa, 20-cycle, 3-MHz Gaussian ramped sinusoid pulse. Microbubble insonation began at 1 μs and stopped at 8.5 μs and bound time was only calculated within this period.
H. Microbubble Displacement in Flow
A gelatin flow phantom was prepared as described by Patil et al. [27]. A heated mixture of 6% w/v gelatin, 1% w/v agar, and deionized water was poured into a mold with tubing and allowed to cool and set. Before experiments, the tubing was removed from the flow phantoms, leaving bare gelatin channels 6 mm in diameter, comparable to the size of the human common carotid artery [40].
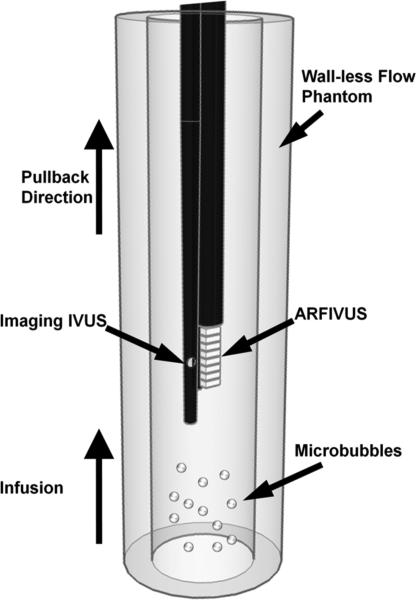
The flow phantom was mounted vertically to prevent microbubble flotation to the channel walls (Fig. 4). The ARFIVUS transducer was attached to a Revolution IVUS catheter operated by an In-Vision Gold intravascular ultrasound system (Volcano Corp., Rancho Cordova, CA). The IVUS assembly was inserted into the flow phantom channel from the top. The Revolution IVUS catheter (diameter = 3.2F, fc = 42.3 MHz) imaged the accumulation of microbubbles along the phantom wall in real time while the ARFIVUS catheter was operating.
Fig. 4.
Schematic of the flow phantom experiment apparatus.
Initially, no microbubbles were infused into the flow phantom lumen to provide a microbubble-free control image. After 10 s, microbubbles (5 × 10⁶ microbubbles/mL) were infused using syringe pumps (PHD 2000, Harvard Apparatus, Holliston, MA). After 30 s of microbubble infusion and ARFIVUS transmission, deionized water was infused for 40 s to remove unbound microbubbles. Following the flushing of unbound microbubbles in the 100-mm/s experiment, the imaging transducer was translated to the distal end of the catheter, below the ARFIVUS transducer, using the manual pullback feature. Once in position below the ARFIVUS, the automatic pullback feature of the In-Vision Gold IVUS system imaged along the length of the lumen at a velocity of 0.5 mm/s. The ARFIVUS transducer transmitted a PNP = 450 kPa, 20-cycle, 3-MHz Gaussian ramped sinusoid pulse at a PRF = 10 kHz (z = 2.9 mm). Microbubbles were infused at flow rates of 67.8, 169.7, and 339.3 mL/min (flow velocities of 40, 100, and 200 mm/s, respectively) which are comparable to the minimum flow velocity in the human coronary artery, average systolic peak flow velocity in the human coronary artery, and the minimum flow velocity in the human common carotid artery, respectively [40]–[42]. During periods of minimum flow velocity, microbubble insonation time will be greatest, maximizing microbubble radial displacement by acoustic radiation force.
Following experiments, DICOM image files were copied to a CD and transferred to a PC for data processing. (RF data was not available from our Volcano In-Vision Gold IVUS system.)
III. Results
A. Microbubble ARF Translation Model
The greatest simulated microbubble displacements occurred when the center frequency of the insonation pulse was between 3 and 5 MHz [Fig. 5(a)]. A transducer frequency of 3 MHz was selected to displace the microbubble population.
Fig. 5.
(a) Results from the 1-D microbubble acoustic radiation force (ARF) translation model [43]. Microbubble (MB) displacements when excited with a 6.67-μs pulse of varying excitation frequency and a PNP = 180 kPa were modeled. (b) Simulated MB displacement with varying transducer length when excited with a 1 kHz PRF, 20-cycle, 3-MHz Gaussian ramped sinusoid pulse with PNP = 180 kPa at the transducer center.
Microbubble displacement increased linearly for ARFIVUS transducer lengths greater than 1.5 mm [Fig. 5(b)]. As the transducer length decreased to less than 1 mm, the overall displacement increased. This can be attributed to an increase in the full-width at half-maximum beam width of the transducer as the length is decreased. Although this may suggest that a 0.8-mm-long transducer can achieve better displacement results than a 1.65-mm transducer, this result is misleading because the shorter transducer will yield a lower output pressure and higher impedance, resulting in a suboptimal transducer design.
B. IVUS Transducer Simulation and Prototype Characterization
According to PZFlex simulation, a final ARFIVUS ceramic thickness of 500 μm was needed to create a device with a center frequency of 3.3 MHz. The completed ARFIVUS catheter diameter was 8.1F (2.7 mm); see Fig. 1(c).
Two ARFIVUS transducers were fabricated and used for the experiments. The characteristics of the two devices are listed in Table II. From the one-way response measured by a hydrophone in the far field [Fig. 6(a)], the normalized cross-correlation coefficient of the simulated time-domain pressure pulse when compared with the hydrophone measurement was calculated. In addition, the percent difference in PNP between the model and the prototype is reported. The transfer function (impulse response) of the prototype was calculated by deconvolving the excitation function spectrum from the transmit response spectrum [Fig. 6(b)]. The simulated center frequency was 3.4 MHz with a −6-dB fractional bandwidth of 60%. The measured transducer −6-dB lateral beam widths were 3.35 and 4 mm (z = 11 mm), and approximately matched the FEA modeled beam width [Fig. 6(c)]. After observing the experimental beam profile, an FEA model without axial length symmetry was prepared to model the effect of the asymmetric silver epoxy layer on the top electrode (Fig. 6). The silver epoxy on the face of the transducer was thicker across the first subdiced transducer element (normal thickness = 150 μm, increased thickness = 700 μm) than the rest of the subdiced elements (thickness = 150 μm). This improved the match between the FEA and experimental results for the first ARFIVUS transducer.
TABLE II.
ARFIVUS Transducer Characteristics.
| Device | Center frequency (MHz) | –6-dB fractional bandwidth (%) | –6-dB azimuthal beam width at z = 11 mm (mm) | IVUS diameter (Fr) | Normalized cross-correlation of the time-domain pulse | PNP ratio of the time-domain pulse (experiment/simulation) |
|---|---|---|---|---|---|---|
| 1 | 3.3 | 55 | 3.31 | 8.1 | 0.97 | 1.1 |
| 2 | 3.6 | 50 | 4.0 | 6.8 | 0.97 | 0.94 |
Fig. 6.
Acoustic radiation force intravascular ultrasound (ARFIVUS) 1 characterization: (a) finite element analysis (FEA), experiment, and asymmetric-epoxy-corrected FEA normalized output pressure measured when excited with a 3-MHz, 200% −6-dB fractional bandwidth Gaussian pulse (z = 11 mm). (b) FEA, experimental, and asymmetric epoxy corrected FEA spectra after deconvolution of (a) with the excitation pulse. (c) Lateral beam profile from FEA, experimental, and asymmetric epoxy corrected FEA in the far field (z = 11 mm).
C. High-Speed Microbubble Displacement Measurements
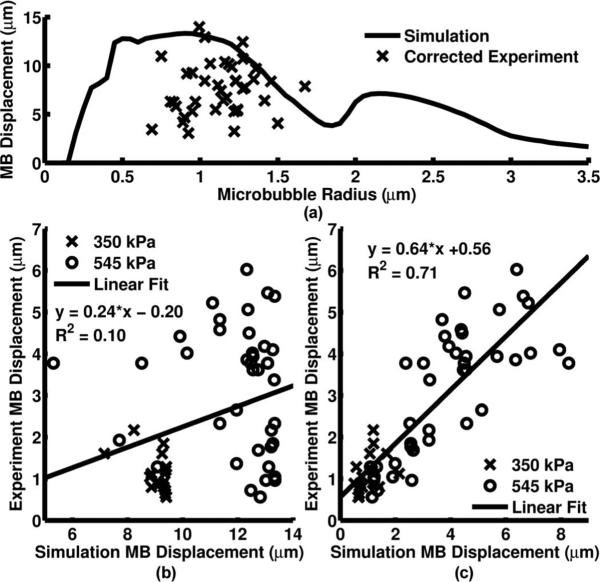
Corrected microbubble displacements resulting from a 20-cycle, 3-MHz Gaussian ramped sinusoid pulse with PNP = 545 kPa were measured and compared with the simulated microbubble displacements according to the 1-D microbubble ARF translation model [Fig. 7(a)]. The measured displacement was plotted against the simulated displacement before insonation time reduction [Fig. 7(b)] and then after insonation time was reduced based on the bound time [Fig. 7(c)]. Best fit curves were also calculated for the original and corrected time simulations [Figs. 7(b) and 7(c)]. The percent errors were 77.2% and 29.8% for the original and corrected time simulations, respectively.
Fig. 7.
(a) Simulated and corrected experimental microbubble displacements plotted with respect to initial microbubble radius when excited with a PNP = 545 kPa, 20-cycle, 3-MHz Gaussian ramped sinusoid pulse from the acoustic radiation force intravascular ultrasound (ARFIVUS) transducer. (b) Measured microbubble displacement plotted against the 20-cycle simulated microbubble displacement for both PNP = 350 kPa and PNP = 545 kPa. (c) Measured microbubble displacement plotted against the corrected time simulated microbubble displacement for both PNP = 350 kPa and PNP = 545 kPa.
D. Microbubble Displacement in Flow
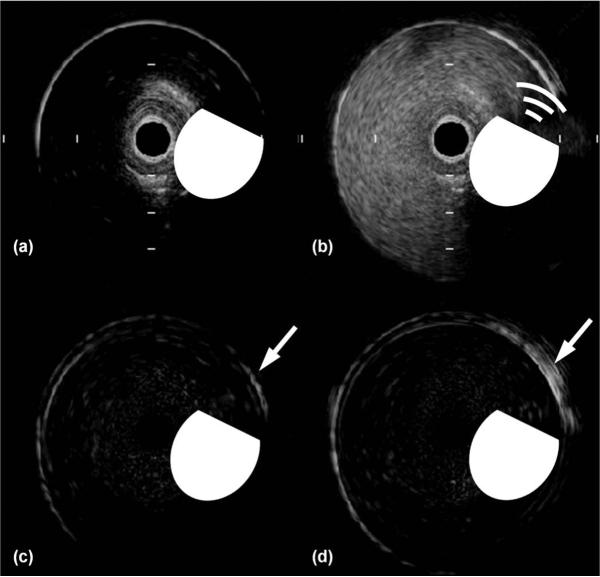
Images were acquired from a 45-MHz IVUS catheter in the flow phantom during 67.8, 169.7, and 339 mL/min flow (Fig. 8). An increase in lumen signal intensity was observed during microbubble infusion [Fig. 8(b)]. The first frame [Fig. 8(a)] was subtracted from the final frame for the cases without, and with, ARFIVUS transmission [Figs. 8(c) and 8(d), respectively].
Fig. 8.
Selected frames from the Volcano Revolution intravascular ultrasound (IVUS) image sequence of the flow phantom with a flow rate of 67.8 mL/min. (a) IVUS image before microbubble infusion. (b) IVUS image during microbubble infusion and acoustic radiation force intravascular ultrasound (ARFIVUS) transmission. (c) IVUS image after microbubble infusion without ARFIVUS transmission with the first frame (a) subtracted. (d) IVUS image after microbubble infusion and ARFIVUS transmission with the first frame (a) subtracted showing a video intensity increase in the region of interest (arrow). The beveled circle is a scaled symbol representing the ARFIVUS transducer, where the beveled edge represents the front face of the transducer. The tick-mark spacing is 1 mm and the image diameter is 8 mm.
The change in video intensity with time was calculated for the portion of the lumen wall directly in front of the ARFIVUS transducer both when the ARFIVUS was transmitting and when it was switched off (Fig. 9). The average intensity was measured in the same region for cases with, and without, ARF transmission. At all flow rates, ARF cases maintained an increase in video intensity after microbubble infusion was completed [arrow iii in Fig. 9(a)]. The increases in average video intensity were 15, 13, and 31 dB in the 40-, 100-, and 200-mm/s cases, respectively. The channels that were not treated with acoustic radiation force returned to their original video intensity [Fig. 9(a)]. The gradient of video intensity measured along the circumference of the channel was similar for all three flow rates, with −6-dB widths of 69.5°, 50.8°, and 55.5° for flow velocities of 40, 100, and 200 mm/s respectively [Fig. 9(b)]. During pullback imaging, the center of the ARFIVUS was located at approximately 4.5 mm, within the region of peak video intensity, approximately 20 dB higher than the untreated portion of the lumen [Fig. 9(c)].
Fig. 9.
(a) The change in average video intensity during flow phantom experiments for varying flow velocities. Arrows on the plot indicate the times when the following events occurred: i) microbubble infusion began, ii) microbubble infusion stopped, iii) water infusion began. (b) Video intensity gradient along the perimeter of the channel at varying flow velocities after iii) water infusion began. (c) Video intensity gradient along the length of the channel following iii) water infusion.
IV. Discussion
A transducer for microbubble acoustic radiation force translation must fulfill three requirements. First, the transducer should ideally have a center frequency matched to the resonance frequency of the microbubbles. Second, the transducer must be designed within the dimensional constraints of the application. Third, the transducer must be able to withstand high-duty-cycle operation to allow for effective microbubble translation.
The prototype center frequency was selected based on the 1-D microbubble ARF translation model, resulting in a transducer designed specifically for microbubble translation. For the microbubbles used in this study, the greatest simulated displacements occurred at frequencies from 3 to 5 MHz [Fig. 5(a)]. Traditional IVUS imaging catheters (e.g., Boston Scientific Atlantis or Volcano Revolution) use frequencies in the range of 30 to 45 MHz to provide high-resolution intravascular images. The prototype ARFIVUS center frequency of 3.3 MHz was much lower than that of a commercial imaging IVUS catheter to operate closer to the resonance frequencies of the 1.4- to 2.6-μm-diameter microbubbles.
In addition to center frequency selection, the 1-D microbubble ARF translation model was used to guide device length selection when taking flow into account [Fig. 5(b)]. Increasing device length can increase microbubble insonation time and result in higher displacements, but this is limited by the IVUS catheter dimensions required to navigate the vasculature. Simulating the device using PZFlex produced a design with the desired center frequency and dimensions. The normalized correlation coefficient of the time domain pressure pulse for both ARFIVUS transducers of 0.97 was a good match, and the center frequencies of the modeled and measured transducer were within 100 kHz. The beam profile prediction of the FEA was good for the positive azimuthal direction but diverges significantly from FEA at −3 mm. A poorly characterized asymmetric silver epoxy layer probably accounts for the asymmetric beam profile. An asymmetric top electrode was used to model the asymmetric silver epoxy layer in later simulations (Fig. 6). The high-duty-cycle operation requirement was met by selecting a hard PZT ceramic with a high Curie temperature and a low electrical dissipation factor.
After comparison with the 1-D microbubble ARF translation model, all microbubble displacements measured, such as those in Fig. 7(a), were less than the modeled displacement. Without compensating for the nonspecific binding of the microbubble, this model provided a measure of the maximum expected microbubble displacement. Examining the modeled microbubble translation curves and comparing these to the optically observed microbubble translation, we hypothesized that the differences between measured and simulated microbubble displacement were due to the nonspecific binding of microbubbles to the cellulose tubes used to contain the microbubbles. This nonspecific binding in cellulose tubes was observed by others [46]. Reducing the simulated insonation time based on the bound time during the microbubble translation experiments resulted in the mean error between the simulated and experimental results decreasing from 77.2% to 29.8%. A best-fit line through the plots of Figs. 7(b) and 7(c) also improved in correlation, increasing from R2 = 0.10 to R2 = 0.71. The slope of the best-fit line, which should equal unity, increases from m = 0.24 to m = 0.64 when the corrected insonation time was simulated. Streak imaging provided a verification tool for both the functionality of the ARFIVUS and the validity of the 1-D microbubble ARF translation model used. This suggests that center frequencies of microbubble-specific transducers can be designed for similar lipid shelled microbubbles using the 1-D microbubble ARF translation model.
Finally, the flow phantom experiments demonstrated that an ARFIVUS is capable of displacing microbubbles to the wall of a vessel under velocities and dimensions comparable to the human common carotid and coronary arteries. Under the three flow conditions presented, the 15, 13, and 31 dB changes in average video intensity indicated an accumulation of microbubbles resulting from ARF. Velocities comparable to the human common carotid and coronary arteries were used to demonstrate the clinical potential for ARFIVUS catheters to guide molecular-targeted and therapeutic microbubbles.
V. Conclusion
We have designed, fabricated, and tested a prototype acoustic radiation force intravascular ultrasound (ARFIVUS) transducer capable of displacing microbubble contrast agents. This device has the potential to enhance intravascular microbubble-based targeted molecular imaging and therapeutic delivery by increasing microbubble contact and interaction with surfaces and regions of interest. The optimal ultrasonic frequency for microbubble translation—3 MHz—was selected using a 1-D microbubble ARF translation model. Finite element analysis was then used to design the ceramic dimensions to achieve this optimal frequency. The effect of transducer length on microbubble translation in flow was assessed using the 1-D microbubble ARF translation model and FEA-modeled beam profiles. Microbubble translation was monitored with a high-speed streak camera to verify prototype functionality and 1-D microbubble ARF translation model validity. A correction based on nonspecific microbubble adhesion was used to account for differences between experimentally measured and simulated translation, decreasing mean error from 77.2% to 29.8%. Microbubbles were displaced to the wall in a flow phantom using the ARFIVUS transducer, and the change in video intensity caused by the accumulation of microbubbles was measured before, during, and after microbubble infusion. After microbubble infusion, the video intensity in the region of interest was 31 dB higher because of the ARFIVUS transmission.
Acknowledgments
The authors acknowledge the financial support of the National Institutes of Health grant R01HL090700, the University of Virginia Coulter Translational Research Grant, and the National Institute of General Medical Sciences of the National Institutes of Health award T32GM008715.
Biography
 Joseph P. Kilroy earned his B.E. and M.E. degrees in electrical engineering from the Stevens Institute of Technology, Hoboken, NJ, in 2006. He is currently a Ph.D. candidate in biomedical engineering at the University of Virginia in Charlottesville, VA. His research interests include therapeutic IVUS transducer design, the application of microbubbles and ultrasound for imaging and therapy, and ultrasound transducer modeling and design.
 Alexander L. (Sasha) Klibanov received the M.S. degree in chemistry from Moscow State University, Moscow, Russia, in 1979. In 1984, he received the Ph.D. degree in biochemistry from the Cardiology Research Center of the Academy of Medical Sciences, Moscow. He then worked at the Cardiology Research Center Laboratory of Enzyme Engineering as staff scientist until 1991. During that time, he worked as a visiting research scientist at Martin Luther University, Halle, Germany; Massachusetts General Hospital, Boston, MA; and the University of Tennessee, Knoxville, TN. In 1991, he joined the laboratory of drug targeting (Prof. L. Huang) at the University of Pittsburgh, Pittsburgh, PA, as a research associate and later research assistant professor to study targeting of long-circulating liposomes. In 1993, Dr. Klibanov joined the Medical Imaging division of Mallinckrodt Inc. in St. Louis, MO, to work on ultrasound contrast materials and their application for targeted imaging. Since 2001, he has been an associate professor in the Cardiovascular Division of the University of Virginia, Charlottesville, VA.
Dr. Klibanov's research interests include application of chemical techniques to molecular imaging and tissue-specific targeting of therapeutic and diagnostic imaging agents, liposomes, and ultrasound contrast materials.
Brian R. Wamhoff is an Associate Professor at the University of Virginia (UVa) in the Cardiovascular Division of UVa's Department of Medicine, with a joint appointment in Biomedical Engineering. Dr. Wamhoff has expertise in small and large animal models of vascular disease, molecular biology and cell-based systems, and interventional vascular device development. He has obtained funding from the NIH, the pharmaceutical industry, the American Heart Association, and other organizations to study fundamental mechanisms that regulate smooth muscle cell biology vascular disease. Dr. Wamhoff has authored more than 50 peer-reviewed manuscripts, as well as several book chapters and commentaries. Dr. Wamhoff has also received multiple awards for his successes, including the 2004 American Physiological Society Cardiovascular Young Investigator Award; the 2008 Atherosclerosis, Thrombosis, and Vascular Biology (ATVB) Irvine H. Page Award; the 2010 American Physiological Society New Investigator Award for Cardiovascular Research; and the 2011 Rhodes College Distinguished Alumni Award, from his alma mater. Dr. Wamhoff obtained a B.S. degree in biology with a minor in business administration from Rhodes College in 1996 and received his Ph.D. degree in medical physiology from the University of Missouri in 2001.
 John A. Hossack (S'90–M'92–SM'02) received the B.Eng. and Ph.D. degrees from the University of Strathclyde, Glasgow, UK. He is currently a Professor in the Department of Biomedical Engineering and the Department of Electrical and Computer Engineering, University of Virginia, Charlottesville. Previously, he was a postdoctoral researcher in the E. L. Ginzton Laboratory at Stanford University, and then a Design Engineer, and later Technical Fellow, at Acuson Corp in Mountain View, CA. He is the active Vice President, Publications for the Ultrasonics, Ferroelectrics, and Frequency Control Society of IEEE and is an Associate Editor for the IEEE Transactions on Ultrasonics, Ferroelectrics, and Frequency Control. He was Technical Program Chair at the 2005 IEEE Ultrasonics Symposium. His current research interests relate to ultrasonic transducer design (including intravascular devices), mouse heart ultrasound imaging, cardiac ultrasound image quantification, and the use of ultrasound for image guiding and effecting focal drug/gene delivery in the context of management of arterial disease.
Appendix A
1-D Microbubble Translation Equations [43] and Variables
Dayton et al. proposed a 1-D model for the displacement of a microbubble when insonated [43]. Three equations were presented. Variable nomenclature is listed in Table III. A Rayleigh–Plesset equation was derived from work by Morgan et al. [47] and Chomas et al. [48]:
| (1) |
| (2) |
A combination of force terms from previous research was also described to create a balance of drag and driving forces:
| (3a) |
The final term of the force balance equation was the friction due to a microbubble interacting with a wall. This equation takes into account both the buoyancy force of the microbubble and the lift as derived by Krishnan and Leighton [44]. The lift term originally presented in Dayton's dissertation and 2002 paper, however, had a minor typographical error, because it includes a viscosity term not found in the Krishnan equations (3a). The corrected derivation of the lift term assuming that translation is the dominant microbubble motion is presented here:
| (3b) |
TABLE III.
1-D Microbubble Acoustic Radiation Force (ARF) Translation Model Variables and Inputs With sources When Appropriate.
| Symbol | Variable | Value |
|---|---|---|
| A | Microbubble cross-sectional area | Varies |
| b | van der Waals constant | 0.1727 [48] |
| c | Speed of sound in liquid | 1540 m/s |
| ε | Lipid shell thickness | 1 nm [47] |
| g | Gravitational constant | 9.8 m/s2 |
| γ | Polytropic gas exponent | 1.07 [47] |
| P driv | Acoustic driving pressure | Varies |
| P l | Pressure in liquid | Varies |
| P 0 | Hydrostatic pressure | 101 × 103 Pa |
| ρ l | Liquid density | 1000 kg/m3 |
| ρ b | Microbubble shell density | 1150 kg/m3 [49] |
| R | Microbubble radius | Varies |
| Ṙ | Microbubble wall velocity | Varies |
| R̈ | Microbubble wall acceleration | Varies |
| R 0 | Initial microbubble radius | Varies |
| σ | Interfacial tension | 0.051 N/m [50] |
| T | Time | Varies |
| u r | Relative velocity of bubble to liquid | ub – ul |
| u l | Liquid velocity | Varies |
| u b | Bubble velocity | Varies |
| μ | Liquid viscosity | 1 × 10⁻³ Pa-s |
| μ sh | Microbubble shell viscosity | 1.9*R0 – 1.1 [47] |
| μ F | Coefficient of friction | 0.5 [43] |
| ν | Kinematic viscosity of the medium | μ/ρl |
| V b | Microbubble volume | Varies |
| V m | Universal molar volume | 22.4 L |
| χ | Elastic modulus of lipid shell | 0.5 [47] |
Contributor Information
Joseph P. Kilroy, Department of Biomedical Engineering, University of Virginia, Charlottesville, VA
Alexander L. Klibanov, Cardiovascular Division, Department of Medicine, University of Virginia, Charlottesville, VA.
Brian R. Wamhoff, Cardiovascular Division, Department of Medicine, University of Virginia, Charlottesville, VA.
John A. Hossack, Department of Biomedical Engineering, University of Virginia, Charlottesville, VA. (jh7fj@virginia.edu).
References
- 1.Deshpande N, Needles A, Willmann JK. Molecular ultra-sound imaging: Current status and future directions. Clin. Radiol. 2010;65(7):567–581. doi: 10.1016/j.crad.2010.02.013. [DOI] [PMC free article] [PubMed] [Google Scholar]
- 2.Lindner JR, Song J, Christiansen J, Klibanov AL, Xu F, Ley K. Ultrasound assessment of inflammation and renal tissue injury with microbubbles targeted to P-selectin. Circulation. 2001;104(17):2107–2112. doi: 10.1161/hc4201.097061. [DOI] [PubMed] [Google Scholar]
- 3.Leong-Poi H, Christiansen J, Klibanov AL, Kaul S, Lindner JR. Noninvasive assessment of angiogenesis by ultrasound and microbubbles targeted to alpha(v)-integrins. Circulation. 2002 Dec;107(3):455–460. doi: 10.1161/01.cir.0000044916.05919.8b. [DOI] [PubMed] [Google Scholar]
- 4.Pochon S, Tardy I, Bussat P, Bettinger T, Brochot J, von Wronski M, Passantino L, Schneider M. BR55: A lipopeptide-based VEGFR2-targeted ultrasound contrast agent for molecular imaging of angiogenesis. Invest. Radiol. 2010 Feb;45(2):89–95. doi: 10.1097/RLI.0b013e3181c5927c. [DOI] [PubMed] [Google Scholar]
- 5.Klibanov AL, Rychak JJ, Yang WC, Alikhani S, Li B, Acton S, Lindner JR, Ley K, Kaul S. Targeted ultrasound contrast agent for molecular imaging of inflammation in high-shear flow. Contrast Media Mol. Imaging. 2006;1(6):259–266. doi: 10.1002/cmmi.113. [DOI] [PubMed] [Google Scholar]
- 6.Newman CMH, Bettinger T. Gene therapy progress and prospects: Ultrasound for gene transfer. Gene Ther. 2007 Mar;14(6):465–475. doi: 10.1038/sj.gt.3302925. [DOI] [PubMed] [Google Scholar]
- 7.Bekeredjian R, Grayburn PA, Shohet RV. Use of ultra-sound contrast agents for gene or drug delivery in cardiovascular medicine. J. Am. Coll. Cardiol. 2005 Feb;45(3):329–335. doi: 10.1016/j.jacc.2004.08.067. [DOI] [PubMed] [Google Scholar]
- 8.Kinoshita M, McDannold N, Jolesz FA, Hynynen K. Noninvasive localized delivery of Herceptin to the mouse brain by MRI-guided focused ultrasound-induced blood-brain barrier disruption. Proc. Natl. Acad. Sci. USA. 2006 Aug;103(31):11719–11723. doi: 10.1073/pnas.0604318103. [DOI] [PMC free article] [PubMed] [Google Scholar]
- 9.Shohet RV, Chen S, Zhou YT, Wang Z, Meidell RS, Unger RH, Grayburn PA. Echocardiographic destruction of albumin microbubbles directs gene delivery to the myocardium. Circulation. 2000 Apr;101(22):2554–2556. doi: 10.1161/01.cir.101.22.2554. [DOI] [PubMed] [Google Scholar]
- 10.Chen S, Ding J, Bekeredjian R, Yang B, Shohet RV, Johnston SA, Hohmeier HE, Newgard CB, Grayburn PA. Efficient gene delivery to pancreatic islets with ultrasonic microbubble destruction technology. Proc. Natl. Acad. Sci. USA. 2006 May;103(22):8469–8474. doi: 10.1073/pnas.0602921103. [DOI] [PMC free article] [PubMed] [Google Scholar]
- 11.Klibanov AL. Microbubble contrast agents: targeted ultrasound imaging and ultrasound-assisted drug-delivery applications. Invest. Radiol. 2006 Mar;41(3):354–362. doi: 10.1097/01.rli.0000199292.88189.0f. [DOI] [PubMed] [Google Scholar]
- 12.Kim HJ, Greenleaf JF, Kinnick RR, Bronk JT, Bolander ME. Ultrasound-mediated transfection of mammalian cells. Hum. Gene Ther. 1996;7(11):1339–1346. doi: 10.1089/hum.1996.7.11-1339. [DOI] [PubMed] [Google Scholar]
- 13.Bao S, Thrall BD, Miller DL. Transfection of a reporter plasmid into cultured cells by sonoporation in vitro. Ultrasound Med. Biol. 1997;23(6):953–959. doi: 10.1016/s0301-5629(97)00025-2. [DOI] [PubMed] [Google Scholar]
- 14.Unger EC, McCreery T, Sweitzer R, Vielhauer G, Wu G, Shen D, Yellowhair D. MRX 501: A novel ultrasound contrast agent with therapeutic properties. Acad. Radiol. 1998 Apr;5(suppl. 1):S247–S249. doi: 10.1016/s1076-6332(98)80119-0. [DOI] [PubMed] [Google Scholar]
- 15.Phillips LC, Klibanov AL, Wamhoff BR, Hos-sack JA. Localized ultrasound enhances delivery of rapamycin from microbubbles to prevent smooth muscle proliferation. J. Control. Release. 2011 Aug;154(1):42–49. doi: 10.1016/j.jconrel.2011.04.020. [DOI] [PMC free article] [PubMed] [Google Scholar]
- 16.Unger EC, McCreery TP, Sweitzer RH, Caldwell VE, Wu Y. Acoustically active lipospheres containing paclitaxel: A new therapeutic ultrasound contrast agent. Invest. Radiol. 1998 Dec;33(12):886–892. doi: 10.1097/00004424-199812000-00007. [DOI] [PubMed] [Google Scholar]
- 17.Tartis MS, McCallan J, Lum AFH, LaBell R, Stieger SM, Matsunaga TO, Ferrara KW. Therapeutic effects of paclitaxel-containing ultrasound contrast agents. Ultrasound Med. Biol. 2006 Nov;32(11):1771–1780. doi: 10.1016/j.ultrasmedbio.2006.03.017. [DOI] [PubMed] [Google Scholar]
- 18.Christiansen JP, French BA, Klibanov AL, Kaul S, Lindner JR. Targeted tissue transfection with ultrasound destruction of plasmid-bearing cationic microbubbles. Ultrasound Med. Biol. 2003 Dec;29(12):1759–1767. doi: 10.1016/s0301-5629(03)00976-1. [DOI] [PubMed] [Google Scholar]
- 19.Lewis CW, McConaughy J, Rinkevich D, Klibanov AL, Lindner JR. Development of a novel microbubble agent for ultra-sound-mediated targeted drug delivery. Circulation. 2004;110(5):511. [Google Scholar]
- 20.Kheirolomoom A, Dayton PA, Lum AFH, Little E, Paoli EE, Zheng H, Ferrara KW. Acoustically-active microbubbles conjugated to liposomes: Characterization of a proposed drug delivery vehicle. J. Control. Release. 2007 Apr;118(3):275–284. doi: 10.1016/j.jconrel.2006.12.015. [DOI] [PMC free article] [PubMed] [Google Scholar]
- 21.Klibanov AL, Shevchenko TI, Raju BI, Seip R, Chin CT. Ultrasound-triggered release of materials entrapped in microbubble-liposome constructs: A tool for targeted drug delivery. J. Control. Release. 2010 Nov;148(1):13–17. doi: 10.1016/j.jconrel.2010.07.115. [DOI] [PMC free article] [PubMed] [Google Scholar]
- 22.Wu Y, Unger EC, McCreery TP, Sweitzer RH, Shen D, Wu G, Vielhauer MD. Binding and lysing of blood clots using MRX-408. Invest. Radiol. 1998 Dec;33(12):880–885. doi: 10.1097/00004424-199812000-00006. [DOI] [PubMed] [Google Scholar]
- 23.Greenleaf WJ, Bolander ME, Sarkar G, Goldring MB, Greenleaf JF. Artificial cavitation nuclei significantly enhance acoustically induced cell transfection. Ultrasound Med. Biol. 1998;24(4):587–595. doi: 10.1016/s0301-5629(98)00003-9. [DOI] [PubMed] [Google Scholar]
- 24.Karshafian R, Bevan PD, Williams R, Samac S, Burns PN. Sonoporation by ultrasound-activated microbubble contrast agents: effect of acoustic exposure parameters on cell membrane permeability and cell viability. Ultrasound Med. Biol. 2009 May;35(5):847–860. doi: 10.1016/j.ultrasmedbio.2008.10.013. [DOI] [PubMed] [Google Scholar]
- 25.Lai C-Y, Wu C-H, Chen C-C, Li P-C. Quantitative relations of acoustic inertial cavitation with sonoporation and cell viability. Ultrasound Med. Biol. 2006 Dec;32(12):1931–1941. doi: 10.1016/j.ultrasmedbio.2006.06.020. [DOI] [PubMed] [Google Scholar]
- 26.Takalkar AM, Klibanov AL, Rychak JJ, Lindner JR, Ley K. Binding and detachment dynamics of microbubbles targeted to P-selectin under controlled shear flow. J. Control. Release. 2004;96(3):473–482. doi: 10.1016/j.jconrel.2004.03.002. [DOI] [PubMed] [Google Scholar]
- 27.Patil AV, Rychak JJ, Allen JS, Klibanov AL, Hossack JA. Dual frequency method for simultaneous translation and real-time imaging of ultrasound contrast agents within large blood vessels. Ultrasound Med. Biol. 2009 Dec;35(12):2021–2030. doi: 10.1016/j.ultrasmedbio.2009.07.003. [DOI] [PMC free article] [PubMed] [Google Scholar]
- 28.Dayton P, Klibanov A, Brandenburger G, Ferrara K. Acoustic radiation force in vivo: A mechanism to assist targeting of micro-bubbles. Ultrasound Med. Biol. 1999;25(8):1195–1201. doi: 10.1016/s0301-5629(99)00062-9. [DOI] [PubMed] [Google Scholar]
- 29.Patil AV, Rychak JJ, Klibanov AL, Hossack JA. Real-time technique for improving molecular imaging and guiding drug delivery in large blood vessels: In vitro and ex vivo results. Mol. Imaging. 2011 Aug;10(4):238–247. doi: 10.2310/7290.2011.00002. [DOI] [PMC free article] [PubMed] [Google Scholar]
- 30.Rychak JJ, Lindner JR, Ley K, Klibanov AL. Deformable gas-filled microbubbles targeted to P-selectin. J. Control. Release. 2006 Sep;114(3):288–299. doi: 10.1016/j.jconrel.2006.06.008. [DOI] [PubMed] [Google Scholar]
- 31.Kruse DE, Ferrara KW. A new imaging strategy using wideband transient response of ultrasound contrast agents. IEEE Trans. Ultrason. Ferroelectr. Freq. Control. 2005 Aug;52(8):1320–1329. doi: 10.1109/tuffc.2005.1509790. [DOI] [PMC free article] [PubMed] [Google Scholar]
- 32.Hu X, Zheng H, Kruse DE, Sutcliffe P, Stephens DN, Ferrara KW. A sensitive TLRH targeted imaging technique for ultrasonic molecular imaging. IEEE Trans. Ultrason. Ferroelectr. Freq. Control. 2010 Jan;57(2):305–316. doi: 10.1109/TUFFC.2010.1411. [DOI] [PMC free article] [PubMed] [Google Scholar]
- 33.Gessner R, Lukacs M, Lee M, Cherin E, Foster FS, Dayton PA. High-resolution, high-contrast ultrasound imaging using a prototype dual-frequency transducer: In vitro and in vivo studies. IEEE Trans. Ultrason. Ferroelectr. Freq. Control. 2010 Aug;57(8):1772–1781. doi: 10.1109/TUFFC.2010.1615. [DOI] [PMC free article] [PubMed] [Google Scholar]
- 34.Uren NG, Yock PG, Fitzgerald PJ. Prognostic implications of intravascular ultrasound imaging after coronary intervention. In: Siegel RJ, editor. Intravascular Ultrasound Imaging in Coronary Artery Disease. 1st ed. Marcel Dekker; New York, NY: 1998. pp. 39–57. [Google Scholar]
- 35.Nissen SE, Yock P. Intravascular ultrasound: Novel patho-physiological insights and current clinical applications. Circulation. 2001;103(4):604–616. doi: 10.1161/01.cir.103.4.604. [DOI] [PubMed] [Google Scholar]
- 36.Phillips LC, Klibanov AL, Bowles DK, Ragosta M, Hos-sack JA, Wamhoff BR. Focused in vivo delivery of plasmid DNA to the porcine vascular wall via intravascular ultrasound destruction of microbubbles. J. Vasc. Res. 2010 Nov;47(3):270–274. doi: 10.1159/000258905. [DOI] [PMC free article] [PubMed] [Google Scholar]
- 37.Herickhoff CD, Wilson CM, Grant GA, Britz GW, Light ED, Palmeri ML, Wolf PD, Smith SW. Dual-mode IVUS transducer for image-guided brain therapy: Preliminary experiments. Ultrasound Med. Biol. 2011 Oct;37(10):1667–1676. doi: 10.1016/j.ultrasmedbio.2011.06.017. [DOI] [PMC free article] [PubMed] [Google Scholar]
- 38.Frijlink ME, Goertz DE, Vos HJ, Tesselaar E, Blacquière G, Gisolf A, Krams R, van der Steen AFW. Harmonic intravascular ultrasound imaging with a dual-frequency catheter. Ultra-sound Med. Biol. 2006 Nov;32(11):1649–1654. doi: 10.1016/j.ultrasmedbio.2006.05.024. [DOI] [PubMed] [Google Scholar]
- 39.Goertz DE, Frijlink ME, Tempel D, van Damme LCA, Krams R, Schaar JA, ten Cate FJ, Serruys PW, de Jong N, van der Steen AFW. Contrast harmonic intravascular ultrasound: A feasibility study for vasa vasorum imaging. Invest. Radiol. 2006 Aug;41(8):631–638. doi: 10.1097/01.rli.0000229773.11715.da. [DOI] [PubMed] [Google Scholar]
- 40.Holdsworth DW, Norley CJD, Frayne R, Steinman DA, Rutt BK. Characterization of common carotid artery blood-flow waveforms in normal human subjects. Physiol. Meas. 1999;20(3):219–240. doi: 10.1088/0967-3334/20/3/301. [DOI] [PubMed] [Google Scholar]
- 41.Hozumi T, Yoshida K, Akasaka T, Asami Y, Ogata Y, Takagi T, Kaji S, Kawamoto T, Ueda Y, Morioka S. Noninvasive assessment of coronary flow velocity and coronary flow velocity reserve in the left anterior descending coronary artery by Doppler echo-cardiography: Comparison with invasive technique. J. Am. Coll. Cardiol. 1998 Nov;32(5):1251–1259. doi: 10.1016/s0735-1097(98)00389-1. [DOI] [PubMed] [Google Scholar]
- 42.Davis CP, Liu P-F, Hauser M, Göhde SC, Von Schulthess GK, Debatin JF. Coronary flow and coronary flow reserve measurements in humans with breath-held magnetic resonance phase contrast velocity mapping. Magn. Reson. Med. 1997 Apr;37(4):537–544. doi: 10.1002/mrm.1910370410. [DOI] [PubMed] [Google Scholar]
- 43.Dayton PA, Allen JS, Ferrara KW. The magnitude of radiation force on ultrasound contrast agents. J. Acoust. Soc. Am. 2002;112(5, pt. 1):2183–2192. doi: 10.1121/1.1509428. [DOI] [PubMed] [Google Scholar]
- 44.Krishnan GP, Leighton DT. Inertial lift on a moving sphere in contact with a plane wall in a shear flow. Phys. Fluids. 1995;7(11):2538–2545. [Google Scholar]
- 45.Onda Corp. Acoustic properties of solids. 2012 Mar. [Online]. Available: http://www.ondacorp.com/images/Solids.pdf.
- 46.Lum AFH, Borden MA, Dayton PA, Kruse DE, Simon SI, Ferrara KW. Ultrasound radiation force enables targeted deposition of model drug carriers loaded on microbubbles. J. Control. Release. 2006;111(1–2):128–134. doi: 10.1016/j.jconrel.2005.11.006. [DOI] [PMC free article] [PubMed] [Google Scholar]
- 47.Morgan KE, Allen JS, Dayton PA, Chomas JE, Klibanov AL, Ferrara KW. Experimental and theoretical evaluation of ultrasonic contrast agent behavior. IEEE Trans. Ultrason. Ferroelectr. Freq. Control. 2001;47(6):1494–1509. doi: 10.1109/58.883539. [DOI] [PubMed] [Google Scholar]
- 48.Chomas JE, Dayton PA, May D, Allen JS, Klibanov AL, Ferrara KW. Optical observation of contrast agent destruction. Appl. Phys. Lett. 2000;77(7):1056–1058. [Google Scholar]
- 49.Zheng H, Mukdadi O, Shandas R. Theoretical predictions of harmonic generation from submicron ultrasound contrast agents for nonlinear biomedical ultrasound imaging. Phys. Med. Biol. 2006 Feb;51(3):557–573. doi: 10.1088/0031-9155/51/3/006. [DOI] [PubMed] [Google Scholar]
- 50.Dayton PA. Ph.D. dissertation. Dept. Electrical & Electronic Engineering, University of Virginia; Charlottesville, VA: 2001. The effects of acoustic radiation force on contrast agents: Experimental and theoretical analysis. [Google Scholar]


