Abstract
Ketopantoate reductase (KPR) catalyzes the NADPH-dependent production of pantoate, an essential precursor in the biosynthesis of coenzyme A. Previous structural studies have been limited to Escherichia coli KPR, a monomeric enzyme that follows a sequential ordered mechanism. Here we report the crystal structure of the Staphylococcus aureus enzyme at 1.8 Å resolution, the first description of a dimeric KPR. Using sedimentation velocity analysis, we show that the S. aureus KPR dimer is stable in solution. In fact, our structural analysis shows that the dimeric assembly we identify is present in the majority of KPR crystal structures. Steady state analysis of S. aureus KPR reveals strong positive cooperativity with respect to NADPH (Hill coefficient of 2.5). In contrast, high concentrations of the substrate ketopantoate (KP) inhibit the activity of the enzyme. These observations are consistent with a random addition mechanism in which the initial binding of NADPH is the kinetically preferred path. In fact, Förster resonance energy transfer studies of the equilibrium binding of NADPH show only a small degree of cooperativity between subunits (Hill coefficient of 1.3). Thus, the apparently strong cooperativity observed in substrate saturation curves is due to a kinetic process that favors NADPH binding first. This interpretation is consistent with our analysis of the A181L substitution, which increases the Km of ketopantoate 844-fold, without affecting kcat. The crystal structure of KPRA181L shows that the substitution displaces Ser239, which is known to be important for the binding affinity of KP. The decrease in KP affinity would enhance the already kinetically preferred NADPH binding path, making the random mechanism appear to be sequentially ordered and reducing the kinetic cooperativity. Consistent with this interpretation, the NADPH saturation curve for KPRA181L is hyperbolic.
Pantothenic acid (vitamin B5) is the substrate for the biosynthesis of coenzyme A, an essential cofactor in energy metabolism.1 Because mammals obtain vitamin B5 from their diet, the biosynthesis of pantothenic acid in pathogenic bacteria has been identified as a drug target.2–4 Ketopantoate reductase (KPR) catalyzes the NADPH-dependent reduction of ketopantoate (KP) to pantoate, the essential precursor of pantothenic acid (Figure 1).1,5 Previous structural and kinetic studies have focused on Escherichia coli KPR, a monomeric enzyme with globular N- and C-terminal domains.6–9 The N-terminal domain of E. coli KPR contains a Rossmann fold for binding NADPH. KP binds in the active site that is formed in the interface between the domains. The catalytic reaction follows a sequential ordered bi-bi kinetic mechanism in which the enzyme binds NADPH first, followed by KP for the hydride transfer.5,6
Figure 1.
KPR catalyzes the NADPH-dependent reduction of ketopantoate to (R)-pantoate.
Here we report the structural and kinetic analysis of KPR from Staphylococcus aureus, an important human pathogen.10 Unlike the E. coli enzyme, S. aureus KPR forms a stable, dimeric complex that is highly conserved among several deeply divergent KPRs. Steady state analysis of the S. aureus enzyme also displays positive cooperativity with respect to the cofactor. We present evidence that the cooperativity is best explained by a random addition mechanism with a kinetically preferred path. Thus, the mechanism of S. aureus KPR is distinct from those of previously described members of the family of 2-hydroxyacid dehydrogenases.
MATERIALS AND METHODS
Protein Purification and Expression
A pSGX3 expression vector containing the full-length gene for S. aureus KPR (residues 1–286) linked to a short C-terminal 6xHis tag (residues 287–294; sequence, EGHHHHHH) was obtained from the DNASU Plasmid Repository at Arizona State University (Tempe, AZ). BL21 (DE3)-T1R cells containing the plasmid were grown at 37 °C in the presence of kanamycin to an OD600 of 1.0–1.3 and then induced for 18 h at 20 °C using 0.42 mM isopropyl β-d-thiogalactopyranoside. Cells were sonicated in 100 mL of 50 mM phosphate (pH 7.8) and 300 mM NaCl. KPR was purified using TALON affinity resin, dialyzed into 50 mM NaCl and 25 mM Tris (pH 8.0), and concentrated to 13 mg/mL. The A181L construct (KPRA181L) was generated by Norclone (London, ON) and expressed and purified using the same procedure described above.
Enzyme Assays
NADPH and ketopantoate (KP) were obtained from Sigma. All steady state experiments were conducted in a reaction buffer containing 100 mM HEPES (pH 7.5), 50 mM NaCl, and either 12 nM KPR or 19 nM KPRA181L. The enzyme and its substrates were separately incubated for 5 min at 25 °C and then rapidly manually mixed together. The saturating concentrations of substrate were 50 μM NADPH and 100 μM ketopantoate (40 mM for KPRA181L). An Agilent 8453 UV–vis spectrometer equipped with a Peltier temperature controller was used to follow enzyme reactions by monitoring the loss of NADPH at 340 nm (molar absorptivity coefficient of 6220 M−1 cm−1). Initial time points were analyzed to obtain steady state velocities. Data were fit using nonlinear regression in PRISM (GraphPad Software Inc., San Diego, CA). The substrate saturation curves were fit to either a hyperbolic or sigmoidal model based on residual analysis (for hyperbolic kinetics, h = 1):
| (1) |
The ketopantoate substrate curves of KPR revealed substrate inhibition and were fit to
| (2) |
Equilibrium Binding Assays
The binding of NADPH quenches the intrinsic protein fluorescence of KPR. In addition, the 336 nm fluorescence emission of Trp167 excites the bound NADPH (distance of ~16.7 Å), resulting in a second emission at 457 nm (see Results). The Förster resonance energy transfer (FRET) from a protein tryptophan to NADPH can be used to study the equilibrium binding of cofactor.11 Fluorescence binding titrations were conducted at 25 °C in reaction buffer [100 mM HEPES (pH 7.5) and 50 mM NaCl] containing 300 nM KPR using a PerkinElmer LS55 luminescence spectrometer. Intrinsic protein fluorescence was measured with excitation and emission wavelengths of 285 and 336 nm, respectively, and slit widths were set to 9.0 nm for the 300 nM KPR titration. For FRET analysis, the excitation and emission wavelengths were 285 and 457 nm, respectively, and both slit widths were set to 9.0 nm. Raw data were corrected for the inner filter effect12 using the molar absorptivity of NADPH at 285 nm (2235 M−1 cm−1) and 336 nm (6220 M−1 cm−1). No inner filter correction was applied at 457 nm because, at the NADPH concentrations assayed, there was no significant absorbance at the emission wavelength. Because KPR has a high affinity for NADPH, the enzyme-bound fraction (KPRbound) was significant at low cofactor concentrations (<3 μM). Thus, we used the following relationship to calculate free cofactor (NADPHfree):
| (3) |
| (4) |
| (5) |
Binding data were analyzed by plotting ΔF versus the free NADPH concentrations. The dissociation constants (Kd) and cooperativity were determined by fitting the data to a sigmoidal model based on residual analysis:
| (6) |
A model-independent binding isotherm was constructed on the basis of the theory and techniques described by others.13–15 Briefly, intrinsic protein fluorescence titration data were collected at 300 nM KPR and 3000 nM KPR with the slit widths set to 9.0 and 3.2 nm, respectively. The relative quenching (Q) for each titration point was calculated using the following equation:
| (7) |
where Fi is the fluorescence at an NADPH concentration of i and F0 is the fluorescence with no cofactor. The data from both the 300 and 3000 nM KPR titrations were fit using global analysis in PRISM to a sigmoidal model:
| (8) |
Using the fit models, the concentrations of NADPH (j) that produced an equivalent quenching in both titrations were used to calculated the total degree of binding (∑Θi):
| (9) |
where subscripts 1 and 2 refer to the relevant concentrations of the 3000 and 300 nM KPR titrations, respectively. The concentration of the free cofactor was calculated:
| (10) |
Finally, the dependence of the quenching on the free cofactor concentration were then fit to a sigmoidal model:
| (11) |
Analytical Ultracentrifugation (AUC)
Sedimentation velocity studies were conducted using an Optima XLA analytical ultracentrifuge (Beckman Coulter). For the sample collected, 6 μM KPR was dialyzed into a buffer consisting of 25 mM Tris (pH 8.0) and 175 mM NaCl. Assays were performed in the absence of ligand. Samples were loaded into cells with 12 mm centerpieces and equilibrated for roughly 3 h at 20 °C. Cells were loaded into an An60 Ti rotor and run at 45000 rpm. Data were collected at a wavelength of 280 nm using a radial step size of 0.003 cm. The partial specific volume of 0.740 mL/ g was calculated from the amino acid sequence. The buffer density of 1.006 g/mL and a viscosity of 1.019 P were calculated using SEDENTERP.16 All data were analyzed using SEDFIT.17 Continuous sedimentation coefficient distribution c(s) analyses were restrained by a maximum entropy regularization at a P = 0.68 confidence interval. The meniscus, frictional ratio coefficient, baseline, and systematic-time variant and radial-invariant noise were all fitted. The root-mean-square deviation (rmsd) for the analysis was ≤0.005 OD. The theoretical sedimentation coefficient for the KPR dimer was calculated using the atomic coordinates of the KPR crystal structure (see Results) with HYDROPRO.18
Crystallization, Data Collection, and Structure Determination
KPR containing the C-terminal His tag was crystallized at 20 °C by sitting drop vapor diffusion with 1 μL of 10 mg/mL protein [4 mM KP, 4 mM NADP+, 50 mM NaCl, and 25 mM Tris (pH 8.0)] mixed with 1 μL of the reservoir solution [300 mM magnesium acetate, 100 mM MES buffer (pH 6.6), and 15% polyethylene glycol 3350]. KPR crystals appeared in 2–3 days and were soaked in 6% DMSO, 6% glycerol, 6% ethylene glycol, 4 mM KP, 4 mM NADP+, 300 mM magnesium acetate, 100 mM MES buffer (pH 6.6), and 15% PEG 3350 solutions prior to being plunged into liquid nitrogen. For KPRA181L crystallization, 1 μL of 10 mg/mL protein [4 mM NADP+, 50 mM NaCl, and 25 mM Tris (pH 8.0)] was mixed with 1 μL of the reservoir solution [6% tacsimate, 100 mM MES buffer (pH 6), and 15% PEG 3350]. Crystals appeared in 2–3 days and were nonisomorphous with the KPR crystals. KPRA181L crystals were soaked in 25% glycerol, 4 mM NADP+, 6% tacsimate, 100 mM MES buffer (pH 6), and 15% PEG 3350 and then plunged into liquid nitrogen for data collection. Data were collected (360° at an oscillation of 1° and 1 s exposure) on the SER-CAT 22BM beamline at the Advanced Photon Source (Argonne, IL) at a wavelength of 1 Å using a MAR300 CCD detector. Data were processed with XDS, and 5% of the data were set aside for cross validation (Table 1).19 To estimate the accuracy of the data, we used the CC1/2 indicator developed by Karplus and Diedrichs.20 CC1/2 values of ≥0.5 have been shown to accurately predict usable data below an ⟨I/σ⟩ of 2.0 and with an Rmeas of >300.20,21 The CC1/2 value for KPR shows that we have usable data to 1.81 Å resolution, but we also report statistics to 1.88 Å resolution (⟨I/σ⟩ of 2) for comparison to structures refined with previous standards. For the refinement of KPRA181L, data to 2.62 Å resolution were used (Table 1).
Table 1.
Data Collection and Refinement Statistics
| KPR | KPRA181L | |
|---|---|---|
| Data Collection | ||
| PDB entry | 4YCA | 4S3M |
| space group | P212121 | I121 |
| unit cell dimensions [a, b, c (Å); α, β, γ (deg)] | 42.2, 85.2, 177.1, 90.0, 90.0, 90.0 | 123.0, 66.8, 88.7, 90.0, 112.0, 90.0 |
| resolution (Å) | 1.81 (1.87–1.84)a [1.84–1.81]b | 2.62 (2.82–2.72) [2.72–2.60] |
| completeness (%) | 99.9 (100) [99.6] | 99.2 (99.8) [94.4] |
| redundancy | 13.8 (12.6) [6.6] | 10.6 (3.4) [11.3] |
| no. of reflections | 820276 | 214018 |
| I/σ(I) | 24.84 (2.19) [1.34] | 12.88 (2.80) [1.12] |
| CC1/2c | 0.999 (0.73) [0.53] | 0.997 (0.89) [0.48] |
| Rmeasd (%) | 10.8 (136.2) [150.2] | 15.8 (102.0) [124.1] |
| Refinement | ||
| Rwork/Rfree | 0.173/0.211 | 0.222/0.268 |
| Rfree in the highest-resolution shell | 0.361e | 0.379e |
| no. of proteinf/water atoms | 4740/411 | 4289/42 |
| B factor (Å2) for proteinf/water | 29.4/39.2 | 62.3/47.4 |
| Stereochemical Ideality | ||
| bond lengths (Å2) | 0.008 | 0.002 |
| bond angles (deg) | 1.07 | 0.665 |
| φ, ψ preferred region (%) | 95.60 | 94.79 |
| φ, ψ additionally allowed (%) | 4.03 | 4.83 |
| φ, ψ disallowed region (%) | 0.37g | 0.39g |
Values in parentheses are for the highest-resolution shell based on an I/σ cutoff of 2.
Values in brackets are for the highest-resolution shell used in refinement based on the CC1/2 cutoff (see Materials and Methods).
CC1/2 is the percentage of correlation between intensities from random half- data sets.20
Rmeas is the redundancy-independent merging R factor.44
Highest-resolution shells for refinement were 1.80–1.84 Å for KPR and 2.60–2.66 Å for KPRA181L.
Protein including the NADPH cofactor.
See the text for a description of the Ramachandran outlier.
The structure of the ternary KPR complex was determined using the crystal structure of S. aureus apo-KPR as a search model (PDB entry 3G17) using the program Phaser.22 The resulting model was subjected to rigid-body refinement using PHENIX,23 followed by iterative cycles of automated positional refinement and manual rebuilding using the programs PHENIX23 and Coot,24 respectively. The structure of KPRA181L was determined and refined using a similar strategy, except that the program MOLREP25 was used for molecular replacement searches. Final refinement and model statistics are listed in Table 1. Asp131 was identified as a Ramachandran outlier, on the basis of analysis of the electron density and hydrogen bonding environment (see Results). The dimer interface was analyzed using the Protein interfaces, surfaces and assemblies (PISA)26 software. Hinge-bending domain motion was analyzed using DynDom.27
RESULTS
Crystal Structure of S. aureus KPR
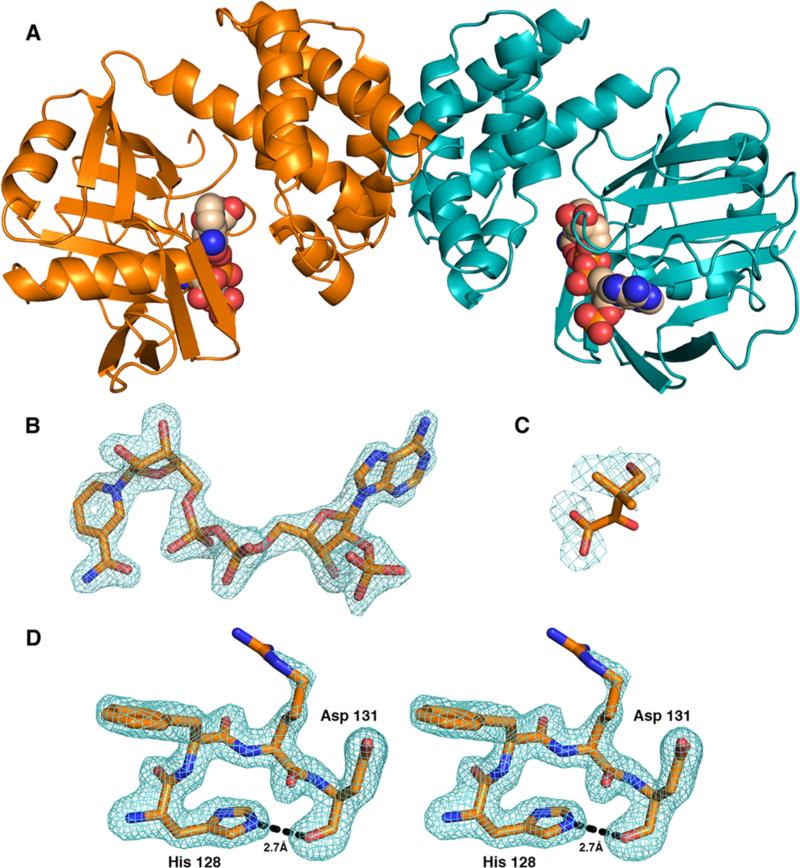
S. aureus KPR was crystallized with NADP+ and ketopantoate (KP) and its structure determined using data to 1.81 Å resolution (see Materials and Methods and Table 1). The asymmetric unit of the crystal contains two molecules related by a 2-fold symmetry axis (Figure 2A). Each chain of KPR consists of an N-terminal domain (residues 1–164), a C-terminal domain (residues 165–286), and a short C-terminal linker containing a 6xHis tag (residues 287–294). The first two residues of both chains are disordered, as are the C-terminal histidines (residues 289–294). In addition, loop residues 100 and 101 (Loop100–101) are disordered in chain A but are ordered in chain B. Loop100–101 is located near the interface between the N- and C-terminal domains and is not involved in any crystal contacts. Both molecules of KPR also contain well-ordered electron density for the NADP+ cofactor (Figure 2B). The cofactor binding site interactions are conserved in E. coli KPR (PDB entry 2OFP), which has been described in detail elsewhere.7,8 In contrast, the electron density in the substrate binding sites of S. aureus KPR is consistent with a disordered molecule of KP (Figure 2C). Because of the disorder, we did not model KP in the crystal structure, but we base our interpretation of the electron density on the location of KP in the crystal structure of the E. coli KPR ternary complex7 (superposition described in a later section) (Figure 2C).
Figure 2.
Crystal structure of S. aureus KPR. (A) Cartoon representation of the S. aureus KPR dimer with NADPH (spheres). (B) Difference density map (Fo – Fc) for NADPH calculated at 1.81 Å and contoured at 3σ. The map was calculated after omitting the ligands and subjecting the model to simulated annealing. (C) Difference density map (Fo – Fc) of the active site calculated at 1.81 Å and contoured at 3σ. Superimposing the E. coli ternary KPR structure (PDB entry 2OFP) shows that the electron density is consistent with a disordered KP. Because of the disorder, KP was not included in the final model. (D) Difference density map (Fo – Fc) of residues 128–131 calculated at 1.81 Å and contoured at 3σ, depicting the hydrogen bond (dashed line) between His128 and Asp131. The map was calculated after omitting residues 128–131 and subjecting the model to simulated annealing.
The Ramachandran plot of S. aureus KPR shows that Asp131 is located in a disallowed region according to Procheck28 (φ,ψ = 78°,149° and 78°,152° for chains A and B, respectively). The electron density shows that Asp131 and the adjacent residues are well-ordered, supporting our modeling of the Ramachandran outlier (Figure 2D). The potential steric clash is offset by strain in the Asp131 N–Cα–C bond angle (114° and 112.4° for chains A and B, respectively). Analysis of the conformation shows that the main chain carbonyl oxygen of Asp131 accepts a hydrogen bond from the Nε atom of the His128 imidazole (Figure 2D). His128 is buried from solvent and donates a second hydrogen bond from the Nδ atom of the imidazole to the main chain carbonyl oxygen of Thr42 (not shown), indicating that His128 is positively charged. It is likely that this hydrogen bond stabilizes the strained conformation of the Asp131 main chain. Similar behavior has been observed in high-resolution (≤1.75 Å) crystal structures;29 the Asp side chain can adopt a rotameric state that allows formation of an intradipeptide hydrogen bond with the main chain carbonyl oxygen, and this interaction can offset the bond angle strain necessary to adopt φ torsion angles near 60°.
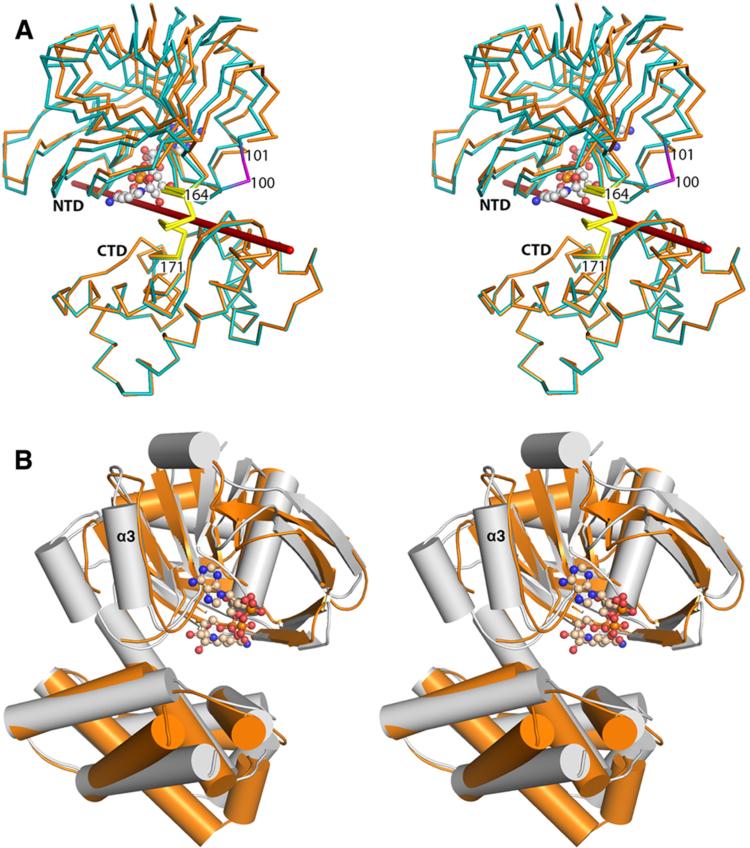
A structural comparison of chains A and B shows that the N- and C-terminal domains have rotated by 6.1° about a hinge axis located between residues 164 and 171 (Figure 3A). Given the proximity of Loop100–101 to the domain interface, it is likely that the disorder observed in chain A is related to the domain rotation (Figure 3A). A similar hinge bending motion has been described in the homologous E. coli KPR structure.7 Despite a low sequence identity of 20%, the S. aureus and E. coli KPR structures (PDB entry 2OFP7) superimpose 293 Cα atoms with an rmsd of 2.1 Å (Figure 3B). The most significant structural difference involves helix α3 in E. coli KPR. The equivalent peptide segment (residues 74–85) in S. aureus KPR contains Pro80 and forms a loop (Loop74–85) instead of a continuous α helix. Although residues 74–79 and 80–85 of Loop74–85 adopt main chain conformations that are approximately helical, the structures do not satisfy the strict hydrogen bonding of an α helix.30 Because there have been several detailed structural studies of E. coli KPR,6–9 we will limit our analysis to those details specific to the S. aureus enzyme.
Figure 3.
S. aureus and E. coli KPRs are conserved. (A) Stereoview of the superposition of S. aureus KPR chains A and B (orange and teal, respectively) showing that the N-terminal domain (NTD) and C-terminal domain (CTD) of KPR undergo hinge bending of 6.1° at residues 164–171 (yellow) similar to that reported in E. coli KPR. The rotational axis is colored red. Residues 100 and 101 (magenta) are disordered in chain A, and NADPH (ball and stick) is depicted. Hinge bending was analyzed using DynDom.45 (B) Stereoview of S. aureus KPR (orange) superimposed onto the E. coli structure (gray). Helix α3 of E. coli KPR is replaced with a loop in S. aureus KPR.
The S. aureus Enzyme Represents a Family of KPR Dimers
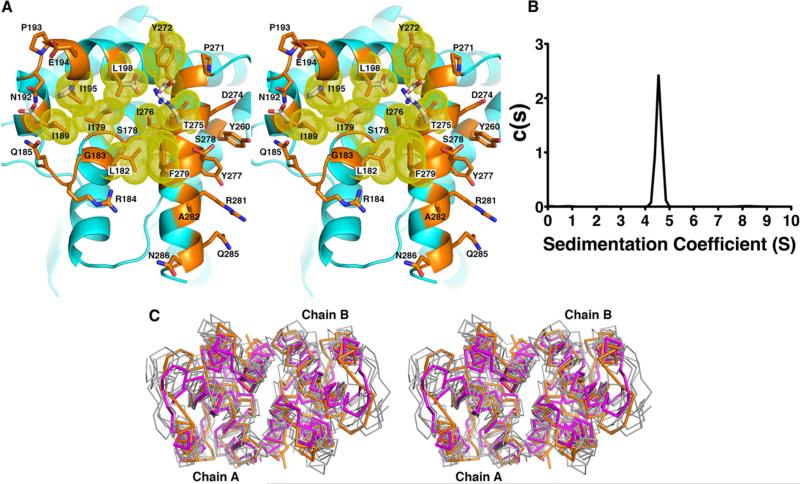
The two molecules of S. aureus KPR are arranged as a dimer in the asymmetric unit (Figure 2A). The interface between the molecules buries 961 Å2 of surface area per monomer and includes 28 residues from each chain (Figure 4A and Table 2). PISA26 analysis of the dimer interface predicts a favorable solvation free energy gain (ΔiG = −12.2 kcal mol−1) and a P value of 0.055; P values of <0.5 indicate a strong likelihood that the surface is interaction-specific. We used sedimentation velocity analysis to examine the structure of S. aureus KPR in solution (Figure 4B). The sedimentation of 6 μM KPR reveals a single species at 4.5 S, which is consistent with the predicted value of 4.4 S for the KPR dimer based on the hydrodynamic analysis of the KPR crystal structure with the program HYDROPRO.18
Figure 4.
KPR dimer interface. (A) The dimer interface is composed of a hydrophobic pocket. Residues within the pocket are colored orange with yellow van der Waals radii and are listed in Table 2. White side chains are polar residues found in the E. coli KPR. (B) Analytical ultracentrifugation experiments showed only one species of KPR in solution at 4.5 S, corresponding to the dimer as predicted by HYDROPRO.18 (C) Stereoview of the superposition of the Cα traces of the C-terminal domains of six homologous (unpublished) KPR dimers (gray) onto S. aureus KPR (orange). The related enzyme, d-mandelate dehydrogenase of Enterococcus faecium31 (magenta), is also shown. Enzymes are from Ralstonia eutropha (PDB entry 3HWR, 20% sequence identity), Ralstonia solanacearum (PDB entry 3GHY, 21% sequence identity), Mycobacterium tuberculosis (PDB entry 4OL9, 31% sequence identity), Enterococcus faecalis (PDB entry 2EW2, 20% sequence identity), Methylococcus capsulatus (PDB entry 3I83, 20% sequence identity), Bacillus subtilis (PDB entry 3EGO, 25% sequence identity), and Ent. faecium (PDB entry 3WFJ, 21% sequence identity).
Table 2.
Interface Residues
| electrostatic interactions between chainsa | |||
| Glu194 (Oε2) ↔ Arg281 (Nε) | |||
| Glu194 (O) ↔ Ser278 (Oγ) | |||
| buried residuesa | |||
| Ser178 | Asn192 | Pro271 | Phe279 |
| Ile179 | Pro193 | Tyr272 | Arg281 |
| Leu182 | Glu194 | Asp274 | Ala282 |
| Gly183 | Ile195 | Thr275 | Gln285 |
| Arg184 | Leu198 | Ile276 | Asn286 |
| Gln185 | Tyr260 | Tyr277 | |
| Ile189 | Asp269 | Ser278 | |
The application of 2-fold symmetry completes these interactions within the interface.
A survey of unpublished crystal structures in the RCSB Protein Data Bank shows that the dimeric assembly of S. aureus KPR is conserved in the enzymes from Ralstonia eutropha, Ralstonia solanacearum, Mycobacterium tuberculosis, Enterococcus faecalis, Methylococcus capsulatus, and Bacillus subtilis (PDB entries 3HWR, 3GHY, 4OL9, 2EW2, 3I83, and 3EGO, respectively), despite low sequence identity ranging from 20–31% (Figure 4C). The same dimeric assembly has been reported for the homologous enzyme mandelate dehydrogenase of Enterococcus faecium31 (PDB entry 3WFJ) (Figure 4C). The observation of the same dimeric complex in the crystals of highly divergent enzymes is good evidence that the dimeric complex is stable and ancient.
The S. aureus KPR interface contains a central cluster of hydrophobic residues that is disrupted with polar or charged residues in the equivalent surface of monomeric E. coli KPR (Figure 4A). While the structure of the dimer interface is conserved, the sequence is not (Figure S1 of the Supporting Information). The only conserved residue in the dimer interface of S. aureus KPR is Pro271. However, Pro271 is also conserved in the monomeric E. coli KPR sequence, suggesting that it is unlikely to be specific for dimerization. The lack of sequence conservation has frustrated our attempts to define a motif that could be used to predict dimeric KPRs. Our analysis of unpublished crystal structures also identifies the KPRs from Geobacter metallireducens and Porphyromonas gingivalis (PDB entries 3HN2 and 2QYT, respectively) as monomeric KPRs.
Evidence of Kinetic Cooperativity in KPR
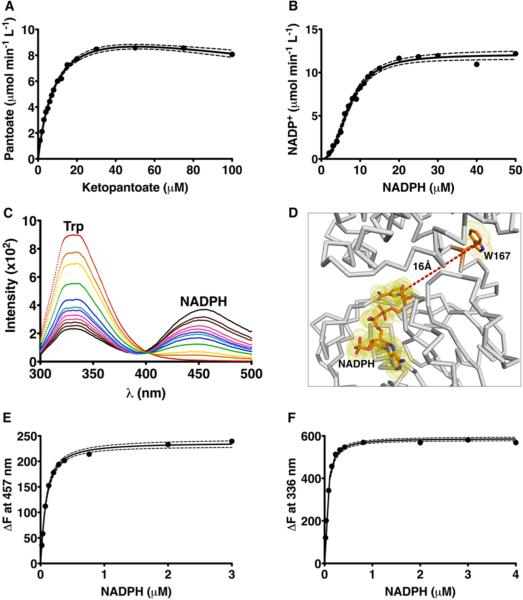
The substrate saturation curves of S. aureus KPR show a steady decrease in Vmax at higher KP concentrations, indicating substrate inhibition (Figure 5A). Fitting the data to the equation for substrate inhibition (eq 2 in Materials and Methods) yields an apparent Ki of 270 ± 40 μM (Figure 5A and Table 3). With respect to NADPH, the substrate saturation curves are strongly sigmoidal (Hill coefficient of 2.5 ± 0.2), indicating substrate cooperativity (Figure 5B and Table 3). The observation of cooperativity in steady state analysis is usually good evidence of a “site-to-site” interaction (thermodynamic cooperativity), but it is not definitive.32,33 Cooperativity in a saturation curve could also be due to a kinetic process.34–37
Figure 5.
Steady state and equilibrium binding studies. (A) The KP saturation curve shows product inhibition (dashed lines indicate the 95% confidence interval). (B) The NADPH saturation curve displays positive cooperativity. (C) Fluorescence emission spectrum showing that KPR excited at 285 nm emits a characteristic Trp spectrum at 336 nm (red line). As KPR is titrated with increasing concentrations of NADPH (orange to black lines), the 336 nm peak is quenched, and a new peak corresponding to NADPH emission appears at 457 nm, indicating FRET from Trp167 to the bound cofactor. (D) Cartoon depicting the spatial relationship of Trp167 to the bound NADPH. (E) Binding isotherm of the change in FRET emission vs free NADPH (see Materials and Methods). (F) Binding isotherm of the change in Trp167 fluorescence vs free NADPH.
Table 3.
Kinetic and Thermodynamic Parameters
| steady state parametersa |
equilibrium bindingb |
||||||
|---|---|---|---|---|---|---|---|
| enzyme | ligand | Km (μM) | Hill coefficient (h) | kcat (s–1) | Ki (μM) | Hill coefficient (h) | Kd (nM) |
| KPR | KP | 9.6 ± 0.7 | 1.0 | 16.6 ± 0.6 | 270 ± 40 | – | – |
| NADPH | 7.2 ± 0.2 | 2.5 ± 0.2 | 16.8 ± 0.3 | – | 1.28 ± 0.05c | 58 ± 2c | |
| 1.22 ± 0.06d | 84 ± 4d | ||||||
| 1.27 ± 0.02e | 117 ± 2e | ||||||
| KPRA181L | KP | 8100 ± 100 | 0.77 ± 0.03 | 18.2 ± 0.8 | – | – | – |
| NADPH | 5.7 ± 0.4 | 1.0 | 16.4 ± 0.3 | – | – | – | |
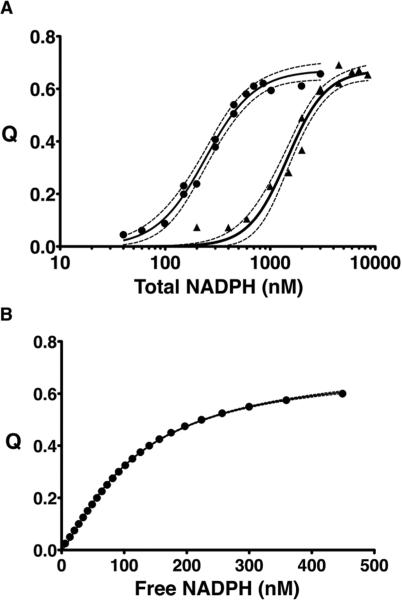
Equilibrium binding studies can be used to distinguish thermodynamic from kinetic cooperativity.32,33,37 We used intrinsic protein fluorescence to study the equilibrium binding of NADPH to S. aureus KPR. S. aureus KPR contains a single tryptophan residue (Trp167) that emits a characteristic fluorescence spectrum upon being excited with light at 285 nm (red line in Figure 5C). Upon the addition of NADPH, the intensity of the 336 nm emission peak of Trp167 decreases and a 457 nm peak consistent with NADPH fluorescence is observed. This suggests that the resonance energy of the excited tryptophan was transferred to the bound NADPH. In fact, the crystal structure of S. aureus KPR shows that the distance between Trp167 and the nicotinamide ring of NADPH is ~16 Å, which is well within the acceptable range (24 Å) for Förster resonance energy transfer (FRET) from tryptophan38 (Figure 5D). To measure binding, we excited Trp167 with 285 nM light and plotted ΔF457 versus increasing NADPH concentrations (Figure 5E). The FRET binding isotherm is only slightly sigmoidal (Hill coefficient of 1.28), with a Kd of 58 nM (Figure 5E and Table 3). As an internal control, we also plotted the NADPH dependence of the decrease in Trp167 fluorescence (ΔF336) and obtained similar results (Figure 5E and Table 3). To address the possibility of a nonlinear fluorescence response to ligand binding, we calculated a model-independent binding isotherm using two different KPR concentrations (Figure 6).13–15 The model-independent binding isotherm shows the same small degree of cooperativity (Hill coefficient of 1.27) that we observed in both the FRET and Trp167 fluorescence binding isotherms (Table 3). In addition, all three binding isotherms predict similar affinities for NADPH (Table 3).
Figure 6.
Model-independent binding isotherm. (A) The binding isotherms for the NADPH-dependent quenching of Trp167 fluorescence (Q) for 300 nM (●) and 3000 nM (▲) KPR fit to eq 8. Dashed lines indicate the 95% confidence interval. (B) The model-independent binding isotherm13–15 shows the quenching of Trp167 fluorescence vs free NADPH, fit to eq 11 (see Materials and Methods for details).
The A181L Substitution Disrupts the Substrate Binding Site
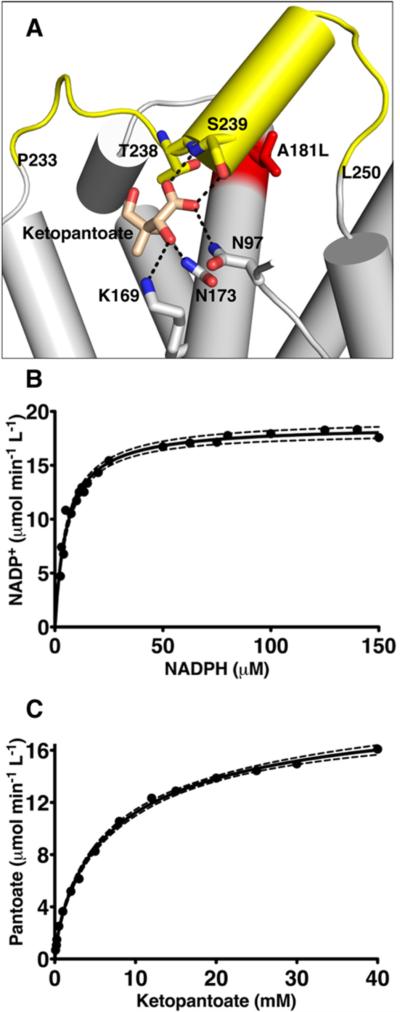
The substrate (KP) is disordered in the ternary crystal structure of S. aureus KPR. Superimposing the ternary complex of E. coli KPR (PDB entry 2OFP7) onto the S. aureus structure places KP in a position that is consistent with the electron density in the active site (Figures 2C and 7A). The residues that bind KP in the E. coli structure7 are conserved in the S. aureus active site (specifically, Lys169, Asn173, Asn197, Asn198, and Ser239) (not shown). The only sequence change involves Thr238, which is replaced with a Ser in the E. coli structure. However, on the basis of our model, Thr238 is expected to contribute a packing interaction that is similar to that of the serine in the E. coli structure (Figure 7A).
Figure 7.
Kinetics of the KPR A181L mutation. (A) Cartoon representation of the ketopantoate binding site. Residues interacting with the ketopantoate are depicted as sticks and labeled. The A181L mutation is colored red. In the A181L mutant, the segment from residue 233 to residue 250 becomes disordered (colored yellow), preventing the interaction of S239 with ketopantoate. (B) The substrate saturation curve of KPR A181L with respect to NADPH is hyberbolic. Dashed lines represent the 95% confidence interval. (C) Substrate saturation curve of KPR A181L with respect to ketopantoate showing negative cooperativity.
We introduced the A181L substitution into S. aureus KPR (KPRA181L) to destabilize the KP binding site. KPRA181L crystallized in a cell that is nonisomorphous with the wild-type enzyme, and the structure was determined using data to 2.6 Å resolution (Table 1). The asymmetric unit contains two molecules of KPRA181L, each containing Asp131 in the same strained conformation seen in the wild-type enzyme (Figure 2D). The application of crystallographic symmetry produces two dimers that are in the same arrangement as the biologically relevant dimer seen in the wild-type structure. The N-terminal residues of chains A and B are disordered (residues 1 and 2 and residues 1–3, respectively), as are the extreme C-termini (residues 284–294 and 286–294, respectively). In addition to the termini, residues 233–250 and 231–249 are disordered in chains A and B, respectively. These residues include Thr238 and Ser239, which contribute to KP binding (Figure 7A).
Steady state analysis of KPRA181L shows that the NADPH saturation curve is hyperbolic, with a Km similar to that of the wild-type enzyme (Figure 7B and Table 3). The substrate saturation curve for KP displays negative cooperativity (Hill coefficient of 0.77), which is not observed in wild-type KPR (Figure 7C and Table 3). The most significant effect of the A181L substitution involves the Km for KP, which is increased 844-fold compared to that of wild-type KPR. Surprisingly, there is no significant change in kcat between KPRA181L and the wild-type enzyme (Table 3).
DISCUSSION
Previous structural studies of KPR have focused on the monomeric enzyme from E. coli.6–9 Here, we present the first structural analysis of a dimeric KPR. We show that the KPR dimeric assembly is conserved in seven deeply divergent homologues, including a 2-hydroxyacid dehydrogenase from Ent. faecium (Figure 4C). The KPR from the archaeon Thermococcus kodakarensis has also been reported to form a dimer in solution.39 In fact, we have identified only two monomeric KPRs in addition to the E. coli enzyme: G. metallireducens and P. gingivalis. In addition, the KPR from Salmonella typhimurium has also been reported to form a monomer in solution.40 Unfortunately, the dimeric KPRs share no conserved sequence motif that can be used for identifying the quaternary structure (Figure S1 of the Supporting Information). The only structural motif is a highly divergent cluster of hydrophobic residues in the interface (Figure 4A). These observations suggest that the dimeric assembly is ancient.
Our data show that the S. aureus KPR mechanism is unusual for this family of enzymes. Previous studies have shown that the KPRs from E. coli,5,7 S. typhimurium,40 and T. kodakarensis39 all display hyperbolic steady state kinetics for both NADPH and KP. In contrast, the steady state kinetics of S. aureus KPR exhibit pronounced positive cooperativity with respect to NADPH, and substrate inhibition with respect to KP (Figure 5 and Table 3). Substrate cooperativity is not unusual in oligomeric enzymes and can indicate an allosteric mechanism. However, the existence of thermodynamic cooperativity cannot be established by using steady state kinetics alone.32,33,37 In fact, our observation of substrate inhibition with KP suggests a possible kinetic mechanism for cooperativity.34–37 Equilibrium binding studies are used to distinguish kinetic from thermodynamic cooperativity;32,33,37 if a substrate saturation curve is sigmoidal, but the binding isotherm is hyperbolic, then the cooperativity is due to a kinetic process. Our binding studies reveal a slight degree of cooperativity with respect to NADPH (Hill coefficient of 1.2–1.3), which suggests a small amount of thermodynamic cooperativity between subunits (Figures 5E,F and 6B and Table 3). However, the absence of the robust cooperativity observed during turnover (Hill coefficient of 2.5) is strong evidence that the sigmoidal NADPH saturation curve is due to kinetic cooperativity.34–37
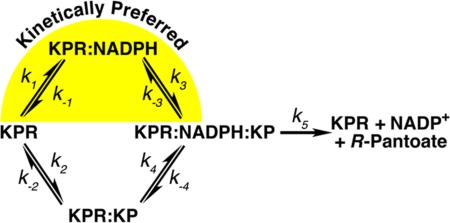
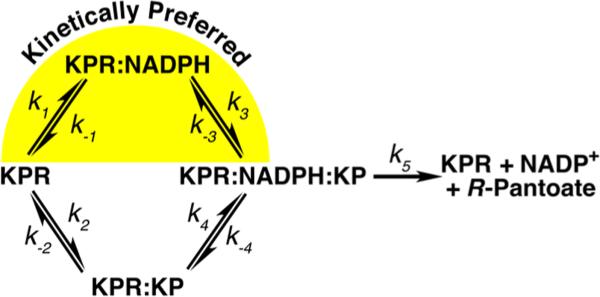
There are two basic mechanisms for kinetic cooperativity: enzyme hysteresis37,41,42 and the random addition of substrate.34–37 Because S. aureus KPR does not display hysteresis (observed as a lag in progress curves), we can discount this mechanism of kinetic cooperativity (data not shown). A random addition mechanism can cause kinetic cooperativity when one path is kinetically preferred (k1k3 > k2k4 in Figure 8), and turnover (k5) is faster than substrate equilibration.34–37 The random addition mechanism of kinetic cooperativity explains the steady state kinetics that we observe in S. aureus KPR (Figure 5 and Table 3). Briefly, with saturating concentrations of KP and low concentrations of NADPH, the slow path (k2k4) will dominate (Figure 8). As NADPH concentrations increase, more of the reaction will proceed through the preferred path (k1k3), giving rise to a sigmoidal curve (Figure 5B and Table 3). On the other hand, saturating concentrations of NADPH and increasing concentrations of KP will initially favor the preferred path but will eventually switch to the slower path, giving the appearance of substrate inhibition (Figure 5A and Table 3). The observation of cooperativity with one substrate, and substrate inhibition with the other, is the hallmark of a random addition mechanism with a kinetically preferred path.34–37
Figure 8.
Proposed random addition mechanism of S. aureus KPR that illustrates the kinetically preferred path (yellow highlight).
The A181L substitution in S. aureus KPR eliminates the kinetic cooperativity observed in the NADPH saturation curve but has no effect on Km or kcat (Figures 5B and 7B and Table 3). In contrast, the Km for KP in KPRA181L increases by 844-fold. The large increase in the Km for KP coupled with no change in kcat suggests that the A181L substitution reduced the affinity for KP (Figure 7 and Table 3). In fact, the crystal structure of KPRA181L shows that Thr238 and Ser239 are disordered (Figure 7A). These residues are important for binding KP; in E. coli KPR, the alanine substitution of the serine equivalent to Ser239 has been shown to decrease the affinity (Kd) for KP by >20-fold, with no effect on kcat or the Km for NADPH.7 The loss of kinetic cooperativity in KPRA181L is consistent with the random addition mechanism. With a decrease in the affinity for KP, the flux through the k1k3 path will increase, giving the appearance of an ordered addition reaction (Figure 8). We do observe a slight negative cooperativity in the KP saturation curve (Figure 7C and Table 3). Negative cooperativity can be due to misfolded active sites that adopt a mix of high-affinity and low-affinity conformations.43 Given the fact that A181L disrupts the KP binding site, this is a reasonable interpretation.
Previous studies have shown that E. coli KPR follows a sequential ordered mechanism in which NADPH binds to the enzyme first, followed by ketopantoate.5,6 We have presented evidence that the mechanism of the S. aureus enzyme is distinct in the KPR family. Given the fact that KPR has been identified as a drug target, our work provides the important mechanistic framework for future studies of this enzyme.
Supplementary Material
ACKNOWLEDGMENTS
We thank Dr. Renuka Kadirvelraj and Ms. Matilda Sanchez for helpful discussions and the SER-CAT personnel (Advanced Photon Source, Argonne National Laboratory, Argonne, IL) for help with the data collection.
Funding
Funding from the University of Georgia Research Alliance to Z.A.W. is gratefully acknowledged.
ABBREVIATIONS
- KPR
ketopantoate reductase
- KP
ketopantoate
- PDB
Protein Data Bank
Footnotes
The authors declare no competing financial interest.
Supporting Information
Sequence alignment (Figure S1). The Supporting Information is available free of charge on the ACS Publications website at DOI: 10.1021/acs.biochem.5b00174.
Accession Codes
The atomic coordinates and structure factors for S. aureus KPR and KPRA181L have been deposited in the Protein Data Bank as entries 4YCA and 4S3M, respectively.
REFERENCES
- 1.Begley TP, Kinsland C, Strauss E. The biosynthesis of coenzyme A in bacteria. Vitam. Horm. (London, U.K.) 2001;61:157–171. doi: 10.1016/s0083-6729(01)61005-7. [DOI] [PubMed] [Google Scholar]
- 2.Devi PB, Samala G, Sridevi JP, Saxena S, Alvala M, Salina EG, Sriram D, Yogeeswari P. Structure-guided design of thiazolidine derivatives as Mycobacterium tuberculosis pantothenate synthetase inhibitors. ChemMedChem. 2014;9:2538–2547. doi: 10.1002/cmdc.201402171. [DOI] [PubMed] [Google Scholar]
- 3.van der Westhuyzen R, Hammons JC, Meier JL, Dahesh S, Moolman WJ, Pelly SC, Nizet V, Burkart MD, Strauss E. The antibiotic CJ-15,801 is an antimetabolite that hijacks and then inhibits CoA biosynthesis. Chem. Biol. 2012;19:559–571. doi: 10.1016/j.chembiol.2012.03.013. [DOI] [PMC free article] [PubMed] [Google Scholar]
- 4.Zhang YM, Frank MW, Virga KG, Lee RE, Rock CO, Jackowski S. Acyl carrier protein is a cellular target for the antibacterial action of the pantothenamide class of pantothenate antimetabolites. J. Biol. Chem. 2004;279:50969–50975. doi: 10.1074/jbc.M409607200. [DOI] [PubMed] [Google Scholar]
- 5.Zheng R, Blanchard JS. Kinetic and mechanistic analysis of the E. coli panE-encoded ketopantoate reductase. Biochemistry. 2000;39:3708–3717. doi: 10.1021/bi992676g. [DOI] [PubMed] [Google Scholar]
- 6.Matak-Vinkovic D, Vinkovic M, Saldanha SA, Ashurst JL, von Delft F, Inoue T, Miguel RN, Smith AG, Blundell TL, Abell C. Crystal structure of Escherichia coli ketopantoate reductase at 1.7 Å resolution and insight into the enzyme mechanism. Biochemistry. 2001;40:14493–14500. doi: 10.1021/bi011020w. [DOI] [PubMed] [Google Scholar]
- 7.Ciulli A, Chirgadze DY, Smith AG, Blundell TL, Abell C. Crystal structure of Escherichia coli ketopantoate reductase in a ternary complex with NADP+ and pantoate bound: Substrate recognition, conformational change, and cooperativity. J. Biol. Chem. 2007;282:8487–8497. doi: 10.1074/jbc.M611171200. [DOI] [PubMed] [Google Scholar]
- 8.Lobley CM, Ciulli A, Whitney HM, Williams G, Smith AG, Abell C, Blundell TL. The crystal structure of Escherichia coli ketopantoate reductase with NADP+ bound. Biochemistry. 2005;44:8930–8939. doi: 10.1021/bi0502036. [DOI] [PubMed] [Google Scholar]
- 9.Ciulli A, Lobley CM, Tuck KL, Smith AG, Blundell TL, Abell C. pH-tuneable binding of 2′-phospho-ADP-ribose to ketopantoate reductase: A structural and calorimetric study. Acta Crystallogr. 2007;D63:171–178. doi: 10.1107/S0907444906044465. [DOI] [PMC free article] [PubMed] [Google Scholar]
- 10.Mulligan ME, Murray-Leisure KA, Ribner BS, Standiford HC, John JF, Korvick JA, Kauffman CA, Yu VL. Methicillin-resistant Staphylococcus aureus: A consensus review of the microbiology, pathogenesis, and epidemiology with implications for prevention and management. Am. J. Med. 1993;94:313–328. doi: 10.1016/0002-9343(93)90063-u. [DOI] [PubMed] [Google Scholar]
- 11.Fjeld CC, Birdsong WT, Goodman RH. Differential binding of NAD+ and NADH allows the transcriptional corepressor carboxyl-terminal binding protein to serve as a metabolic sensor. Proc. Natl. Acad. Sci. U.S.A. 2003;100:9202–9207. doi: 10.1073/pnas.1633591100. [DOI] [PMC free article] [PubMed] [Google Scholar]
- 12.Palmier MO, Van Doren SR. Rapid determination of enzyme kinetics from fluorescence: Overcoming the inner filter effect. Anal. Biochem. 2007;371:43–51. doi: 10.1016/j.ab.2007.07.008. [DOI] [PMC free article] [PubMed] [Google Scholar]
- 13.Bujalowski W, Jezewska MJ. Quantitative Thermodynamic Analyses of Spectroscopic Titration Curves. J. Mol. Struct. 2014;1077:40–50. doi: 10.1016/j.molstruc.2014.04.041. [DOI] [PMC free article] [PubMed] [Google Scholar]
- 14.Lohman TM, Bujalowski W. Thermodynamic methods for model-independent determination of equilibrium binding isotherms for protein-DNA interactions: Spectroscopic approaches to monitor binding. Methods Enzymol. 1991;208:258–290. doi: 10.1016/0076-6879(91)08017-c. [DOI] [PubMed] [Google Scholar]
- 15.Bujalowski W. Thermodynamic and kinetic methods of analyses of protein-nucleic acid interactions. From simpler to more complex systems. Chem. Rev. 2006;106:556–606. doi: 10.1021/cr040462l. [DOI] [PubMed] [Google Scholar]
- 16.Laue TM, Shah BD, Ridgeway TM, Pelletier SL. Computer-aided interpretation of analytical sedimentation data for proteins. In: Harding SE, Rowe AJ, Horton JC, editors. Analytical ultracentrifugation in biochemistry and polymer science. The Royal Society of Chemistry; Cambridge, U.K.: 1992. pp. 90–125. [Google Scholar]
- 17.Brown PH, Schuck P. Macromolecular size-and-shape distributions by sedimentation velocity analytical ultracentrifugation. Biophys. J. 2006;90:4651–4661. doi: 10.1529/biophysj.106.081372. [DOI] [PMC free article] [PubMed] [Google Scholar]
- 18.Ortega A, Amoros D, Garcia de la Torre J. Prediction of hydrodynamic and other solution properties of rigid proteins from atomic- and residue-level models. Biophys. J. 2011;101:892–898. doi: 10.1016/j.bpj.2011.06.046. [DOI] [PMC free article] [PubMed] [Google Scholar]
- 19.Kabsch W. Xds. Acta Crystallogr. 2010;D66:125–132. doi: 10.1107/S0907444909047337. [DOI] [PMC free article] [PubMed] [Google Scholar]
- 20.Karplus PA, Diederichs K. Linking Crystallographic Model and Data Quality. Science. 2012;336:1030–1033. doi: 10.1126/science.1218231. [DOI] [PMC free article] [PubMed] [Google Scholar]
- 21.Evans PR, Murshudov GN. How good are my data and what is the resolution? Acta Crystallogr. 2013;D69:1204–1214. doi: 10.1107/S0907444913000061. [DOI] [PMC free article] [PubMed] [Google Scholar]
- 22.McCoy AJ, Grosse-Kunstleve RW, Adams PD, Winn MD, Storoni LC, Read RJ. Phaser crystallographic software. J. Appl. Crystallogr. 2007;40:658–674. doi: 10.1107/S0021889807021206. [DOI] [PMC free article] [PubMed] [Google Scholar]
- 23.Adams PD, Afonine PV, Bunkoczi G, Chen VB, Davis IW, Echols N, Headd JJ, Hung LW, Kapral GJ, Grosse-Kunstleve RW, McCoy AJ, Moriarty NW, Oeffner R, Read RJ, Richardson DC, Richardson JS, Terwilliger TC, Zwart PH. PHENIX: A comprehensive Python-based system for macromolecular structure solution. Acta Crystallogr. 2010;D66:213–221. doi: 10.1107/S0907444909052925. [DOI] [PMC free article] [PubMed] [Google Scholar]
- 24.Emsley P, Cowtan K. Coot: Model-building tools for molecular graphics. Acta Crystallogr. 2004;D60:2126–2132. doi: 10.1107/S0907444904019158. [DOI] [PubMed] [Google Scholar]
- 25.Vagin A, Teplyakov A. Molecular replacement with MOLREP. Acta Crystallogr. 2010;D66:22–25. doi: 10.1107/S0907444909042589. [DOI] [PubMed] [Google Scholar]
- 26.Krissinel E, Henrick K. Inference of macromolecular assemblies from crystalline state. J. Mol. Biol. 2007;372:774–797. doi: 10.1016/j.jmb.2007.05.022. [DOI] [PubMed] [Google Scholar]
- 27.Hayward S, Berendsen HJ. Systematic analysis of domain motions in proteins from conformational change: New results on citrate synthase and T4 lysozyme. Proteins. 1998;30:144–154. [PubMed] [Google Scholar]
- 28.Laskowski RA, Macarthur MW, Moss DS, Thornton JM. PROCHECK: A program to check the stereochemical quality of protein structures. J. Appl. Crystallogr. 1993;26:283–291. [Google Scholar]
- 29.Karplus PA. Experimentally observed conformation-dependent geometry and hidden strain in proteins. Protein Sci. 1996;5:1406–1420. doi: 10.1002/pro.5560050719. [DOI] [PMC free article] [PubMed] [Google Scholar]
- 30.Kabsch W, Sander C. Dictionary of protein secondary structure: Pattern recognition of hydrogen-bonded and geometrical features. Biopolymers. 1983;22:2577–2637. doi: 10.1002/bip.360221211. [DOI] [PubMed] [Google Scholar]
- 31.Miyanaga A, Fujisawa S, Furukawa N, Arai K, Nakajima M, Taguchi H. The crystal structure of d-mandelate dehydrogenase reveals its distinct substrate and coenzyme recognition mechanisms from those of 2-ketopantoate reductase. Biochem. Biophys. Res. Commun. 2013;439:109–114. doi: 10.1016/j.bbrc.2013.08.019. [DOI] [PubMed] [Google Scholar]
- 32.Hammes GG, Wu CW. Kinetics of allosteric enzymes. Annu. Rev. Biophys. Bioeng. 1974;3:1–33. doi: 10.1146/annurev.bb.03.060174.000245. [DOI] [PubMed] [Google Scholar]
- 33.Ricard J, Cornish-Bowden A. Co-operative and allosteric enzymes: 20 years on. Eur. J. Biochem. 1987;166:255–272. doi: 10.1111/j.1432-1033.1987.tb13510.x. [DOI] [PubMed] [Google Scholar]
- 34.Jensen RA, Trentini WC. Alternative allosteric effects exerted by end products upon a two-substrate enzyme in Rhodomicrobium vannielii. J. Biol. Chem. 1970;245:2018–2022. [PubMed] [Google Scholar]
- 35.Ferdinand W. The interpretation of non-hyperbolic rate curves for two-substrate enzymes. A possible mechanism for phosphofructokinase. Biochem. J. 1966;98:278–283. doi: 10.1042/bj0980278. [DOI] [PMC free article] [PubMed] [Google Scholar]
- 36.Segal IH. Enzyme Kinetics. 1st ed. Wiley-Interscience; New York: 1975. [Google Scholar]
- 37.Neet KE. Cooperativity in enzyme function: Equilibrium and kinetic aspects. Methods Enzymol. 1995;249:519–567. doi: 10.1016/0076-6879(95)49048-5. [DOI] [PubMed] [Google Scholar]
- 38.Steinberg IZ. Long-range nonradiative transfer of electronic excitation energy in proteins and polypeptides. Annu. Rev. Biochem. 1971;40:83–114. doi: 10.1146/annurev.bi.40.070171.000503. [DOI] [PubMed] [Google Scholar]
- 39.Tomita H, Imanaka T, Atomi H. Identification and characterization of an archaeal ketopantoate reductase and its involvement in regulation of coenzyme A biosynthesis. Mol. Microbiol. 2013;90:307–321. doi: 10.1111/mmi.12363. [DOI] [PubMed] [Google Scholar]
- 40.Frodyma ME, Downs D. ApbA, the ketopantoate reductase enzyme of Salmonella typhimurium is required for the synthesis of thiamine via the alternative pyrimidine biosynthetic pathway. J. Biol. Chem. 1998;273:5572–5576. doi: 10.1074/jbc.273.10.5572. [DOI] [PubMed] [Google Scholar]
- 41.Frieden C. Kinetic aspects of regulation of metabolic processes. The hysteretic enzyme concept. J. Biol. Chem. 1970;245:5788–5799. [PubMed] [Google Scholar]
- 42.Kadirvelraj R, Sennett NC, Custer GS, Phillips RS, Wood ZA. Hysteresis and negative cooperativity in human UDP-glucose dehydrogenase. Biochemistry. 2013;52:1456–1465. doi: 10.1021/bi301593c. [DOI] [PubMed] [Google Scholar]
- 43.Levitzki A, Koshland DE., Jr. Negative cooperativity in regulatory enzymes. Proc. Natl. Acad. Sci. U.S.A. 1969;62:1121–1128. doi: 10.1073/pnas.62.4.1121. [DOI] [PMC free article] [PubMed] [Google Scholar]
- 44.Diederichs K, Karplus PA. Improved R-factors for diffraction data analysis in macromolecular crystallography. Nat. Struct. Biol. 1997;4:269–275. doi: 10.1038/nsb0497-269. (published erratum appears on page 592 of same volume) [DOI] [PubMed] [Google Scholar]
- 45.Hayward S, Lee RA. Improvements in the analysis of domain motions in proteins from conformational change: DynDom version 1.50. J. Mol. Graphics Modell. 2002;21:181–183. doi: 10.1016/s1093-3263(02)00140-7. [DOI] [PubMed] [Google Scholar]
Associated Data
This section collects any data citations, data availability statements, or supplementary materials included in this article.


