Figure 2.
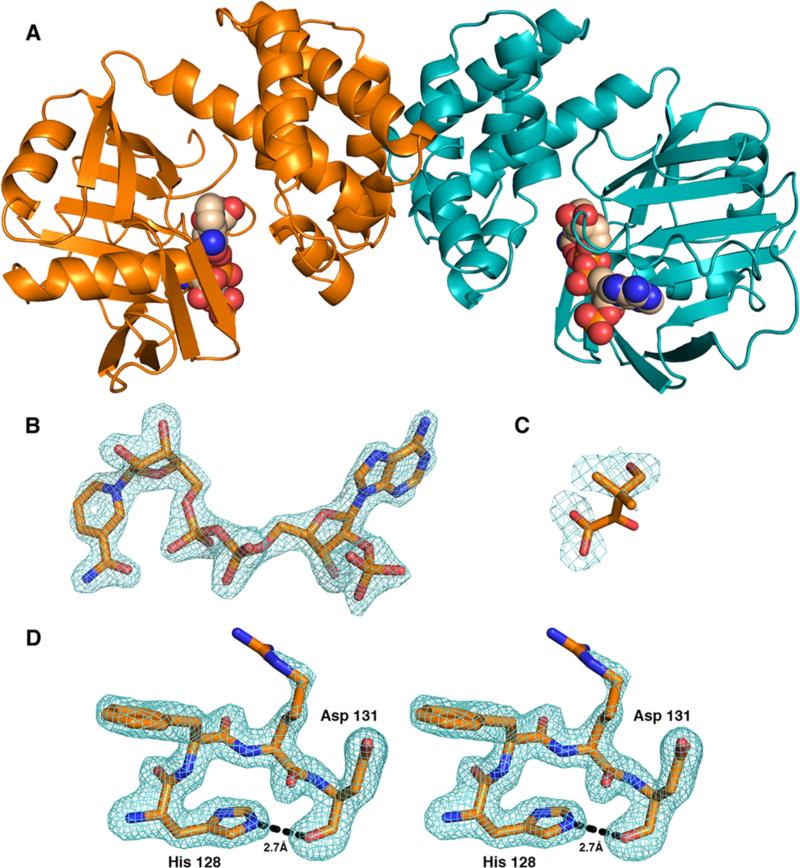
Crystal structure of S. aureus KPR. (A) Cartoon representation of the S. aureus KPR dimer with NADPH (spheres). (B) Difference density map (Fo – Fc) for NADPH calculated at 1.81 Å and contoured at 3σ. The map was calculated after omitting the ligands and subjecting the model to simulated annealing. (C) Difference density map (Fo – Fc) of the active site calculated at 1.81 Å and contoured at 3σ. Superimposing the E. coli ternary KPR structure (PDB entry 2OFP) shows that the electron density is consistent with a disordered KP. Because of the disorder, KP was not included in the final model. (D) Difference density map (Fo – Fc) of residues 128–131 calculated at 1.81 Å and contoured at 3σ, depicting the hydrogen bond (dashed line) between His128 and Asp131. The map was calculated after omitting residues 128–131 and subjecting the model to simulated annealing.

