Abstract
Background
To develop a technique to non-invasively estimate Stroke Volume (SV) in real-time during Magnetic Resonance Imaging (MRI) guided procedures, based on induced Magnetohydrodynamic Voltages (VMHD) that occur in Electrocardiogram (ECG) recordings during MRI exams, leaving the MRI scanner free to perform other imaging tasks. Due to the relationship between blood-flow (BF) and VMHD, we hypothesized that a method to obtain SV could be derived from extracted VMHD vectors in the Vectorcardiogram frame-of-reference (VMHDVCG).
Methods and Results
To estimate a subject-specific BF-VMHD model, VMHDVCG was acquired during a 20-second breath-hold and calibrated versus aortic BF measured using Phase Contrast Magnetic Resonance (PCMR) in 10 subjects (n=10) and one subject diagnosed with Premature Ventricular Contractions (PVCs). Beat-to-Beat validation of VMHDVCG derived BF was performed using Real-Time Phase Contrast (RTPC) imaging in 7 healthy subjects (n=7) during a 15 minute cardiac exercise stress tests and 30 minutes after stress relaxation in 3T MRIs. Subject-specific equations were derived to correlate VMHDVCG to BF at rest, and validated using RTPC. An average error of 7.22% and 3.69% in SV estimation, respectively, was found during peak stress, and after complete relaxation. Measured beat-to-beat blood flow time-history derived from RTPC and VMHD were highly correlated using a Spearman Rank Correlation Coefficient during stress tests (0.89) and after stress relaxation (=0.86).
Conclusions
Accurate beat-to-beat SV and BF were estimated using VMHDVCG extracted from intra-MRI 12-lead ECGs, providing a means to enhance patient monitoring during MR imaging and MR-guided interventions.
Keywords: electrocardiogram, stroke volume, magnetohydrodynamic, MHD, MRI, ECG, cardiovascular research
Left ventricular stroke volume (SV) is a measure of the amount of blood ejected into the aortic arch during the systolic phase of the cardiac cycle. Real-time or beat-to-beat SV, measured over successive cardiac cycles, is used commonly to evaluate left-ventricular (LV) mechanical function, which can detect the pathological response to stress and arrhythmias1–5. In practice, SV quantification is often performed using invasive Trans-Esophageal Echocardiography (TEE)6–8, or Invasive Blood Pressure (IBP) catheters9. Conventional cine Phase-Contrast MRI (PCMR)10, typically provides only an averaged SV over the course of 10–20 successive cardiac cycles11. A method to quantify beat-to-beat SV non-invasively within the MRI scanner, which would not increase the duration of invasive procedures could serve to complement existing physiological monitoring information (SPO2, ECG) during imaging or interventional procedures performed within an MRI scanner. This is particularly relevant for higher-risk patients, such as those patients with a history of myocardial or cerebral ischemia, those who are intubated during imaging, or those undergoing cardiac stress testing within the MRI scanner.
The electrocardiogram (ECG) signal is required for cardiac synchronization during cardiovascular MRI, despite the presence of Magnetohydrodynamic voltages (VMHD) which significantly alter the appearance of the ECG trace inside the bore (Fig. 1a–b)12–14. VMHD becomes significant during systole when rapidly ejected blood from the left ventricle into the aortic arch interacts with the strong magnetic field (B0) of the MRI15–17. The uniformity of the magnetic field within the Diameter Spherical Volume of the MRI allows for uniform and constant exposure of flow in the aortic arch to B0, minimizing variations in induced VMHD due to off-center positioning and variances in the displacement of the heart from the isocenter of the MRI18, 19. Due to this relationship, we hypothesized that blood-flow, as a function of time in the cardiac cycle, and left-ventricular SV could be derived using VMHD extracted from intra-MRI ECG (Fig. 1c). This method would allow for non-invasive beat-to-beat SV estimation that can monitor patient condition during conventional cardiac MRI routines, and potentially replace invasive monitoring during complex interventional procedures.
Figure 1.
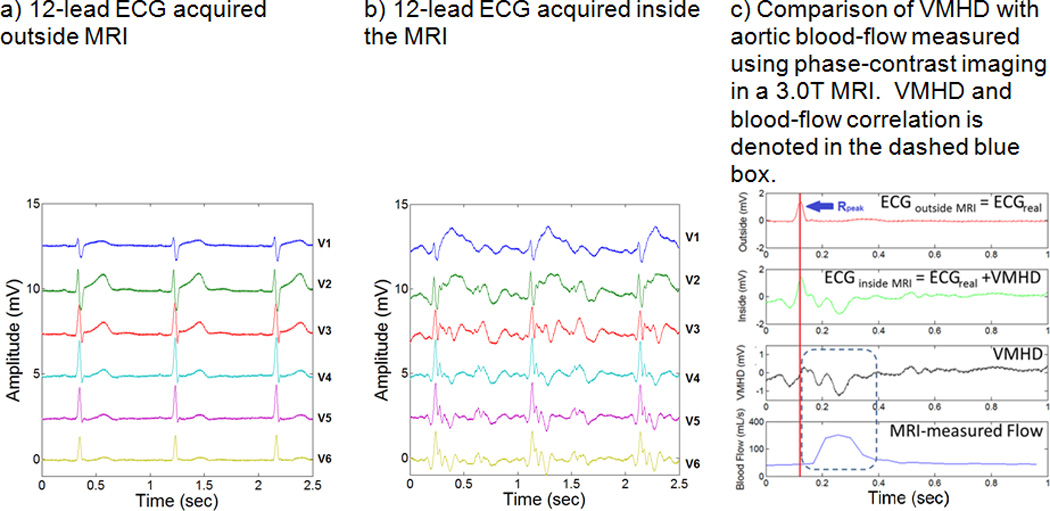
Source of the Magnetohydrodynamic (MHD) physical phenomena, and the correlation between induced MHD voltages in ECG and aortic blood-flow.
We hypothesized that development of VMHD-derived SV estimation method could allow for continuous beat-to-beat blood flow determination, requiring only a software plugin in MRI-conditional ECG recording systems for VMHD-SV model calibration. The presented method provides a non-invasive physiological measure of blood flow “for free” in standard cardiac MRI routines, leaving the scanner free to perform other imaging tasks. This study forms an extension of previous work on the correlation between MHD and SV17, 20, 21.
METHODS
Study Population
Ten healthy volunteers (n=10) and one patient diagnosed with Premature Ventricular Contractions (PVCs) (n=1) were studied with Institutional Review Board (IRB) approval. A GE digital-IT 12-Lead ECG recording system, modified to be MRI-conditional was installed at Brigham and Women’s Hospital16, 22 and used to record 12-lead ECG traces using standard 12-lead ECG chest placement in 3 healthy volunteer subjects in a Siemens Skyra 3T scanner. A similar 12-lead ECG recording system was installed at Emory University Hospital, and was used to record 12-lead ECG traces in 7 healthy volunteer subjects in a Siemens Trio 3T scanner. Conventional cine PCMR and real-time PCMR (RTPC) with a repetition time of 44 ms and an acquisition window of 20 sec was used to validate VMHDVCG-based metrics for each test subject.
ECG Recording System
The ECG recording system modified to be MRI-conditional has a non-magnetic coaxial ECG cable fitted with 10 carbon lead clips, inline RF filters for RF suppression. An electronic switching circuit synchronized with the MRI gradient cabinet was connected to the ECG front-end amplifier to block out MRI gradient-induced noise to ECG traces during MR imaging22. The MRI-conditional ECG recording system only records physiological signals in the absence of gradient activity, removing the potential for variations in induced VMHD due to alterations in the MRI magnetic field.
VMHD-derived metrics were derived and validated in four parts (Fig. 2): (1) Derivation of cine PCMR Equation of Fit; (2) Vectorial MHD processing; (3) Patient-specific model calibration using PCMR; and (4) RTPC model validation under varying HR.
Figure 2.
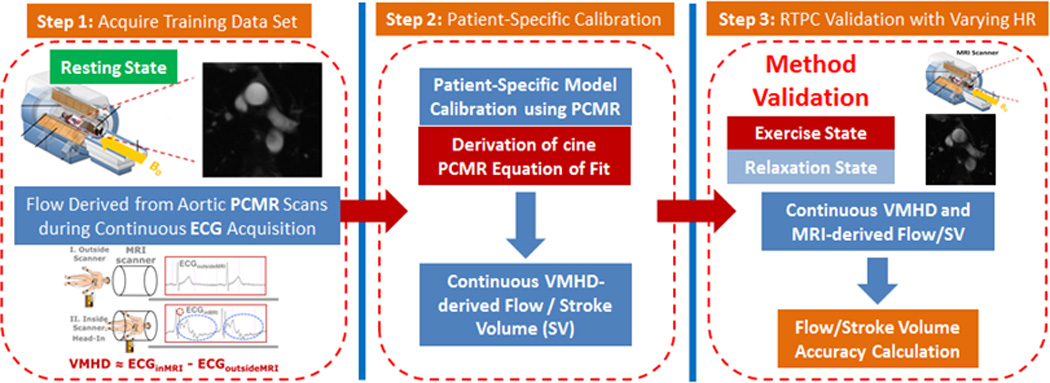
Methodology for establishing a model to transform extracted VMHD into flow (Steps 1) using conventional cine PCMR as a method of calibration (Step 2). RTPC was subsequently used during a series of exercise stress tests as validation (Step 3).
1) Derivation of cine PCMR Equation of Fit
Relationship of VMHD to Aortic Flow
We developed a patient-specific multiple-parameter linear regression (MLR) model, able to obtain a subject-specific approximation of volumetric blood-flow (mL/s) using the correlation with extracted VMHD in the Vectorcardiogram (VCG) reference frame (VMHDVCG). VMHDVCG is be contrasted with the conventional VCG (Fig. 3a), which records the magnitude and direction of the heart’s electrical activity (Fig. 3b), as it illustrates the direction and magnitude of induced VMHD in the same frame of reference (Fig. 3c)23. The current regression model was improved from previous methodology based on MHD signals extracted from a single ECG lead, whereas the derived blood flow was not in standard unit and was lacking of quantitative validation22.
Figure 3.

Relationship of the Human Vectorcardiogram (VCG) to patient anatomy and a comparison of VCGs acquired inside and outside of the MRI bore, illustrating alterations in a Human VCG due to induced VMHD.
As VCG provides vectorial information, it provides a frame of reference for describing the heart’s electrical activity during the development of this model. The blood-flow “gold-standard”, as a function of time, was obtained using a conventional cine PCMR scan in the aortic arch. VMHDVCG-derived volumetric-blood-flow Flow(t)was then time-integrated over the systolic phase to estimate SV (SVMHD) (Eqn. 1), which was compared to SV derived from PCMR (SVPC).
| (1) |
A solution of the proposed model can be derived by first considering the spatial components of the extracted VMHDVCG at any given time (Eqn. 2) and their relationship to the volume of moving aortic blood in the static magnetic field (B0) over the length of the aortic-arch at this time.
| (2) |
The flow, as a function of induced MHD voltages, may be represented as a linear summation of experimentally-derived linear regression coefficients (Eqn. 3).
| (3) |
After a patient-specific model calibration was established using conventional cine PCMR (detailed in Methods – Section 3), the success of the MHD-derived SVMHD and blood-flow (BFMHD) was thereafter evaluated by comparison with results obtained from cine RTPC during a series of exercise stress testing (detailed in Methods – Section 4). Correlation between VMHD and MRI derived blood-flow was calculated.
2) Vectorial MHD Processing
12-lead ECG traces were recorded using the MRI-conditional 12-lead ECG system, and post-processing was performed using custom Matlab script (MathWorks, Natick, MA). The QRS complex in each ECG trace was tracked using the 3DQRS method16, 22, and verified by a cardiologist in order to identify each cardiac cycle. Cardiac cycles were scaled to 60 beats per minute (bpm), through data interpolation and decimation, in order to obtain a common reference level for VMHD extraction. VMHD traces at each electrode were low-pass filtered to remove high-frequency noise and extracted by the subtraction of ECGs obtained with the subjects outside (ECGreal) from inside (ECGreal + VMHD) the MRI22. The VMHD traces extracted from the 12-lead ECG traces were converted into the VCG frame of reference (e.g. MHDVCG) using an inverse Dower transform (iDT)24. iDT utilizes all 8 independent traces (VMHDI, VMHDII, VMHDV1, VMHDV2, VMHDV3, VMHDV4, VMHDV5, VMHDV6) from the 12-lead ECG recordings to produce VMHDX, VMHDY, VMHDZ (Eqn. 4).
| (4) |
3) Patient-Specific Model Calibration using PCMR
Conventional cine PCMR was obtained to derive the subject-specific equations of fit in each healthy subject (male, ages 20–40) (n=10) and a patient (male, age 25) diagnosed with mild interpolated PVCs (n=1) (Eqn. 3) using a transverse slice, perpendicular to the direction of flow in the ascending aorta, to quantify the blood-flow volume and SV using a Siemens Skyra 3T MRI with the following parameters: VENC: 150 cm/s; TR/TE/flip: 37.00 ms/4.00 ms/15°; Field-of-View: 300 mm by 243 mm; Slick thickness: 3 mm. SVPC was calculated from measured blood-flow by time-integration of measured blood flow across the aortic lumen within the region of interest (Eqn. 1). 12-lead ECG recordings were performed during a 20-second breath-hold to reduce artifacts associated with bulk patient motion and alterations in breathing patterns. Normal breathing patterns produced a minimal effect on acquired ECGs, with baseline variations being removed using a two-pole 0.05Hz to 0.67Hz linear digital high-pass filter with phase compensation to induce zero phase distortion as per AHA standards25. 12-lead ECG and conventional cine PCMR baseline recordings were used to train the MLR equation to obtain fit coefficients (A0, A1, A2 and A3) at a resting heart rate.
4) RTPC Validation under Varying Heart Rates
Method accuracy was evaluated in 7 subjects during a series of 15 minute exercise stress tests designed to increase patient HR during RTPC cine scans recorded with the following parameters: VENC: 150 cm/s; TR/TE/flip: 44.08 ms/5.76 ms/30o; Field-of-View: 268 mm by 330 mm; Slick thickness: 10 mm. Blood velocity was measured from cine images using Segment v1.9, a medical image analysis package26, 27, and used to calculate the flow rate.
The accuracy of SVMHD and BFMHD were tested during changes in HR in seven subjects during an exercise stress test using a resistance band and an MRI-compatible exercise bike (Fig. 4), at peak stress, after 15 minutes of exercise, and during the HR’s subsequent return-to-baseline (full relaxation 30 minutes after induced stress). The exercise elevates each subject’s heart rate above baseline by approximately 40%. Once the subjects reached peak stress, with a Sp02 sensor measuring the instantaneous HR, RTPC scans were performed for 30 frames, and 12-lead ECG recordings were subsequently recorded during a 20-second breath-hold. Once the subject’s HR returned to rest, ECG baseline data was acquired again.
Figure 4.
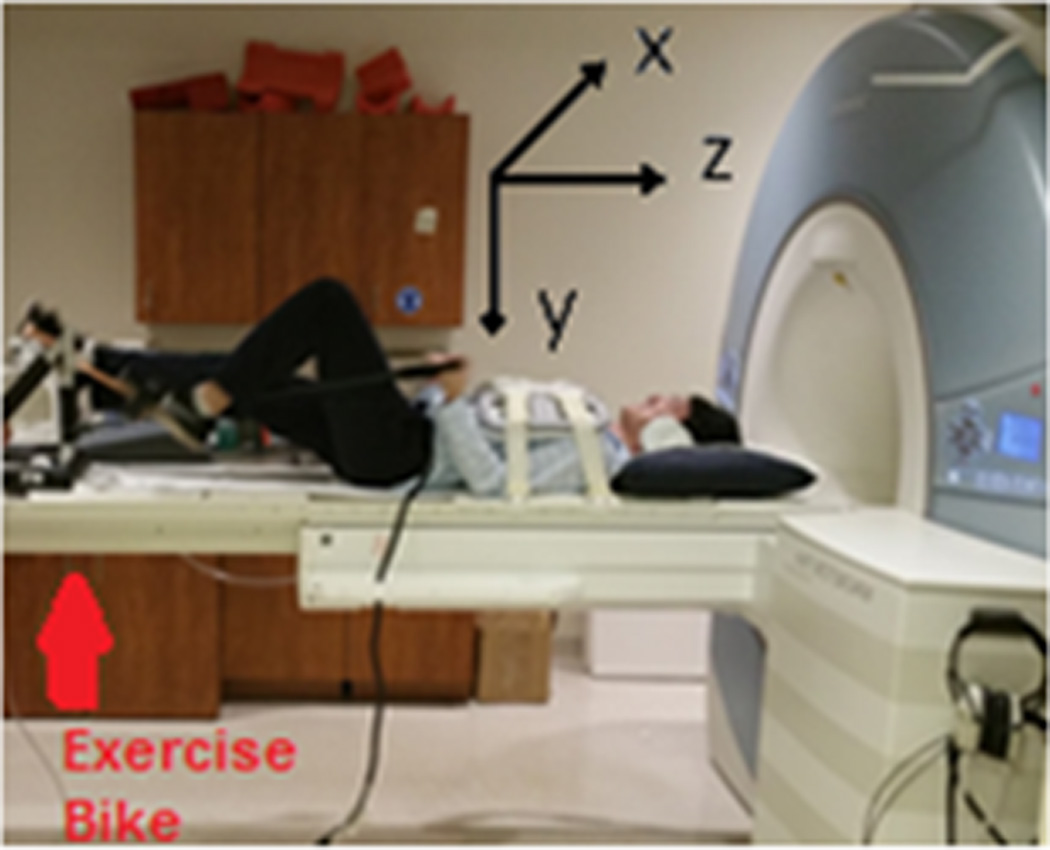
Depiction of a human subject undergoing an exercise stress test using an ergometer on the MRI scanner table. The relationship of the MRI coordinate plane to the position of the subject can be viewed.
A Bland-Altman analysis comparing VMHD- and MRI- derived SV (mL) and Peak Flow (mL/s) was performed using the subject dataset (during baseline, elevated, and a return to baseline heart rate) to assess the clinical relevance of results obtained through exercise stress testing and quantify the bias of the measurements.
RESULTS
1) Patient-Specific Model Calibration using PCMR
Subject VMHD-derived blood-flow and SV were compared to PCMR results (Fig. 5a) to evaluate fit (Table 1), with correlation determined through a Spearman Rank Correlation Coefficient, found to be > 0.84. VMHD-based SV was estimated with a < 5% error as compared to PCMR in all subjects. Based on the standard error achieved in SVMHD as compared to SVPC, a sample size of 10 subjects has been used in this study to achieve a margin of error of 1mL with 95% confidence and a statistical power of 0.95.
Figure 5.
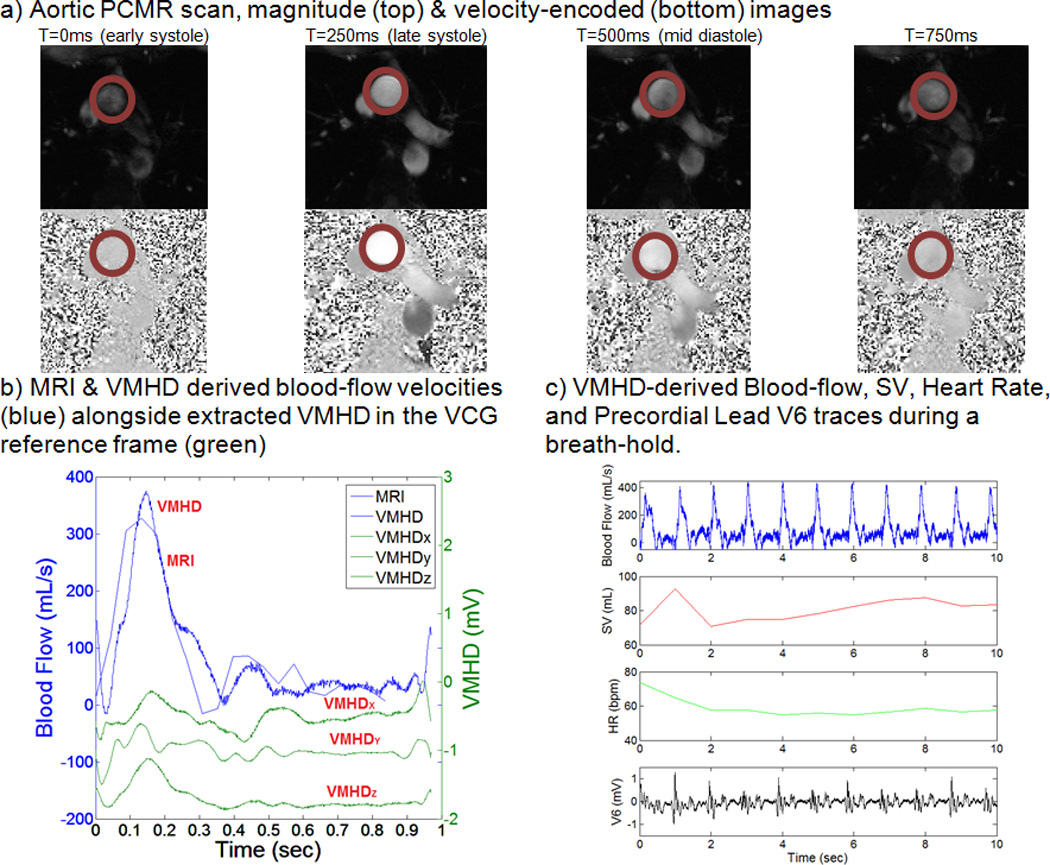
Stroke Volume Estimation using VMHDVCG and PCMR based methodology in human subject#1.
Table 1.
Multiple Linear Regression for Blood-flow and Stroke Volume Estimation using VMHDVCG
| Subjects | Correlation | SVVMHD | SVPC | Initial Fit Error |
|---|---|---|---|---|
| 1 | 0.94 | 73.7 mL | 75.7 mL | 2.62% |
| 2 | 0.95 | 78.5 mL | 78.1 mL | 0.59% |
| 3 | 0.84 | 55.1 mL | 53.2 mL | 3.56% |
| 4 | 0.88 | 84.8 mL | 84.8 mL | 0.09% |
| 5 | 0.89 | 71.1 mL | 71.7 mL | 0.86% |
| 6 (50th Percentile Male Weight)+ | 0.95 | 79.0 mL | 78.4 mL | 0.76% |
| 7 (90th Percentile Male Weight)+ | 0.99 | 76.8 mL | 77.6 mL | 1.00% |
| 8 | 0.89 | 96.6 mL | 95.1 mL | 1.58% |
| 9 | 0.85 | 78.1 mL | 79.5 mL | 1.69% |
| 10 | 0.92 | 86.5 mL | 86.1 mL | 0.48% |
Conventional cine PCMR scans were obtained for each subject and used to extract blood-flow as a function of time (Fig. 5a). Using the previously described coefficients (A0, A1, A2 and A3) (Eqn. 3), the patient-specific relationship between extracted VMHDVCG and BFMHD was estimated, and an appropriate fit was computed (Fig. 5b). Using this methodology, real-time beat-to-beat BFMHD and SVMHD, as well as the associated HR, were estimated (Fig. 5c), providing continuous flow and SV monitoring.
VMHD-derived arrhythmic beats were detected in the PVC patient (Fig.6), and an 18.8% decrease in SV was observed during arrhythmic beats as compared to normal beats (Fig. 6c). Induced VMHD can be seen superimposed upon the PVC beat as compared to the PVC observed outside of the MRI bore (Fig. 6a), increasing the difficulty in recognizing the arrhythmic beat (Fig. 6b). Induced VMHD was suppressed during the PVC due to the decrease in blood flow that occurs from sub-optimal ventricular contraction and filling.
Figure 6.
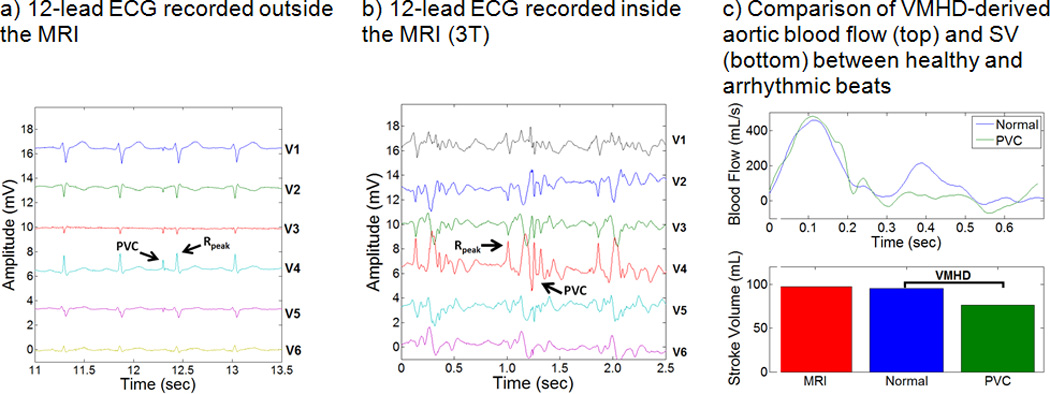
BF and SV estimation using VMHDVCG versus the PCMR gold standard for patient subject #1, diagnosed with Premature Ventricular Contractions (PVC). PVCs are clearly visible in 12-lead ECGs taken outside and inside the MRI bore. A decrease in SV was observed during cardiac cycles which experience an arrhythmic beat (PVC).
2) RTPC Model Validation under Varying Heart Rate
The robustness of the method to variations in subject anthropometry and electrode placement can be observed by comparing subjects #6 and #7 (Fig. 7). Subjects 6 and 7 were chosen to validate the blood-flow and SV estimation methods as they accurately represent approximately a 50th Percentile Male Weight (Weight: 68kg; Height: 168cm; Chest circumference: 94cm), and approximately a 90th Percentile Male Weight (Weight: 127kg; Height: 185cm; Chest circumference: 135cm) in the population28, 29.
Figure 7.
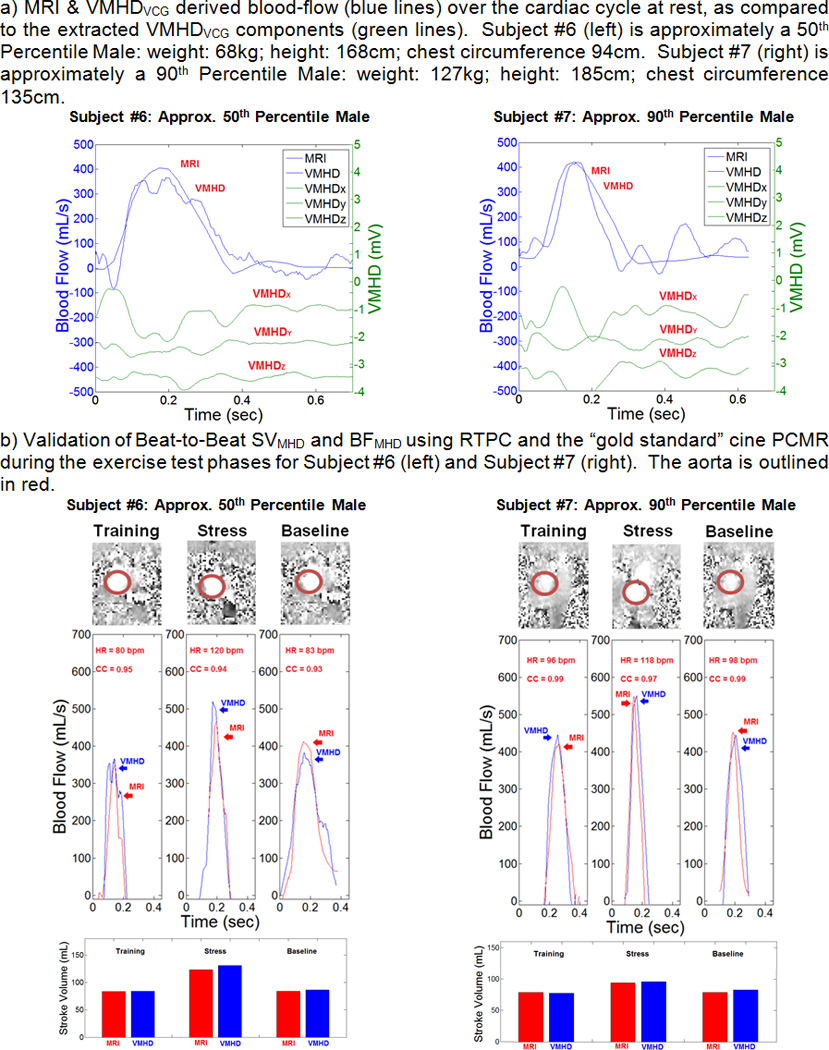
BF and SV Estimation using VMHDVCG, versus the PCMR, and RTPC gold standards for subjects #6 and #7. A) Initial fit of VMHDVCG to BFMRI to generate the BFMHD metric; B) validation of BFMHD using RTPC during exercise stress testing and after the return to baseline heart rate.
A representative RTPC scan image is shown for each section of the exercise stress test (baseline, elevated, and return to baseline heart rates). Correlation in the VMHD-derived flow waveform was shown to maintain a level of consistency with the RTPC gold standard during exercise stress testing and after the return to baseline (Table 2). The VMHD-derived method was able to estimate peak flow during each cardiac cycle with an average error of < 4.59%. The mean predicted ejection period was shown to differ from the RTPC cine by an average of 31 ms, during peak stress, and 56 ms after the full relaxation, compared to the temporal resolution of the ECG traces (2ms) and the RTPC (44ms). VMHD-derived metrics were shown to accurately predict aortic blood flow and stroke volume, with some inaccuracies that may be attributed to the low RTPC temporal resolution relative to the ECG traces. From the results in a Bland-Altman analysis (Fig. 8), taken from subjects in each stage of exercise stress testing, it can be observed that the variability does not appear in a clear trend, and the error is not necessarily dependent on the average. The mean bias line calculated from SV estimation yields a value of 3.3 mL, with an average error of 6.71% calculated from the mean difference and the limits of agreement, a comparable error to those observed in conventional methods used in clinical practice11, 30. Repeatability was assessed based on an ANOVA taken from SV difference measurements. A value of 6.95 mL was calculated, suggesting that repeat SV measurements should differ by no more than 6.95 mL, also a comparable error suggesting method repeatability31, 32.
Table 2.
Assessment of VMHDVCG-derived Flow Metrics in Relationship to MRI
| Stress Testing | Return to Baseline | |||||||
|---|---|---|---|---|---|---|---|---|
| # | Flow Waveform Correlation |
Peak Flow Error |
Ejection Period Difference |
SV Error | BF Waveform Correlation |
Peak Flow Error |
Ejection Period Difference |
SV Error |
| 4 | 0.85 | 6.03% | 26 ms | 10.35% | 0.78 | 1.17% | 80 ms | 0.07% |
| 5 | 0.94 | 2.90% | 45 ms | 11.15% | 0.85 | 5.98% | 54 ms | 8.86% |
| 6 | 0.94 | 11.31% | 20 ms | 6.30% | 0.93 | 8.07% | 50 ms | 2.08% |
| 7 | 0.97 | 0.66% | 40 ms | 2.30% | 0.99 | 1.98% | 50 ms | 5.54% |
| 8 | 0.84 | 0.88% | 21 ms | 9.02% | 0.89 | 2.68% | 45 ms | 9.41% |
| 9 | 0.83 | 4.76% | 23 ms | 4.77% | 0.79 | 2.38% | 48 ms | 6.23% |
| 10 | 0.87 | 5.62% | 42 ms | 6.64% | 0.76 | 3.56% | 70 ms | 5.46% |
| Mean | 0.89 | 4.59% | 31 ms | 7.22% | 0.86 | 3.69% | 56 ms | 5.38% |
| Max | 0.97 | 11.31% | 45 ms | 11.15% | 0.99 | 8.07% | 80 ms | 9.41% |
Figure 8.
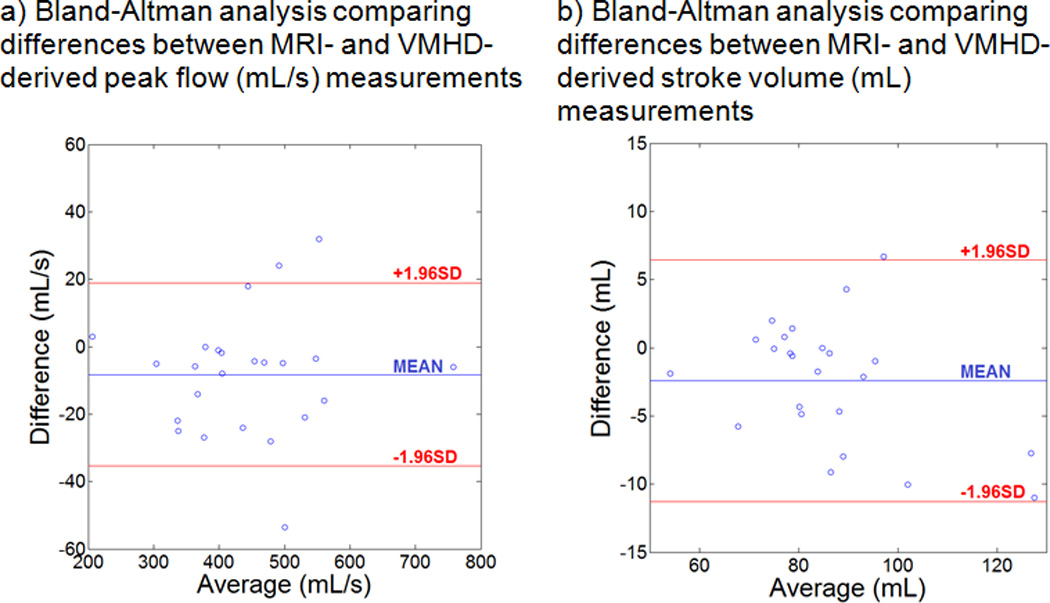
Bland-Altman Analysis for Peak Flow and SV estimation. The vertical axis depicts the differences between VMHD- and MRI- derived measurements, and the horizontal axis depicts the mean value for each subject. The three plotted lines depict upper and lower limits of agreement (red) and the average (blue).
DISCUSSION
Major findings of this study are the development and validation of a method for non-invasive beat-to-beat stroke volume and blood-flow estimation using MHD voltages extracted from 12-lead ECGs. This provides a means for enhanced patient monitoring inside the MRI bore, requiring only a relatively short cine PCMR calibration scan (~20 seconds) in order to provide the required patient-specific parameters prior to continuous monitoring for the entire duration of a subject’s stay in the MRI bore.
An average error of 7.22% and 5.38% in VMHDVCG-derived SV estimation, respectively, as compared to the RTPC cine estimate was found during peak stress, and after the full relaxation. In the future, PCMR pre-scans employed to train an active Kalman filter for VMHDVCG-derived estimates could potentially result in a further increase in accuracy in BFMHD and SVMHD estimates. Average BF waveform correlation between the PCMR and MHD methods decreased after full relaxation from 0.89 to 0.86. VMHDVCG-derived estimates were shown to maintain an average error of <8% in all cases, with a marginal decrease in accuracy after full relaxation.
Beat-to-beat BFMHD has a temporal resolution of 5ms, based on the low-pass frequency used in the ECG monitor (200 Hz) from which MHD signals were extracted, as compared to the 40 ms temporal resolution of the RTPC sequence used for the BF measurements. Furthermore, use of MRI for continuous monitoring of SV is impractical due to the need to employ the scanner to image additional contrasts or other regions of the heart.
VMHD-derived SV was able to detect a change in SV during the arrhythmic beat of a patient diagnosed with PVCs. A decrease in SV of 18.8% was observed in the arrhythmic beat as compared to the healthy beat.
The presented flow and SV estimation methods provide real-time beat-to-beat monitoring, independent from scanner manufacturer of model, and does not require any additional MRI hardware development, providing a rapid method of assessing flow velocity and SV “for free” in a conventional cardiac MRI routine.
Limitations
The method was only validated in a limited number of subjects. A larger patient population will be required to fully validate the method used to transform VMHDVCG into blood-flow, beyond the presented exercise stress study, as well as to further evaluate method reproducibility and repeatability. In addition, the real ECG (ECGreal) signal was assumed to experience only minimal changes in amplitude and frequency during the training phase of the proposed method, allowing the approximation of ECGreal within the MRI bore, based on prior knowledge of ECGreal obtained outside the MRI bore. This assumption may not always be valid.
The limited availability of MRI-conditional 12-lead ECG recording systems may affect the prevalence of the presented method outside of a research setting, however the topic of acquiring ECGs during MRI scanning has been well studied in hardware22 and software based approaches33–38. In cases of low repetition time or where MRI pulse sequence timing/readout may be a limitation, continuous time methods of gradient removal may be employed which rely on a short training phase and knowledge of the gradient waveform and timing employed during the scan sequence37, 38. Further studies must be performed to investigate the feasibility of using this method in 4-lead ECG recording systems, available in the majority of MRI scanner suites and MRI-conditional ECG monitoring systems.
The presented pilot research shows promising results in the voluntary study of 10 healthy subjects and 1 patient diagnosed with PVCs. Further study with a large population of patients is required in the future to evaluate the clinical impact of this work as well as to further optimize the current method to be accepted in a routine MRI workflow.
CONCLUSION
VMHDVCG-derived SV and blood-flow estimates allow for accurate, non-invasive, real-time cardiovascular monitoring during MRI-guided surgical procedures and interventions, leaving the scanner free to perform other imaging tasks. This method could be integrated into the clinical workflow, and installed into existing ECG recording systems, requiring a simple software upgrade.
Supplementary Material
Clinical Perspective.
Magnetic Resonance Imaging (MRI) is increasingly becoming the preferred diagnostic and interventional imaging modality for a variety of diseases; commonly requested for acute stroke, acute-spine, orthopedic, trauma, and cardiovascular diseases. The number of MRI-guided interventional procedures performed is growing steadily. Despite the increasing clinical merit, practical implementation of these procedures in the clinic is oftentimes limited due to the high risk associated with these patient groups and the subsequent need for advanced real-time physiological monitoring for each high-risk patient to be cleared for imaging and interventional workflows inside the MRI. In the course of MRI-guided interventions, sedated or anesthetized patients lie in the MRI for 2–8 hours. The risk of an acute event is larger than with conventional MR procedures, so high-fidelity physiological monitoring is required as an essential component of life support. Currently real-time high-fidelity hemodynamic monitoring, such as aortic blood flow and left ventricular stroke volume (SV), is rarely available in MRI procedures. As a result, severally ill patients with stroke and ischemic histories and those being intubated are excluded from MRI-guided interventions, including from minor procedures, such as biopsies. The presented method for beat-to-beat SV and continuous aortic flow monitoring within the MRI bore based on Magnetohydrodynamic Voltages (VMHD) induced onto 12-lead Electrocardiograms (ECG), enables MR imaging and MRI-guided interventional procedures to be performed in severely ill patients who require high fidelity real-time hemodynamic monitoring.
Acknowledgments
SOURCES OF FUNDING
NIH R03 EB013873-01A1
Footnotes
DISCLOSURES
None.
REFERENCES
- 1.Weissler AM, Peeler RG, Roehll WH., Jr Relationships between left ventricular ejection time, stroke volume, and heart rate in normal individuals and patients with cardiovascular disease. American heart journal. 1961;62:367–378. doi: 10.1016/0002-8703(61)90403-3. [DOI] [PubMed] [Google Scholar]
- 2.Zile MR, Brutsaert DL. New concepts in diastolic dysfunction and diastolic heart failure: Part I diagnosis, prognosis, and measurements of diastolic function. Circulation. 2002;105:1387–1393. doi: 10.1161/hc1102.105289. [DOI] [PubMed] [Google Scholar]
- 3.Tsang TS, Gersh BJ, Appleton CP, Tajik AJ, Barnes ME, Bailey KR, Oh JK, Leibson C, Montgomery SC, Seward JB. Left ventricular diastolic dysfunction as a predictor of the first diagnosed nonvalvular atrial fibrillation in 840 elderly men and women. J Am Coll Cardiol. 2002;40:1636–1644. doi: 10.1016/s0735-1097(02)02373-2. [DOI] [PubMed] [Google Scholar]
- 4.Dodge HT, Baxley WA. Left ventricular volume and mass and their significance in heart disease. The American Journal of Cardiology. 1969;23:528–537. doi: 10.1016/0002-9149(69)90006-x. [DOI] [PubMed] [Google Scholar]
- 5.Dwyer EM. Left ventricular pressure-volume alterations and regional disorders of contraction during myocardial ischemia induced by atrial pacing. Circulation. 1970;42:1111–1122. doi: 10.1161/01.cir.42.6.1111. [DOI] [PubMed] [Google Scholar]
- 6.Schiller NB, Shah P, Crawford M, DeMaria A, Devereux R, Feigenbaum H, Gutgesell H, Reichek N, Sahn D, Schnittger I. Recommendations for quantitation of the left ventricle by two-dimensional echocardiography. American Society of Echocardiography Committee on Standards, Subcommittee on Quantitation of Two-Dimensional Echocardiograms. Journal of the American Society of Echocardiography: official publication of the American Society of Echocardiography. 1988;2:358–367. doi: 10.1016/s0894-7317(89)80014-8. [DOI] [PubMed] [Google Scholar]
- 7.Shiota T, Jones M, Chikada M, Fleishman CE, Castelluci JB, Cotter B, DeMaria AN, von Ramm OT, Kisslo J, Ryan T, Sahn DJ. Real-time Three-dimensional Echocardiography for Determining Right Ventricular Stroke Volume in an Animal Model of Chronic Right Ventricular Volume Overload. Circulation. 1998;97:1897–1900. doi: 10.1161/01.cir.97.19.1897. [DOI] [PubMed] [Google Scholar]
- 8.Colocousis JS, Huntsman LL, Curreri PW. Estimation of stroke volume changes by ultrasonic doppler. Circulation. 1977;56:914–917. doi: 10.1161/01.cir.56.6.914. [DOI] [PubMed] [Google Scholar]
- 9.McKay RG, Spears JR, Aroesty JM, Baim DS, Royal HD, Heller GV, Lincoln W, Salo RW, Braunwald E, Grossman W. Instantaneous measurement of left and right ventricular stroke volume and pressure-volume relationships wiht an impedance catheter. Circulation. 1984;69:703–710. doi: 10.1161/01.cir.69.4.703. [DOI] [PubMed] [Google Scholar]
- 10.Srichai MB, Lim RP, Wong S, Lee VS. Cardiovascular applications of phase-contrast MRI. Am J Roentgenol. 2009;192:662–675. doi: 10.2214/AJR.07.3744. [DOI] [PubMed] [Google Scholar]
- 11.Kondo C, Caputo G, Semelka R, Foster E, Shimakawa A, Higgins C. Right and left ventricular stroke volume measurements with velocity-encoded cine MR imaging: in vitro and in vivo validation. AJR American journal of roentgenology. 1991;157:9–16. doi: 10.2214/ajr.157.1.2048544. [DOI] [PubMed] [Google Scholar]
- 12.Abi-Abdallah D, Robin V, Drochon A, Fokapu O. Alterations in human ECG due to the MagnetoHydroDynamic effect: a method for accurate R peak detection in the presence of high MHD artifacts; Conference proceedings : Annual International Conference of the IEEE Engineering in Medicine and Biology Society IEEE Engineering in Medicine and Biology Society Conference; 2007. pp. 1842–1845. [DOI] [PubMed] [Google Scholar]
- 13.Birkholz T, Schmid M, Nimsky C, Schuttler J, Schmitz B. ECG artifacts during intraoperative high-field MRI scanning. Journal of neurosurgical anesthesiology. 2004;16:271–276. doi: 10.1097/00008506-200410000-00002. [DOI] [PubMed] [Google Scholar]
- 14.Jekie M, Dzwonczyk R, Ding S, Raman V, Simonetti O. Quantitative evaluation of magnetohydrodynamic effects on the electrocardiogram. Proc Intl Soc Mag Reson Med. 2009;17:3795. [Google Scholar]
- 15.Gupta A, Weeks AR, Richie SM. Simulation of elevated T-waves of an ECG inside a static magnetic field (MRI) IEEE transactions on bio-medical engineering. 2008;55:1890–1896. doi: 10.1109/TBME.2008.919868. [DOI] [PubMed] [Google Scholar]
- 16.Gregory TS, Schmidt EJ, Zhang SH, Tse ZTH. 3DQRS: A method to obtain reliable QRS complex detection within high field MRI using 12-lead electrocardiogram traces. Magnet Reson Med. 2014;71:1374–1380. doi: 10.1002/mrm.25078. [DOI] [PMC free article] [PubMed] [Google Scholar]
- 17.Gregory TS, Schmidt EJ, Zhang SH, Kwong RY, Stevenson WG, Murrow JR, Tse ZTH. Left-Ventricular Mechanical Activation and Aortic-Arch Orientation Recovered from Magneto-Hydrodynamic Voltages Observed in 12-Lead ECGs Obtained Inside MRIs: A Feasibility Study. Annals of biomedical engineering. 2014;42:2480–2489. doi: 10.1007/s10439-014-1109-2. [DOI] [PMC free article] [PubMed] [Google Scholar]
- 18.Kännälä S, Toivo T, Alanko T, Jokela K. Occupational exposure measurements of static and pulsed gradient magnetic fields in the vicinity of MRI scanners. Physics in medicine and biology. 2009;54:2243–2257. doi: 10.1088/0031-9155/54/7/026. [DOI] [PubMed] [Google Scholar]
- 19.Healthcare S. Siemens Magnetom Skyra. 2015;2015 [Google Scholar]
- 20.Tse Z, Dumoulin G, Clifford G, Jerosch-Herold M, Kacher D, Kwong R, Stevenson W, Schmidt E. Real-ECG extraction and stroke volume from MR-Compatible 12-Lead ECGs testing during stress, in PVC and in AF patients. Journal of Cardiovascular Magnetic Resonance. 2011;13:6. [Google Scholar]
- 21.Tse Z, Dumoulin C, Clifford G, Jerosch-Herold M, Kacher D, Kwong R, Stevenson W, Schmidt E. MRI-compatible 12-lead ECGs with MHD separation: application to cardiac MRI gating, physiological monitoring and noninvasive cardiac-output estimation. Proc 18th Annual Meeting ISMRM; Stockholm. 2010. p. 286. [Google Scholar]
- 22.Tse Z, Dumoulin CL, Clifford GD, Schweitzer J, Qin L, Oster J, Jerosch-Herold M, Kwong RY, Michaud G, Stevenson WG, Schmidt EJ. A 1.5T MRI-conditional 12-lead electrocardiogram for MRI and intra-MR intervention. Magnetic resonance in medicine : official journal of the Society of Magnetic Resonance in Medicine / Society of Magnetic Resonance in Medicine. 2013;71:1336–1347. doi: 10.1002/mrm.24744. [DOI] [PMC free article] [PubMed] [Google Scholar]
- 23.Grishman A, Scherlis L, Lasser RP. Spatial vectorcardiography. The American Journal of Medicine. 1953;14:184–200. doi: 10.1016/0002-9343(53)90018-7. [DOI] [PubMed] [Google Scholar]
- 24.Dower GE. The ECGD - a Derivation of the ECG from VCG Leads. Journal of electrocardiology. 1984;17:189–191. doi: 10.1016/s0022-0736(84)81094-8. [DOI] [PubMed] [Google Scholar]
- 25.Kligfield P, Gettes LS, Bailey JJ, Childers R, Deal BJ, Hancock EW, van Herpen G, Kors JA, Macfarlane P, Mirvis DM. Recommendations for the standardization and interpretation of the electrocardiogram: part I: the electrocardiogram and its technology a scientific statement from the American Heart Association Electrocardiography and Arrhythmias Committee, Council on Clinical Cardiology; the American College of Cardiology Foundation; the Heart Rhythm Society endorsed by the International Society for Computerized Electrocardiology. J Am Coll Cardiol. 2007;49:1109–1127. doi: 10.1016/j.jacc.2007.01.024. [DOI] [PubMed] [Google Scholar]
- 26.Heiberg E, Markenroth K, Arheden H. Validation of free software for automated vessel delineation and MRI flow analysis. Journal of Cardiovascular Magnetic Resonance. 2007;9:375. [Google Scholar]
- 27.Heiberg E, Sjögren J, Ugander M, Carlsson M, Engblom H, Arheden H. Design and validation of Segment-freely available software for cardiovascular image analysis. BioMedCentral Medical Imaging. 2010;10:1. doi: 10.1186/1471-2342-10-1. [DOI] [PMC free article] [PubMed] [Google Scholar]
- 28.Woodson WE, Tillman B, Tillman P. Human factors design handbook: information and guidelines for the design of systems, facilities, equipment, and products for human use. McGraw-Hill: 1992. [Google Scholar]
- 29.Tilley AR. The Measure of Man and Woman: Human Factors in Design. New York: H.D. Associates; 1993. [Google Scholar]
- 30.Bouchard A, Blumlein S, Schiller NB, Schlitt S, Byrd BF, Ports T, Chatterjee K. Measurement of left ventricular stroke volume using continuous wave Doppler echocardiography of the ascending aorta and M-mode echocardiography of the aortic valve. J Am Coll Cardiol. 1987;9:75–83. doi: 10.1016/s0735-1097(87)80085-2. [DOI] [PubMed] [Google Scholar]
- 31.Bland JM, Altman D. Statistical methods for assessing agreement between two methods of clinical measurement. The lancet. 1986;327:307–310. [PubMed] [Google Scholar]
- 32.Bland JM, Altman DG. Measuring agreement in method comparison studies. Statistical methods in medical research. 1999;8:135–160. doi: 10.1177/096228029900800204. [DOI] [PubMed] [Google Scholar]
- 33.Abächerli R, Pasquier C, Odille F, Kraemer M, Schmid J-J, Felblinger J. Suppression of MR gradient artefacts on electrophysiological signals based on an adaptive real-time filter with LMS coefficient updates. Magnetic Resonance Materials in Physics, Biology and Medicine. 2005;18:41–50. doi: 10.1007/s10334-004-0093-1. [DOI] [PubMed] [Google Scholar]
- 34.Sansone M, Mirarchi L, Bracale M. Adaptive removal of gradients-induced artefacts on ECG in MRI: a performance analysis of RLS filtering. Medical & biological engineering & computing. 2010;48:475–482. doi: 10.1007/s11517-010-0596-z. [DOI] [PubMed] [Google Scholar]
- 35.Sijbersa J, Van Audekerke J, Verhoye M, Van der Linden A, Van Dyck D. Reduction of ECG and gradient related artifacts in simultaneously recorded human EEG/MRI data. Magnetic resonance imaging. 2000;18:881–886. doi: 10.1016/s0730-725x(00)00178-8. [DOI] [PubMed] [Google Scholar]
- 36.Odille F, Pasquier C, Abächerli R, Vuissoz P-A, Zientara GP, Felblinger J. Noise cancellation signal processing method and computer system for improved real-time electrocardiogram artifact correction during MRI data acquisition. Biomedical Engineering, IEEE Transactions on. 2007;54:630–640. doi: 10.1109/TBME.2006.889174. [DOI] [PubMed] [Google Scholar]
- 37.Zhang SH, Tse ZTH, Dumoulin CL, Kwong RY, Stevenson WG, Watkins R, Ward J, Wang W, Schmidt EJ. Gradient-induced voltages on 12-lead ECGs during high duty-cycle MRI sequences and a method for their removal considering linear and concomitant gradient terms. Magnet Reson Med. 2015 doi: 10.1002/mrm.25810. [DOI] [PMC free article] [PubMed] [Google Scholar]
- 38.Zhang SH, Zion TT, Wang W, Kwong RY, Dumoulin CL, Schmidt EJ. Computation of the gradient-induced electric field noise in 12-lead ECG traces during rapid MRI sequences. Journal of Cardiovascular Magnetic Resonance. 2014;16:P151. [Google Scholar]
Associated Data
This section collects any data citations, data availability statements, or supplementary materials included in this article.


