Abstract
The ascending thin limbs (ATLs) and lower descending thin limbs (DTLs) of Henle's loop in the inner medulla of the rat are highly permeable to urea, and yet no urea transporters have been identified in these sections. We hypothesized that novel, yet-unidentified transporters in these tubule segments could explain the high urea permeability. cDNAs encoding for Na+-glucose transporter 1a (SGLT1a), Na+-glucose transporter 1 (NaGLT1), urea transporter (UT)-A2c, and UT-A2d were isolated and cloned from the Munich-Wistar rat inner medulla. SGLT1a is a novel NH2-terminal truncated variant of SGLT1. NaGLT1 is a Na+-dependent glucose transporter primarily located in the proximal tubules and not previously described in the thin limbs. UT-A2c and UT-A2d are novel variants of UT-A2. UT-A2c is truncated at the COOH terminus, and UT-A2d has one exon skipped. When rats underwent water restriction for 72 h, mRNA levels of SGLT1a increased in ATLs, NaGLT1 levels increased in both ATLs and DTLs, and UT-A2c increased in ATLs. [14C]urea uptake assays performed on Xenopus oocytes heterologously expressing these proteins revealed that despite having structural differences from their full-length versions, SGLT1a, UT-A2c, and UT-A2d enhanced urea uptake. NaGLT1 also facilitated urea uptake. Uptakes were Na+ independent and inhibitable by phloretin and/or phloridzin. Our data indicate that there are several alternative channels for urea in the rat inner medulla that could potentially contribute to the high urea permeabilities in thin limb segments.
Keywords: urea transport, thin limbs of Henle's loop, gene expression, Xenopus oocytes
to conserve water, mammals produce urine that is hyperosmotic to their plasma. This process of urine concentration involves the generation of an osmotic gradient in the renal medulla that increases from the corticomedullary boundary to the inner medullary tip. Within the inner medulla (IM), the ascending thin limbs (ATLs) and descending thin limbs (DTLs) of Henle's loop as well as collecting ducts and the vasa recta contribute to this osmotic gradient, with NaCl and urea playing important roles. It remains unclear how all these components integrate and contribute to the urine concentration mechanism in the IM, and several hypotheses exist (7, 35, 38). However, the importance of urea and its accumulation in the IM for water conservation has been long established (6, 10, 24).
Originally thought to permeate through membranes by passive diffusion, we now know that there are specific transporters for urea in the kidney. Urea transporters (UTs) are phloretin-sensitive channels that transport urea down its concentration gradient, and several isoforms have been identified (for a review, see Ref. 37). The structure of the UT has also been recently solved for the bacterium Desulfovibrio vulgaris (dvUT) and the bovine UT-B (21, 22, 23). Urea permeability is very high in ATLs and lower DTLs of the chinchilla (4, 5) as well as the rat IM (31); however, no UTs have been identified in these tubule segments. One UT isoform, UT-A2, has been detected in thin limbs but only in upper DTLs near the outer medullary-inner medullary border (16, 26).
Leung et al. (20) reported that several cotransporters, including rabbit Na+-glucose transporter (SGLT)1, the rat Na+-iodide cotransporter, human Na+-Cl−-GABA transporter 1, and pig low-affinity SGLT3 are capable of transporting urea, albeit with a flux rate lower than that of UTs. Several aquaporins (AQPs; AQP3, AQP7, AQP9, and AQP10) have also been shown to transport urea (25, 36). The physiological significance of these multifunctional transporters is unknown, but it is plausible that they could assume roles as urea channels when they are expressed in cells where no UTs are present.
With this idea of transporter multifunctionality in mind, our objective was to identify and characterize transporters in the rat IM that could potentially contribute to the high urea permeability of thin limb segments. We identified and cloned a variety of transporters in the IM: Na+-glucose transporter 1 (NaGLT1), a variant of SGLT1 (SGLT1a), and two variants of UT-A2 (UT-A2c and UT-A2d). We then measured mRNA levels of these transporters in ATLs and DTLs of rats that underwent 72 h of water restriction. Finally, to test whether or not these transcripts code for functional proteins that could transport urea, we expressed these proteins in Xenopus oocytes and performed [14C]urea uptake assays.
METHODS
Animals.
Male Munich-Wistar rats (∼90 days old, 278–392 g) were reared in the University Animal Care facility at the University of Arizona (Tucson, AZ). Control rats were provided with rat chow (Tekland 7001) and water ad libitum. Water-restricted rats were provided with rat chow ad libitum and water that was reduced to 40% of the normal daily intake for 72 h. Animals were euthanized with CO2. All experiments were conducted in accordance with the National Institutes of Health Guide for the Care and Use of Laboratory Animals (1996) and were approved by the Institutional Animal Care and Use Committee of the University of Arizona.
Plasma and urine osmolality.
Blood was collected by cardiac puncture into a heparinized syringe after euthanasia. Plasma was isolated from whole blood by centrifugation at 2,500 g for 10 min. Urine was collected postvoid before euthanasia. Plasma and urine osmolalities were measured on a Wescor vapor pressure osmometer (ELITech Biomedical Systems, Logan, UT).
RNA isolation.
Total RNA from the whole IM was extracted with TRIzol (Life Technologies, Austin, TX), and concentrations were quantified on a NanoDrop Lite spectrophotometer (Nanodrop Technologies, Wilmington, DE). First-strand cDNA was synthesized with 1 μg DNaseI-treated (Life Technologies) total RNA, an oligo(dT17) primer, and Superscript II reverse transcriptase (Life Technologies). For isolated tubules, ∼10 tubules of varying lengths of ATLs and DTLs were isolated from the IM, pooled directly into TRIzol, and then processed as described above using 400 ng total RNA. ATLs and DTLs were distinguished by morphology as previously described (31).
cDNA cloning.
A 5′-variant of SGLT1 (SGLT1a) was obtained by 5′-rapid amplification of cDNA ends (RACE) using SGLT1-specific primers (outer: 5′-CAGGAAGCCGAGAATCAGTC-3′ and inner: 5′-GTCCATGGTGAAGAGAGTAC-3′) with 5′-adapter-ligated cDNA. A 3′-variant of UT-A2 (UT-A2c) was obtained by 3′-RACE using primers specific for UT-A2 (outer: 5′-ACCTGAACACCATGGAGGAG-3′ and inner: 5′-AGATGTCCAAGTGCCTTTGC-3′) and 3′-adapter-ligated cDNA. RACE reactions were performed with a FirstChoice RLM RACE kit (Life Technologies). In the course of our cloning procedures, we also isolated a splice variant of UT-A2 missing one exon, which we designated as UT-A2d. Sequence analyses were performed with BioEdit (13) and CLUSTAL W (44). Hydropathy profile predictions were made using TMHMM (18).
mRNA expression.
Quantitative real-time PCR was performed on the cDNA described above using the primers shown in Table 1. mRNA levels of NaGLT1, SGLT1a, UT-A1, UT-A2, UT-A2c, and UT-A2d were assessed in the whole IM. ATLs and DTLs were analyzed for mRNA expression of the Cl− channel (ClC-K1), NaGLT1, SGLT1a, UT-A2, UT-A2c, and UT-A2d. Analyses were performed with SYBR Select Master Mix for CFX (Life Technologies) on a Bio-Rad CFX96 Real-Time system (Bio-Rad Laboratories, Hercules, CA). Melt-curve analysis confirmed the production of a single product and the absence of genomic DNA contamination. No-template controls were run in parallel. Values were extrapolated from standard curves generated by serial dilution of one random IM sample. For whole IM samples, β-actin expression was used for normalization; for ATLs and DTLs, cyclophilin A was used. Primer sets were validated by sequencing of products.
Table 1.
Primers used for cloning and qPCR
| Primers |
||||
|---|---|---|---|---|
| Name | Forward | Reverse (5′-3′) | Application | GenBank Accession Number |
| NaGLT1 | 5′-CTTTGTCTGGAGCCACCAAG-3′ | 5′-GCACGTGCTTTCACACCTTT-3′ | Cloning | AB089802 |
| SGLT1a | 5′-AGCAGAGCTCCCAGATGTTG-3′ | 5′-ATAACAACTCCAGAGTCGCC-3′ | Cloning | KT598255 |
| UT-A2/UT-A2d | 5′-TCGGGCATAGGAGACTTCAC-3′ | 5′-GAGGCTGCATTTACCAGACG-3′ | Cloning | NM_001110270 |
| UT-A2c | 5′-GAGAGACAAACCAAAGAGCC-3′ | 5′-ATTTTGTTTCCATTCCACAGGC-3′ | Cloning | KT598256 |
| NaGLT1 | 5′-CTGCTCTTCCAAAGGTCCTG-3′ | 5′-TCGCTGTCTTCAGACACACC-3′ | qPCR | AB089802 |
| SGLT1a | 5′-ACAAAATCGCCTGTGTCCTC-3′ | 5′-TCAGCACGAGGATGAACAAC-3′ | qPCR | KT598255 |
| UT-A1 | 5′-TCCTTCTCCTCACAAGCAAC-3′ | 5′-TCCTCCGTGTGAGTGTTCTC-3′ | qPCR | NM_019347 |
| UT-A2 | 5′-AGATGTCCAAGTGCCTTTGC-3′ | 5′-GGCCAGAGTGCTATTGAAGC-3′ | qPCR | NM_001110270 |
| UT-A2c | 5′-TGACTCCATCTACTTTGGCC-3′ | 5′-CAGAAAGAGTTTTATTTTGTTTCCATT-3′ | qPCR | KT598256 |
| UT-A2d | 5′-GCTCATCAAAGCCACGCTAG-3′ | 5′-GCTTCTGAGAGACAAACCAA-3′ | qPCR | KT598257 |
| ClC-K1 | 5′-TGGGGAAACTGAGAACAAGG-3′ | 5′-ATGGAGGTGATGGTCTCCTG-3′ | qPCR | NM_053327 |
| β-Actin | 5′-AGCCATGTACGTAGCCATCC-3′ | 5′-TCTCAGCTGTGGTGGTGAAG-3′ | qPCR | NM_031144 |
| Cyclophilin A | 5′-CGAGCTGTTTGCAGACAAAG-3′ | 5′-AGATGCCAGGACCTGTATGC-3′ | qPCR | NM_017101 |
qPCR, quantitative real-time PCR; NaGLT1 and SGLT1a are Na+-dependent glucose transporters; UT, urea transporter; ClC-K1, Cl− channel.
Xenopus oocyte expression experiments.
All chemicals and reagents were obtained from Sigma-Aldrich (St. Louis, MO) unless otherwise noted. The standard oocyte incubation medium was ND96 containing (in mmol/l) 96 NaCl, 2 KCl, 1.8 CaCl2, 1 MgCl2, and 5 HEPES (pH 7.4). Sterile ND96 for long-term storage of oocytes contained 2.5 mmol/l sodium pyruvate and 1 mg/ml penicillin-streptomycin. Na+-free ND96 contained 96 mmol/l N-methyl-d-glucamine in the place of NaCl.
Plasmid constructs and cRNA synthesis.
Total RNA extraction and cDNA synthesis were performed as described above for the whole IM. Full-length cDNAs were amplified with Platinum Taq DNA polymerase high fidelity (Life Technologies) using primers flanking the coding region of each gene (Table 1). Sequences were verified after cloning into pGEM T-easy vector (Promega, Madison, WI) or pJet vector (Thermo Scientific, Waltham, MA). cDNAs were then subcloned into the XhoI and XbaI restriction sites or the EcoRI and SpeI restriction sites of pTNT vector (Promega). In-frame insertion of cDNAs was confirmed by sequencing. Constructs were then transcribed and capped (Promega) in vitro with T7 RNA polymerase (Thermo Scientific). The resulting cRNAs were purified by LiCl precipitation, quantified spectrophotometrically (NanoDrop Lite), and assessed for quality on a denaturing formamide gel.
Preparation of oocytes.
Stage V–VI oocytes were isolated from extracted Xenopus ovaries (Nasco, Fort Atkinson, WI) following an established protocol (3). Briefly, ovarian tissue was placed in Ca2+-free ND96 solution containing collagenase (1 mg/ml) and gently agitated for 45 min. Oocytes were then rinsed three times in Ca2+-free ND96 and three times with ND96, and follicles were removed manually. Oocytes were then allowed to recover for several hours at 18–20°C in sterile ND96.
Injection of oocytes.
Oocytes were injected with ∼50 ng cRNA using a Nanoliter 2010 Injector (World Precision Instruments, Sarasota, FL). Control oocytes were injected with ∼50 nl of RNase-free H2O. Experiments were performed 2–5 days postinjection.
Urea uptake assays.
To measure urea uptake, 2 μCi/ml [14C]urea (American Radiolabeled Chemicals, St. Louis, MO, specific activity: 58 mCi/mmol) was added to the incubation media (ND96 or Na+-free ND96) with a final urea concentration of 1 mM (unless otherwise stated) at 23°C. After the uptake period, oocytes were washed in ice-cold unlabeled uptake solution and dissolved in 5% SDS, and radioactivity was measured by scintillation counting. For inhibition experiments, freshly prepared phloretin or phloridzin was added to the uptake medium. Experiments were repeated on at least three different batches of oocytes.
Statistical analysis.
Data are presented as means ± SE; n is the number of samples or oocytes. The statistical difference between control and experimental samples was assessed by an Student's unpaired t-test. Tests were two tailed, and a significance level of 0.05 was used throughout.
RESULTS
Osmolality.
Water restriction resulted in an increase in urine osmolality of ∼1.8-fold, from 1429 mosmol/kg H2O (control) to 2,576 mosmol/kg H2O after 72 h. Plasma osmolality remained stable in control and water-restricted rats, ranging from 305 to 312 mosmol/kg H2O (Table 2).
Table 2.
Plasma and urine osmolalities of rats before and after water restriction
| Control, mosmol/kg H2O | After 72 h of Water Restriction, mosmol/kg H2O | |
|---|---|---|
| Plasma | 305 ± 3 | 312 ± 2 |
| Urine | 1,429 ± 85 | 2,576 ± 67 |
Data are means ± SE; n = 6–8.
Identification of transcripts.
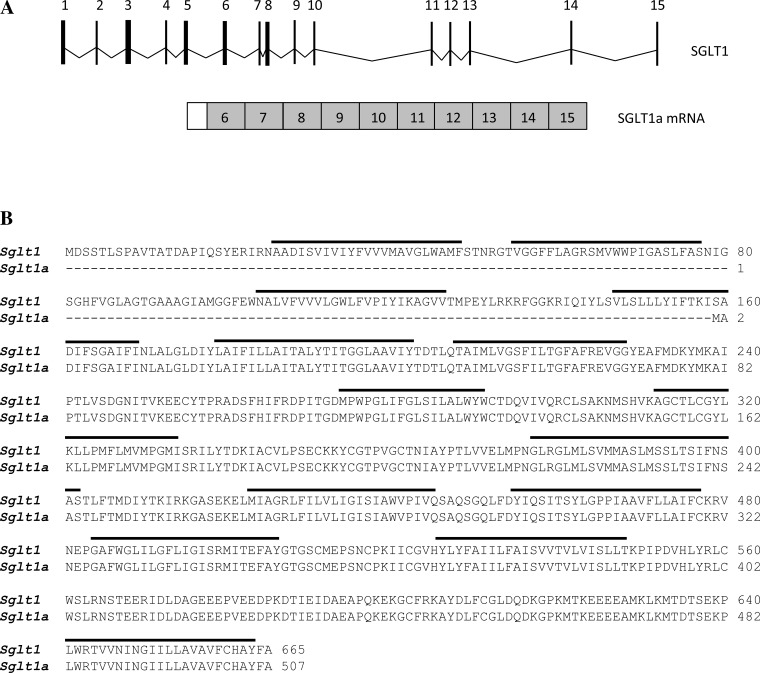
We isolated a variant of SGLT1 in the IM with an open reading frame of 1,821 bp, encoding for a protein 507 amino acids long, and designated it as SGLT1a (GenBank Accession No. KT598255). The first five exons of full-length SGLT1 are skipped in SGLT1a, and part of intron 5 is spliced on to the NH2 terminus of exon 6 (Fig. 1A). Hydropathy analysis predicted that the first three and part of the fourth transmembrane domains of full-length SGLT1 would be missing in truncated SGLT1a (Fig. 1B).
Fig. 1.
A: schematic of the Na+-glucose transporter (SGLT)1 gene showing all 15 exons (top) and mRNA of the splice variant SGLT1a (bottom). The first 5 exons of SGLT1 are skipped in SGLT1a, and part of intron 5 is spliced onto the COOH terminus of exon 6. B: amino acid alignment of SGLT1 and SGLT1a. Predicted transmembrane domains are indicated by thick horizontal lines.
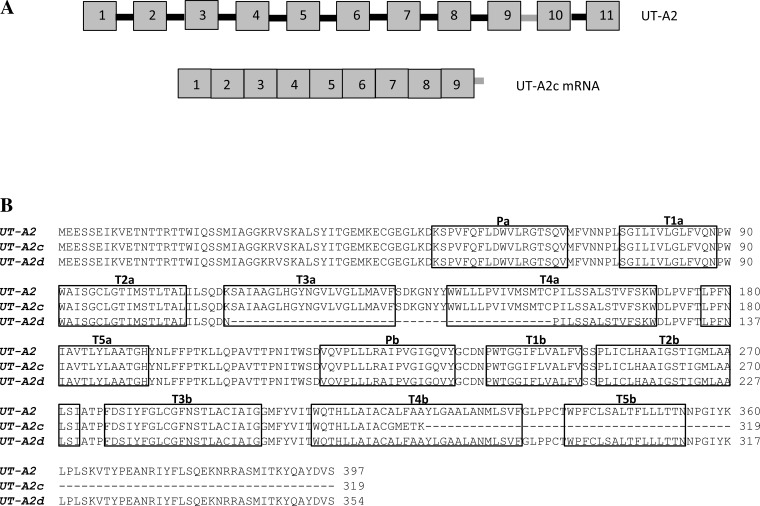
A truncated variant of UT-A2 (UT-A2c) with an open reading frame of 1,914 bp, encoding for a protein 320 amino acids long, was also identified (GenBank Accession No. KT598256). The last two exons of UT-A2 are skipped in UT-A2c, and part of intron 9 is retained and spliced onto the COOH terminus (Fig. 2A). We also isolated a variant of UT-A2 with the entire exon 6 spliced out (UT-A2d; GenBank Accession No. KT598257), resulting in a protein 354 amino acids long (Fig. 2B).
Fig. 2.
A: primary mRNA transcript of urea transporter (UT)-A2 (11 exons; top) and the mRNA transcript of UT-A2c (bottom). The last two exons of UT-A2 are skipped in UT-A2c, and part of intron 9 is spliced onto the COOH terminus. B: amino acid alignment of UT-A2, UT-A2c, and UT-A2d. Boxes indicate intramembrane helixes labeled according to the model of Levin et al. (22).
Full-length NaGLT1 was also identified and isolated from the IM.
mRNA expression.
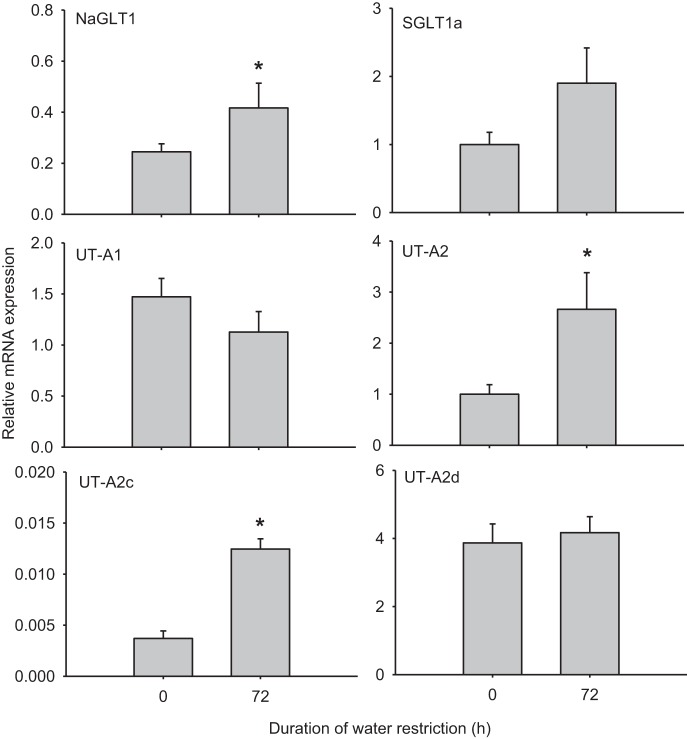
In the whole IM, mRNA levels of UT-A1 did not change after 72 h of water restriction, whereas UT-A2 levels increased by ∼2.7-fold (Fig. 3). This pattern of expression is in accordance with a previous report (1) that studied UT expression in water-deprived rats. After water restriction, NaGLT1 was upregulated by ∼2-fold and UT-A2c was upregulated by 3.5-fold, but SGLT1a and UT-A2d expression did not change significantly (Fig. 3 and Table 3).
Fig. 3.
Whole inner medullary mRNA expression in rats before and after 72 h of water restriction. All data were normalized to β-actin expression. Values are means ± SE; n = 6. *Significant difference between 0 and 72 h (P < 0.05).
Table 3.
Summary of mRNA expression changes in water-restricted rats
| Gene | Whole Inner Medulla | Ascending Thin Limbs | Descending Thin Limbs |
|---|---|---|---|
| NaGLT1 | ↑ | ↑ | ↑ |
| SGLT1a | no change | ↑ | no change |
| UT-A2 | ↑ | no change | ↑ |
| UT-A2c | ↑ | ↑ | no change |
| UT-A2d | no change | no change | no change |
The upward arrow indicates an upregulation of mRNA compared with levels in control (hydrated) rats.
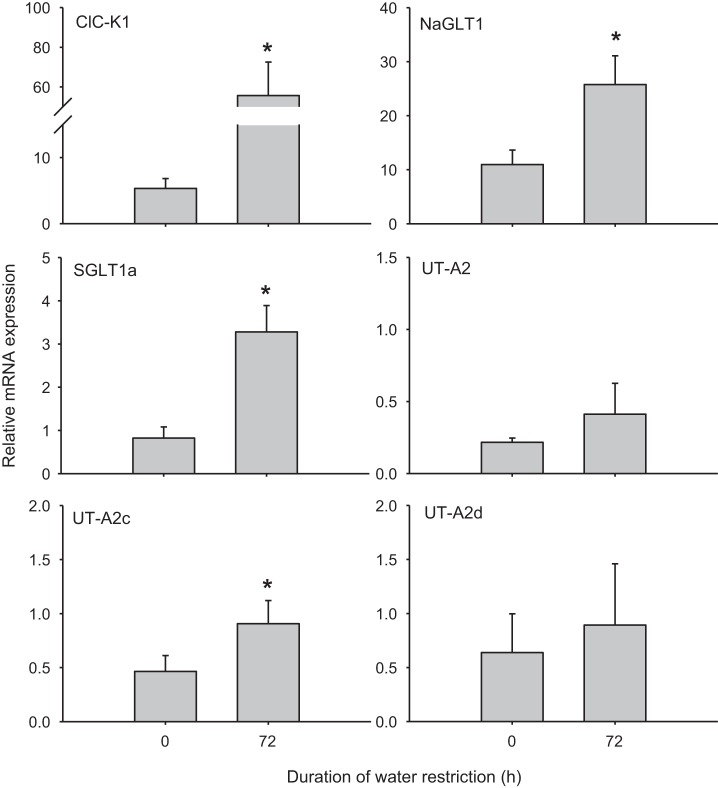
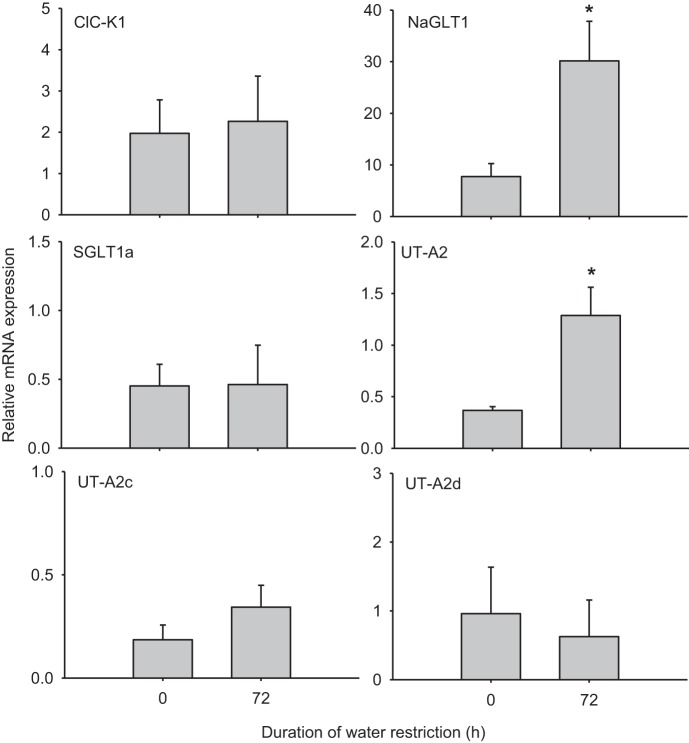
Although ATLs and DTLs were isolated and identified based on morphology, we also compared ClC-K1 mRNA levels to ensure separate populations of tubule types (cf. Ref. 31). The control mRNA level of ClC-K1 in ATLs was 2.5-fold higher than that in DTLs. After 72 h of water restriction, ClC-K1 expression increased by ∼10-fold in ATLs (Fig. 4) but did not change in DTLs (Fig. 5). In ATLs, NaGLT1 expression increased by 2-fold after 72 h of water restriction, whereas SGLT1a was upregulated by 4-fold and UT-A2c was ∼2-fold higher. UT-A2 and UT-A2d expression remained unchanged (Fig. 4 and Table 3). In DTLs, NaGLT1 expression was increased by almost 4-fold after water restriction and UT-A2 was upregulated by ∼3.5-fold. No changes, however, were seen in the transcript levels of SGLT1a, UT-A2c, or UT-A2d (Fig. 5 and Table 3).
Fig. 4.
mRNA expression in inner medullary ascending thin limbs in rats before and after 72 h of water restriction. All data were normalized to cyclophilin A expression. Values are means ± SE; n = 4–6 samples of pooled ascending thin limbs. *Significant difference between 0 and 72 h (P < 0.05).
Fig. 5.
mRNA expression in inner medullary descending thin limbs in rats before and after 72 h of water restriction. All data were normalized to cyclophilin A expression. Values are means ± SE; n = 4–6 samples of pooled descending thin limbs. *Significant difference between 0 and 72 h (P < 0.05).
[14C]urea uptake assays.
Both NaGLT1 and SGLT1a enhanced [14C]urea uptake into oocytes by ∼2-fold over water-injected control oocytes in Na+-free ND96 medium (Fig. 6). Similar uptake rates were observed in the presence of Na+ (data not shown). Treatment with phloretin (1 mM) or phloridzin (50 μM) reduced urea uptake via NaGLT1 and SGLT1a to levels not significantly different from water-injected control oocytes (Fig. 6).
Fig. 6.
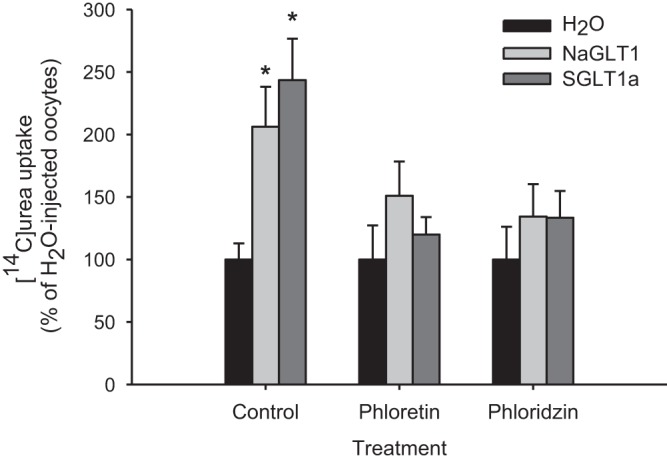
Functional analysis of Xenopus oocytes expressing NaGLT1 or SGLT1a. [14C]urea (1 mM) uptake rates in H2O-injected oocytes and those expressing NaGLT1 or SGLT1a under control conditions and after the addition of the inhibitors phloretin (1 mM) or phloridzin (50 μM) are shown. Uptakes were performed in Na+-free ND96 for 30 min. Values are means ± SE of 5–12 oocytes. *Significant difference from H2O-injected oocytes under control conditions (P < 0.05).
Oocytes injected with 15 or 25 ng UT-A2 cRNA enhanced urea uptake by almost 10-fold over water-injected control oocytes (Fig. 7). Injection of 35 ng UT-A2c cRNA with 15 ng UT-A2 cRNA or 25 ng each of UT-A2c and UT-A2 cRNA resulted in uptake rates not significantly different from those oocytes injected with 15 or 25 ng UT-A2 cRNA injected alone. UT-A2c cRNA injected alone enhanced urea uptake into oocytes by ∼3-fold (Fig. 8).
Fig. 7.
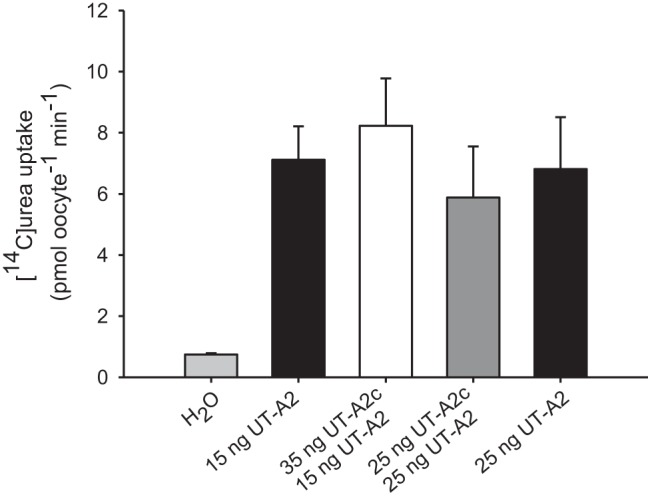
Functional analysis of Xenopus oocytes coinjected with UT-A2 and UT-A2c. [14C]urea (34 μM) uptake in oocytes injected with H2O, UT-A2 cRNA alone (15 or 25 ng), or UT-A2c cRNA coinjected with UT-A2 cRNA (35 ng UT-A2c with 15 ng UT-A2; 25 ng each of UT-A2c and UT-A2) is shown. Uptakes were performed in Na+-free ND96 for 30 min. Values are means ± SE of 4–6 oocytes.
Fig. 8.
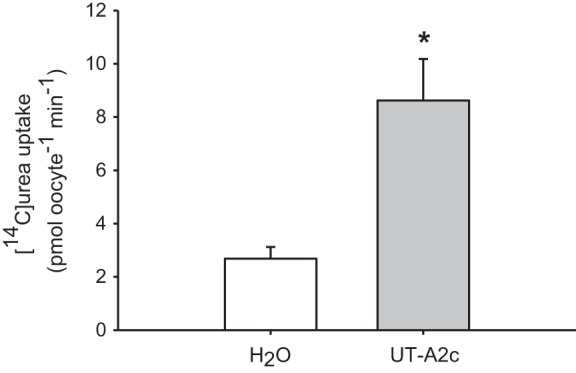
Functional analysis of Xenopus oocytes expressing UT-A2c. [14C]urea (1 mM) uptake of H2O-injected oocytes and those injected with UT-A2c cRNA is shown. Uptakes were performed in Na+-free ND96 for 30 min. Values are means ± SE of 6–7 oocytes. *Significant difference between the UT-A2c-injected oocytes and H2O-injected oocytes (P < 0.05).
UT-A2d enhanced urea uptake into oocytes by 3-fold in Na+-free ND96; in the presence of 0.7 mM phloretin, uptake was reduced to control levels (Fig. 9). Similar rates of uptake were observed in the presence of Na+ (data not shown).
Fig. 9.
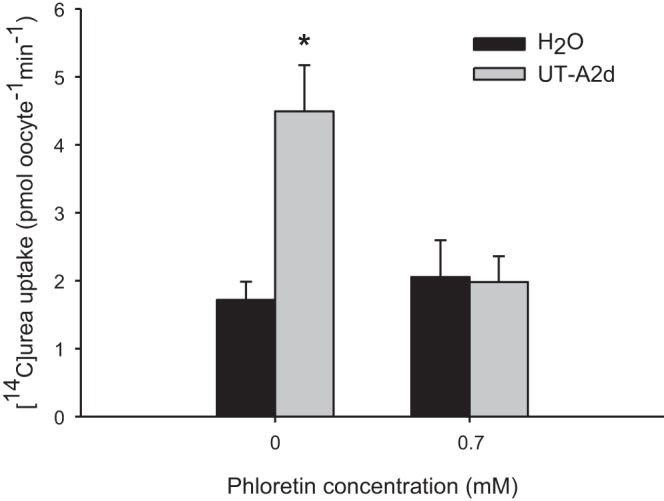
Functional analysis of Xenopus oocytes expressing UT-A2d. [14C]urea (1 mM) uptake rates in H2O-injected oocytes and those injected with UT-A2d cRNA under control conditions and after the addition of 0.7 mM phloretin in Na+-free ND96 for 30 min is shown. Values are means ± SE of 7–9 oocytes. *Significant difference between UT-A2d-injected oocytes and H2O-injected oocytes.
DISCUSSION
Many transporters are multifunctional. Besides water, some members of the AQP family transport other substrates, such as nitrate, Cl−, ammonia, urea, and glycerol (12, 25). Members of the SGLT family are also very versatile, transporting water and urea as well as glucose and Na+ (20, 29, 30, 45, 46). Similarly, UT-B has been shown to transport ammonia and water in addition to urea (11, 47). In the present study, we isolated two Na+-dependent glucose transporters (SGLT1a and NaGLT1) and two UT-A2 variants from the rat IM and assessed their potential as urea channels.
SGLT1 is a high-affinity Na+-dependent glucose transporter with a 2:1 Na+-to-glucose ratio, mainly expressed in mammalian proximal tubules (2, 19, 42). Since it has been previously reported that rabbit SGLT1 was capable of transporting urea (20), we screened the IM for this transcript and found an NH2-terminal truncated variant (SGLT1a). Interestingly, this transcript was upregulated in ATLs after water restriction, suggesting that it may be regulated by hydration status. Previous studies have shown that the pathway for urea and glucose lies within the last five transmembrane domains of the COOH terminus of SGLT1 (32, 33, 34). Since the COOH terminus of SGLT1a is unmodified from SGLT1, it would presumably retain the urea-transporting region. Indeed, we found that SGLT1a facilitated urea uptake into oocytes in the presence and absence of Na+, and, like the full-length SGLT1, urea uptake was reduced by phloretin and phloridzin. However, unlike rabbit SGLT1 (20), phloridzin sensitivity of rat SGLT1a was not dependent on the presence of Na+ in the uptake medium, and uptake was not enhanced in the presence of the nonmetabolizable sugar analog α-methyl-d-glucopyranoside (data not shown). This could be due to the structural difference of SGLT1a resulting in the loss of part of the Na+- and glucose-binding sites (28, 32).
NaGLT1 isolated from the rat kidney was first described by Horiba et al. (14) as a low-affinity Na+-dependent glucose transporter with a 1:1 Na+-to-glucose ratio expressed predominantly in the cortex and proximal tubules. It shares a low sequence homology (<22%) with SGLTs or glucose transporters. Not much is known about NaGLT1, but it appears to exist in greater quantity than SGLTs in the kidney and that it also transports fructose (15). We found this transcript expressed and upregulated in the whole IM as well as in ATLs and DTLS when rats were water restricted, indicating that this transporter could be involved somehow in the urine concentrating process. NaGLT1 also facilitated urea uptake into oocytes in the presence and absence of Na+, and uptake was sensitive to phloretin and phloridzin. We also tested urea uptake in the presence of α-methyl-d-glucopyranoside, but no difference in uptake rate was observed (data not shown). Therefore, like SGLT1a, the urea-transporting property of NaGLT1 was independent of the natural substrates, Na+ and glucose.
During our search for transporters in the IM, we identified a truncated variant of UT-A2 that was highly expressed after water restriction in the whole IM as well as in ATLs. Because UT-A2c is truncated at the COOH terminus, current available antibodies would fail to detect this protein. Some truncated proteins are nonfunctional but act as dominant negative factors, inhibiting the expression of the full-length protein, as in the case of the Na+-dependent phosphate transporter (NaPi) variants (NaPi2α and NaPi2γ), which suppress the function of NaPi2 (43). To determine whether or not truncated UT-A2c acts as a dominant negative factor, we coinjected this cRNA together with that of full-length UT-A2 into oocytes; however, no change or alteration in urea uptake was observed. Surprisingly, this truncated UT-A2 variant enhanced urea uptake into oocytes when expressed alone.
We also detected and isolated a variant of UT-A2 with the entire exon 6 skipped (UT-A2d). Although transcript levels of this variant did not change with water restriction, the UT-A2d protein enhanced urea uptake into oocytes, and uptake was sensitive to the inhibitor phloretin, as has been demonstrated with full-length rat UT-A2 (39). Some of our preliminary data suggest that concentrations of phloretin lower than 0.7 mM are ineffective. Further investigation, including a more detailed examination of inhibitors for both UT-A2c and UT-A2d, is warranted.
Coinjection of UT-A2d with full-length UT-A2 also had no effect on urea uptake (data not shown). Although both UT-A2c and UT-A2d enhanced urea uptake when expressed alone, when either was coinjected with UT-A2, urea uptake was not enhanced further. Similarly, increasing the amount of UT-A2 cRNA from 15 to 25 ng did not increase the urea uptake rate. This suggests that the amount of UT-A2 protein that could be expressed on the oocyte membrane reached a maximum. It is important to consider that the behavior as well as translation and trafficking of exogenous proteins in heterologous expression systems may differ from that which occurs in the native cellular environment. How and if these UT-A proteins actually interact with each other in their natural context remain to be determined.
According to the dvUT and UT-B models of Levin and colleagues (21, 22, 23), both of these UT-A2 variants would lack key structural elements, so we would expect urea transport to be affected or lost. According to the model, UT-A2c would be missing the T5b and T4b transmembrane helixes, and T5b forms part of the selectivity filter or pore. UT-A2d would be missing T3a and part of T4a (Fig. 2B). However, it is still unclear how UT-As may differ structurally compared with UT-B and dvUT. Despite the fact that the residues forming the selectivity filter of UT-As and UT-B are predicted to be similar, there are still differences in the two transporters. The flux rate through UT-B is one to two orders of magnitude faster than through UT-A, and UT-B allows various substances besides urea to permeate, whereas UT-A is more selective (23). Additionally, the function of UT-A appears not to be highly dependent on structure since the two shortest UT-As [UT-A5, which has 323 amino acids (8), and UT-A6, which has 235 amino acids (40)] are capable of transporting urea.
While the significance of these UT-A2 variants is unknown, alternative splicing creates genetic flexibility and, like multifunctional transporters, contributes to increased transporter protein diversity. Furthermore, RNA splicing may give rise to variants with distinct functions, variants with identical functions but different regulation or kinetics, or variants with different membrane or tissue localization (9).
What could be the physiological relevance of these urea-transporting cotransporters and UT-A2 variants? We propose that they may contribute to transcellular urea movement when they are expressed in high numbers and exposed to elevated urea concentrations in regions devoid of UTs in Henle's loop. They may function in combination with other transporters or perhaps in conjunction with paracellular pathways, which have not yet been ruled out as contributing factors to urea movement in the IM.
Interestingly, ClC-K1 mRNA levels in ATLs increased with water restriction. This suggests that increased Cl− reabsorption occurs via ClC-K1, which would be accompanied by increased Na+ reabsorption. The passive reabsorption of NaCl from ATLs, in excess of solute secretion, is the most widely accepted mechanism of urine concentration in the IM (7, 17, 35, 38, 41).
In summary, we have identified and characterized a number of potential channels for urea in the rat IM. Like other cotransporters, NaGLT1 and SGLT1a appear to be multifunctional with the ability to facilitate urea flux, and the UT-A2 variants we identified retain urea transport capability despite predicted altered structures.
GRANTS
This work was supported by National Institute of Diabetes and Digestive and Kidney Diseases Grant DK-083338.
DISCLOSURES
No conflicts of interest, financial or otherwise, are declared by the author(s).
AUTHOR CONTRIBUTIONS
Author contributions: C.M.N., W.H.D., and T.L.P. conception and design of research; C.M.N. performed experiments; C.M.N. analyzed data; C.M.N., W.H.D., and T.L.P. interpreted results of experiments; C.M.N. prepared figures; C.M.N. drafted manuscript; C.M.N., W.H.D., and T.L.P. edited and revised manuscript; C.M.N., W.H.D., and T.L.P. approved final version of manuscript.
REFERENCES
- 1.Bagnasco SM, Peng T, Nakayama Y, Sands JM. Differential expression of individual UT-A urea transporter isoforms in rat kidney. J Am Soc Nephrol 11: 1980–1986, 2000. [DOI] [PubMed] [Google Scholar]
- 2.Balen D, Ljubojevic M, Breljak D, Brzica H, Zlender V, Koepsell H, Sabolic I. Revised immunolocalization of the Na+-d-glucose cotransporter SGLT1 in rat organs with an improved antibody. Am J Physiol Cell Physiol 295: C475–C489, 2008. [DOI] [PubMed] [Google Scholar]
- 3.Ceriotti A, Colman A. mRNA translation in Xenopus oocytes. In: Methods in Molecular Biology, edited by Tymms MJ. Totowa: Humana Press, 1995, vol. 37, p. 151–178. [DOI] [PubMed] [Google Scholar]
- 4.Chou CL, Knepper MA. In vitro perfusion of chinchilla thin limb segments: urea and NaCl permeabilities. Am J Physiol Renal Fluid Electrolyte Physiol 264: F337–F343, 1993. [DOI] [PubMed] [Google Scholar]
- 5.Chou CL, Knepper MA. In vitro perfusion of chinchilla thin limb segments: segmentation and osmotic water permeability. Am J Physiol Renal Fluid Electrolyte Physiol 263: F417–F426, 1992. [DOI] [PubMed] [Google Scholar]
- 6.Crawford JD, Doyle AP, Probst H. Service of urea in renal water conservation. Am J Physiol 196: 545–548, 1959. [DOI] [PubMed] [Google Scholar]
- 7.Dantzler WH, Layton AT, Layton HE, Pannabecker TL. Urine concentrating mechanism in the inner medulla: function of the thin limbs of Henle's loops. Clin J Am Soc Nephrol 9: 1781–1789, 2014. [DOI] [PMC free article] [PubMed] [Google Scholar]
- 8.Fenton RA, Howorth A, Cooper GJ, Meccariello R, Morris ID, Smith CP. Molecular characterization of a novel UT-A urea transporter isoform (UT-A5) in testis. Am J Physiol Cell Physiol 279: C1425–C1431, 2000. [DOI] [PubMed] [Google Scholar]
- 9.Gamba G. Alternative splicing and diversity of renal transporters. Am J Physiol Renal Physiol 281: F781–F794, 2001. [DOI] [PubMed] [Google Scholar]
- 10.Gamble JL, McKhann CF, Butler AM, Tuthill E. An economy of water in renal function referable to urea. Am J Physiol 109: 139–154, 1934. [Google Scholar]
- 11.Geyer RR, Musa-Aziz R, Enkavi G, Mahinthichaichan P, Tajkhorshid E, Boron WF. Movement of NH3 through the human urea transporter B: a new gas channel. Am J Physiol Renal Physiol 304: F1447–F1457, 2013. [DOI] [PMC free article] [PubMed] [Google Scholar]
- 12.Gomes D, Agasse A, Thiebaud P, Delrot S, Geros H, Chaumont F. Aquaporins are multifunctional water and solute transporters highly divergent in living organisms. Biochim Biophys Acta 1788: 1213–1228, 2009. [DOI] [PubMed] [Google Scholar]
- 13.Hall TA. BioEdit: a user-friendly biological sequence alignment editor and analysis program for Windows 95/98/NT. Nucleic Acids Symp Ser 41: 95–98. 1999. [Google Scholar]
- 14.Horiba N, Masuda S, Ohnishi C, Takeuchi D, Okuda M, Inui K. Cloning and characterization of a novel Na+-dependent glucose transporter (NaGLT1) in rat kidney. J Biol Chem 278: 14669–14676, 2003. [DOI] [PubMed] [Google Scholar]
- 15.Horiba N, Masuda S, Ohnishi C, Takeuchi D, Okuda M, Inui K. Na+-dependent fructose transport via rNaGLT1 in rat kidney. FEBS Lett 546: 276–280, 2003. [DOI] [PubMed] [Google Scholar]
- 16.Kim YH, Kim DU, Han KH, Jung JY, Sands JM, Knepper MA, Madsen KM, Kim J. Expression of urea transporters in the developing rat kidney. Am J Physiol Renal Physiol 282: F530–F540, 2002. [DOI] [PubMed] [Google Scholar]
- 17.Kokko JP, Rector FC. Countercurrent multiplication system without active transport in inner medulla. Kidney Int 2: 214–23, 1972. [DOI] [PubMed] [Google Scholar]
- 18.Krogh A, Larsson B, von Heijne G, Sonnhammer ELL. Predicting transmembrane protein topology with a hidden Markov model: application to complete genomes. J Mol Biol 305: 567–580, 2001. [DOI] [PubMed] [Google Scholar]
- 19.Lee WS, Kanai Y, Wells RG, Hediger MA. The high affinity Na+/glucose cotransporter. J Biol Chem 269: 12032–12039, 1994. [PubMed] [Google Scholar]
- 20.Leung DW, Loo DDF, Hirayama BA, Zeuthen T, Wright EM. Urea transport by cotransporters. J Physiol 528: 251–257, 2000. [DOI] [PMC free article] [PubMed] [Google Scholar]
- 21.Levin EJ, Cao Y, Enkavi G, Quick M, Pan Y, Tajkhorshid E, Zhou M. Structure and permeation mechanism of a mammalian urea transporter. Proc Natl Acad Sci USA 109: 11194–11199 2012. [DOI] [PMC free article] [PubMed] [Google Scholar]
- 22.Levin EJ, Quick M, Zhou M. Crystal structure of a bacterial homologue of the kidney urea transporter. Nature 462: 757–761, 2009. [DOI] [PMC free article] [PubMed] [Google Scholar]
- 23.Levin EJ, Zhou M. Structure of urea transporters. Subcell Biochem 73: 65–78, 2014. [DOI] [PMC free article] [PubMed] [Google Scholar]
- 24.Levinsky NG, Berliner RW. The role of urea in the urine concentrating mechanism. J Clin Invest 38: 741–748, 1959. [DOI] [PMC free article] [PubMed] [Google Scholar]
- 25.Li C, Wang W. Urea transport mediated by aquaporin water channel proteins. Subcell Biochem 73: 227–265, 2014. [DOI] [PubMed] [Google Scholar]
- 26.Lim SW, Han KH, Jung JY, Kim WY, Yang CW, Sands JM, Knepper MA, Madsen KM, Kim J. Ultrastructural localization of UT-A and UT-B in rat kidneys with different hydration status. Am J Physiol Regul Integr Comp Physiol 290: R479–R492, 2006. [DOI] [PubMed] [Google Scholar]
- 27.Loo DDF, Hirayama BA, Meinild AK, Chandy G, Zeuthen T, Wright EM. Passive water and ion transport by cotransporters. J Physiol 518: 195–202, 1999. [DOI] [PMC free article] [PubMed] [Google Scholar]
- 28.Loo DDF, Jiang X, Gorraitz E, Hirayama BA, Wright EM. Functional identification and characterization of sodium binding sites in Na symporters. Proc Natl Acad Sci USA 110: 4557–4566, 2013. [DOI] [PMC free article] [PubMed] [Google Scholar]
- 29.Loo DDF, Wright EM, Zeuthen T. Water pumps. J Physiol 542: 53–60, 2002. [DOI] [PMC free article] [PubMed] [Google Scholar]
- 30.Meinild AK, Klaerke DA, Loo DDF, Wright EM, Zeuthen T. The human Na+-glucose cotransporter is a molecular water pump. J Physiol 508: 15–21, 1998. [DOI] [PMC free article] [PubMed] [Google Scholar]
- 31.Nawata CM, Evans KK, Dantzler WH, Pannabecker TL. Transepithelial water and urea permeabilities of isolated perfused Munich-Wistar rat inner medullary thin limbs of Henle's loop. Am J Physiol Renal Physiol 306: F123–F129, 2014. [DOI] [PMC free article] [PubMed] [Google Scholar]
- 32.Panayotova-Heiermann M, Eskandari S, Turk E, Zampighi GA, Wright EM. Five transmembrane helices form the sugar pathway through the Na+/glucose cotransporter. J Biol Chem 272: 20324–20327, 1997. [DOI] [PubMed] [Google Scholar]
- 33.Panayotova-Heiermann M, Loo DDF, Kong CT, Lever JE, Wright EM. Sugar binding to Na+/glucose cotransporters is determined by the carboxyl-terminal half of the protein. J Biol Chem 271: 10029–10034, 1996. [DOI] [PubMed] [Google Scholar]
- 34.Panayotova-Heiermann M, Wright EM. Mapping the urea channel through the rabbit Na+-glucose cotransporter SGLT1. J Physiol 535: 419–425, 2001. [DOI] [PMC free article] [PubMed] [Google Scholar]
- 35.Pannabecker TL. Comparative physiology and architecture associated with the mammalian urine concentrating mechanism: role of inner medullary water and urea transport pathways in the rodent medulla. Am J Physiol Regul Integr Comp Physiol 304: R488–R503, 2013. [DOI] [PMC free article] [PubMed] [Google Scholar]
- 36.Rojek A, Praetorius J, Frokiaer J, Nielsen S, Fenton RA. A current view of the mammalian aquaglyceroporins. Annu Rev Physiol 70: 301–27, 2008. [DOI] [PubMed] [Google Scholar]
- 37.Sands JM, Bount MA. Genes and proteins of urea transporters. Subcell Biochem 73: 45–63, 2014. [DOI] [PubMed] [Google Scholar]
- 38.Sands JM, Layton HE. Advances in understanding the urine-concentrating mechanism. Annu Rev Physiol 76: 387–409, 2014. [DOI] [PubMed] [Google Scholar]
- 39.Smith CP, Lee WS, Martial S, Knepper MA, You G, Sands JM, Hediger MA. Cloning and regulation of expression of the rat kidney urea transporter (rUT2). J Clin Invest 96: 1556–1563, 1995. [DOI] [PMC free article] [PubMed] [Google Scholar]
- 40.Smith CP, Potter EA, Fenton RA, Stewart GS. Characterization of a human colonic cDNA encoding a structurally novel urea transporter, hUT-A6. Am J Physiol Cell Physiol 287: C1087–C1093, 2004. [DOI] [PubMed] [Google Scholar]
- 41.Stephenson JL. Concentration of urine in a central core model of the renal counterflow system. Kidney Int 2: 85–94, 1972. [DOI] [PubMed] [Google Scholar]
- 42.Takata K, Kasahara T, Kasahara M, Ezaki O, Hirano H. Localization of Na+-dependent active type and erythrocyte/HepG2-type glucose transporters in rat kidney: immunofluorescence and immunogold study. J Histochem Cytochem 39: 287–298, 1991. [DOI] [PubMed] [Google Scholar]
- 43.Tatsumi S, Miyamoto K, Kouda T, Motonaga K, Katai K, Ohkido I, Morita K, Segawa H, Tani Y, Yamamoto H, Taketani Y, Takeda E. Identification of three isoforms for the Na+-dependent phosphate cotransporter (NaPi-2) in rat kidney. J Biol Chem 273: 28568–28575, 1998. [DOI] [PubMed] [Google Scholar]
- 44.Thompson JD, Higgins DG, Gibson TJ. CLUSTAL W: improving the sensitivity of progressive multiple sequence alignment through sequence weighting, position-specific gap penalties and weight matrix choice. Nucleic Acids Res 22: 4673–4680, 1994. [DOI] [PMC free article] [PubMed] [Google Scholar]
- 45.Wright EM, Loo DDF, Hirayama BA. Biology of human sodium glucose transporters. Physiol Rev 91: 733–794, 2011. [DOI] [PubMed] [Google Scholar]
- 46.Wright EM, Loo DDF, Hirayama BA, Turk E. Surprising versatility of Na+-glucose cotransporters: SLC5. Physiology 19: 370–376, 2004. [DOI] [PubMed] [Google Scholar]
- 47.Yang AS, Verkman B. Analysis of double knockout mice lacking aquaporin-1 and urea transporter UT-B. Evidence for UT-B-facilitated water transport in erythrocytes. J Biol Chem 277: 36782–36786, 2002. [DOI] [PubMed] [Google Scholar]


