Abstract
Random fiber networks are assemblies of elastic elements connected in random configurations. They are used as models for a broad range of fibrous materials including biopolymer gels and synthetic nonwovens. Although the mechanics of networks made from the same type of fibers has been studied extensively, the behavior of composite systems of fibers with different properties has received less attention. In this work we numerically and theoretically study random networks of beams and springs of different mechanical properties. We observe that the overall network stiffness decreases on average as the variability of fiber stiffness increases, at constant mean fiber stiffness. Numerical results and analytical arguments show that for small variabilities in fiber stiffness the amount of network softening scales linearly with the variance of the fiber stiffness distribution. This result holds for any beam structure and is expected to apply to a broad range of materials including cellular solids.
Keywords: Heterogeneous Materials, Elastic Materials, Beam Structures, Microstructures, Probability and Statistics
1. Introduction
Assemblies of linear elastic beams have been used as mechanical models for materials with fibrous, cellular or periodic lattice microstructures. For example Head et al. (2003) used networks of beams to model the mechanics of biopolymer gels (also see van Dillen et al., 2008). Beam structures have also been previously used to study cellular materials such as foams (Deshpande et al., 2001) and also in studies of the mechanics of paper (Cox, 1952). Similarly, regular lattices of beams have been used extensively in structural engineering to represent beam frameworks (Reddy, 2001).
In most of these studies the network is considered homogeneous, i.e. it is made from fibers having identical properties. However, most networks encountered in nature are composite, i.e. are made from fibers with different properties. In most biological collagen networks the fibers group in bundles of variable dimensions (Raub et al., 2007) and hence the effective network of bundles can be considered a composite network. Connective tissue gains its unique mechanical properties due to the presence of fibers such as collagen and elastin (Cowin and Doty, 2007). The cell cytoskeleton contains protein filaments such as F-actin and microtubules (Fletcher and Mullins, 2010). In papers, mixtures of fibers of different length and stiffness are used to provide enhanced strength and toughness. In all these cases the presence of the different types of fibers imparts special properties to the composite network, above and beyond those of the homogeneous networks (Broedersz et al., 2011, 2012; Buxton and Clarke, 2007; Gardel et al., 2004; Head et al., 2003; Kasza et al., 2009; Lieleg et al., 2010; Picu, 2011; van Dillen et al., 2008; Wade and Tanaka, 2009).
To place the discussion in perspective, we briefly review the main results obtained for the relationship between network parameters and the overall stiffness of homogeneous networks (Picu, 2011). The parameters of importance in both 2D and 3D models are the network density, ρ (total fiber length per unit area or volume), the mean fiber length, lc and the fibers axial and bending stiffness, (EA)f and (EI)f. In thermal systems, the filament bending stiffness can be alternatively quantified by the fiber persistence length. For homogeneous networks, a characteristic length scale is defined as lb = [(EI)f/(EA)f]0.5. It has been shown that homogeneous networks with various (EA)f and (EI)f values, but with the same lb have the same network stiffness. When ρ or/and lb increase, the network approaches a limit in which the strain energy is predominantly stored in the axial mode of fiber deformation and the overall modulus scales linearly with (EA)f and ρ. As ρ or/and lb decrease, the deformation is more non-affine, the strain energy is stored predominantly in the bending mode of fiber deformation and the overall modulus scales linearly with (EI)f and ρx. The exponent x depends on the network geometry. While Broedersz et al. (2012) and Shahsavari and Picu (2012) reported exponents of 3 and 8 respectively for 3D networks with elements aligned along the edges of a face centered cubic lattice and 2D Mikado networks respectively, here, we observe that x = 2 for 3D Voronoi networks. This demonstrates that the network modulus is highly sensitive to the density for systems in the non-affine, bending dominated regime.
Composite networks have been studied much less than homogeneous networks. A class of composite networks constructed by adding a small number of different fibers to a homogeneous base network was studied only recently (Bai et al., 2011; Huisman et al., 2010; Shahsavari and Picu, 2015; Wada and Tanaka, 2009). Bai et al. (2011) reported significant network stiffening from adding small fractions of stiff fibers to a non-affinely deforming base network. Stiffening was observed even when the added fibers were too sparse to form a stress-bearing network. They attributed this effect to a more affine displacement field due to the presence of the added stiff fibers. A similar type of network was studied in 3D by Huisman et al. (2010) where no stiffening effect was observed. However they reported that the presence of stiffer fibers reduces the critical strain marking the transition from the linear to the non-linear elastic regime. The problem of stiff fibers added to a non-affinely deforming base network was also studied by Shahsavari and Picu (2015). They reported that the global stiffening effect takes place in two steps. A transition is observed when the added stiff fibers percolate and form a stress-bearing network. During this process the overall stiffness increases abruptly and asymptotes to the value expected for the newly formed stiff network. A second transition takes place at smaller densities of added fibers which also leads to a substantial stiffness rise. Stiff fibers bonded to a non-affinely deforming base induce an “interphase” (i.e. a region of the base network) in which the strain energy is stored predominantly in the axial mode of fiber deformation. The second transition is associated with the percolation of these interphases.
An entirely different class of models in which a more macroscopic continuum view is taken, has been developed for fibrous structures. These are homogenized representations that lack the level of microstructural detail of the discrete models, such as those discussed above, but can be used to model much larger problem domains. Homogenized models of molecular networks have been proposed early in the development of the theory of rubber elasticity (James and Guth, 1943; Treloar, 1954). These models considered the molecules to behave as entropic springs and assumed that the motion of the cross-links is affine. Similar models based on the affine deformation assumption have been derived for athermal networks (e.g. Lee and Carnaby, 1992; Wu and Dzenis, 2005). Further developments of the theory of molecular networks partially relaxed the affine deformation restriction while considering a small number of chains as being representative for the entire network. Examples are the four chain model (Flory and Rehner, 1943; Treloar, 1946) and the eight chain model of Arruda and Boyce (1993). Improved models have been introduce that consider more broadly the non-affine deformations as well as other important factors such as structural constrains on the possible conformations of the chains (Miehe et al., 2004), network functionality (Tkachuk and Linder, 2012) and viscous effects caused by diffusion and mobility of the chains (Linder et al., 2011). Continuum network models have also been used to capture the strain stiffening mechanism in materials with random fibrous microstructures (Raina and Linder, 2014; van Dillen et al., 2008).
Here we study a general type of discrete composite network models made from fibers having a distribution of stiffness values. It is observed that in this case a single parameter describing the fiber properties, i.e. lb, is insufficient to quantify the overall stiffness and it is necessary to consider the distributions of both (EA)f and (EI)f. It is observed that the mean of the overall network stiffness, E, decreases with increasing the variance of the fiber stiffness distribution at constant mean of this distribution. In contrast, the variance of E increases with increasing fiber stiffness variance. These results are proven analytically for any generic structure of beams.
2. Models and methods
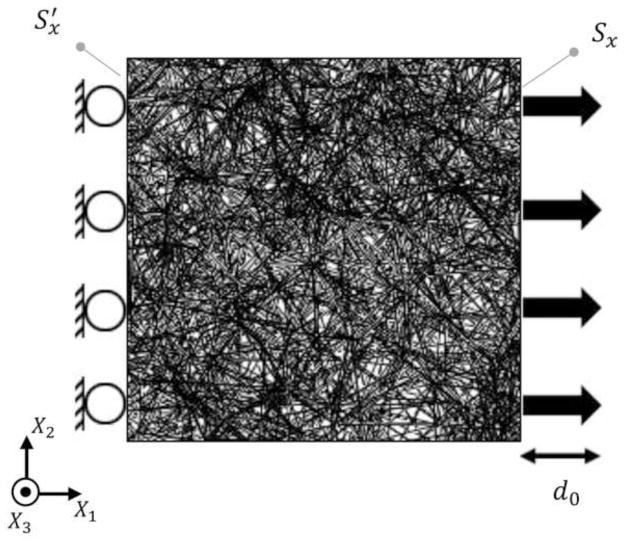
Models of random fiber networks in 2D and 3D were used in simulations. In the 3D simulations a cubic domain of dimension L was considered and a set of seed points were randomly distributed in the domain. The seeds were then used to create Delaunay or Voronoi tessellations. Fibers were defined along all edges of the resulting tessellations. The generated models contained more than one thousand fibers in all instances. This number is referred to as Nf. Samples with variable fiber densities, ρ, and problem sizes were considered. A 2D projection of one of the studied 3D networks is shown in Fig. 1. Mikado networks were also considered in few cases to further test the results using 2D models. These networks were cross-linked at all fiber intersection points and were generated with a procedure similar to that described in (Shahsavari and Picu, 2012).
Fig. 1.
Displacement controlled uniaxial stretch test of a 3D fiber network model.
In all these models, the random network generation procedure resulted in fibers with exponential distribution of fiber lengths, of mean lc. Exponential distributions have been previously observed in Mikado networks (Kallmes and Corte, 1960; Shahsavari and Picu, 2013) as well as in experiments on actin filament gels (Janmey et al., 1986). It can be noted that this is not the case for all biopolymer networks. For example logarithmic-normal distributions of filament lengths have been observed in networks of collagen-I filaments by Lindström et al. (2010).
Unless specified otherwise, individual fibers were represented as Timoshenko beams that store energy in the axial, bending, torsion and transverse shear deformation modes. The beam elements were modeled using linear elements with generalized sections and hence we were able to control the axial (EA)f and bending (EI)f stiffnesses independently. The beam cross-sections had the same stiffness in all possible bending directions. A few tests were also performed using networks of linear springs that can store energy only in the axial deformation mode. These tests are discussed in section 3.
The overall network modulus was determined by performing small-strain displacement controlled uniaxial stretch tests. In these tests the displacements and rotations of all nodes are the degrees of freedom. These degrees of freedom determine the total potential energy of the system. The system equilibrium configuration can be found by minimizing the total system potential energy. The tests were performed using implicit nonlinear analysis with the Abaqus finite element solver.
The applied boundary conditions are shown schematically in Fig. 1. The left and right faces of the test cube were subjected to prescribed displacements in the X1 direction. The nodes on the left face were fixed in the X1 direction. Additionally, to eliminate the rigid body translations and rotations one node on the left face was fixed also in X2 and X3 and another node on the left face was only fixed in X2. The right face was displaced in X1 by an amount d0 while its nodes were traction free in all other directions. All other boundaries were traction free. The effective network modulus was calculated as
| (1) |
where Sx is the initial area of the right face of the sample. t is the computed traction associated with the imposed boundary displacement over Sx and d0 = {d0, 0, 0}. V is the initial volume of the simulation domain and ε0 is the small prescribed normal strain, ε0 = d0/L.
The beam materials were considered to be linear elastic and to behave identically in compression and tension. Asymmetric behavior of fibers in tension and compression was also considered in few cases (where specified) and only in networks in which the strain energy is stored predominantly in the axial deformation mode of fibers. In these models, the ratio of the axial fiber stiffness in compression to the axial stiffness in tension was 0.1.
3. Numerical results
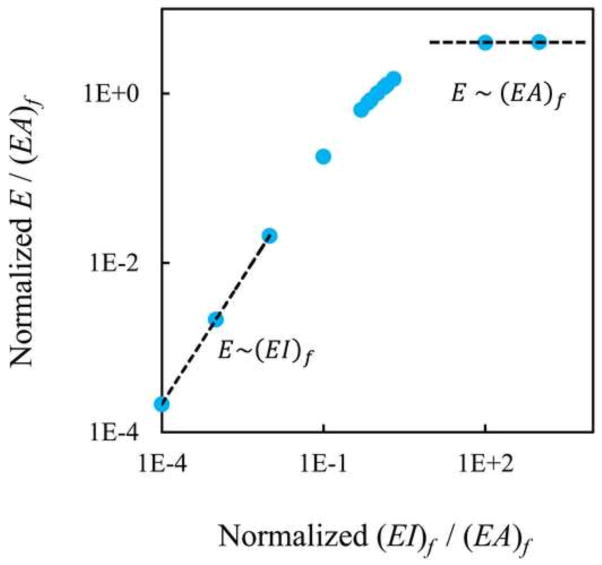
We began by verifying the models against previous findings regarding homogeneous random fiber networks. This also allowed defining the characteristic bending and stretch dominated asymptotes for the particular network geometry used in this work. These characteristic behaviors were previously described in section, (Broedersz et al., 2012; Shahsavari and Picu, 2012). To this end, the ratio (EI)f/(EA)f was varied while the network density, ρ, was kept constant. All networks in this set were of Voronoi type. A reference homogeneous model was defined, having fibers of circular cross section of radius r = 0.02L, Young’s modulus Ef and shear stiffness Gf = Ef/2.6. The reference axial and bending stiffnesses are denoted by (EA)f0 and (EI)f0, and (EI)f0/(EA)f0 = 10−4. The number of fibers in this reference network is denoted by Nf0. The overall network modulus, E, was evaluated numerically. As expected, for very large values of the ratio (EI)f/(EA)f, it was observed that E~(EA)f, while for very small values, E~(EI)f. The reference network of (EA)f0 and (EI)f0 was in the transition region and has stiffness denoted by E0. The network modulus divided by the axial stiffness of fibers, E/(EA)f, is shown in Fig. 2. The reported values are normalized by the corresponding values of the reference network.
Fig. 2.
Normalized overall modulus of homogeneous networks as a function of the ratio of the fiber bending and axial stiffness. The values plotted are normalized by the corresponding quantities of the reference network, i.e. by E0/(EA)f0 and (EI)f0/(EA)f0 for the vertical and horizontal axes, respectively.
We proceeded by studying the effect of fiber density on E close to the two asymptotes and observed that E~ ρ in the stretch dominated limit (right side of the plot in Fig. 2) and E~ ρ2 in the bending dominated limit (left side of the plot in Fig. 2).
Next, we considered composite networks with distributions of axial and bending stiffness of the constituent fibers. The moduli of these networks were compared with the reference homogeneous network of fiber stiffnesses (EA)f0 and (EI)f0 and overall modulus E0.
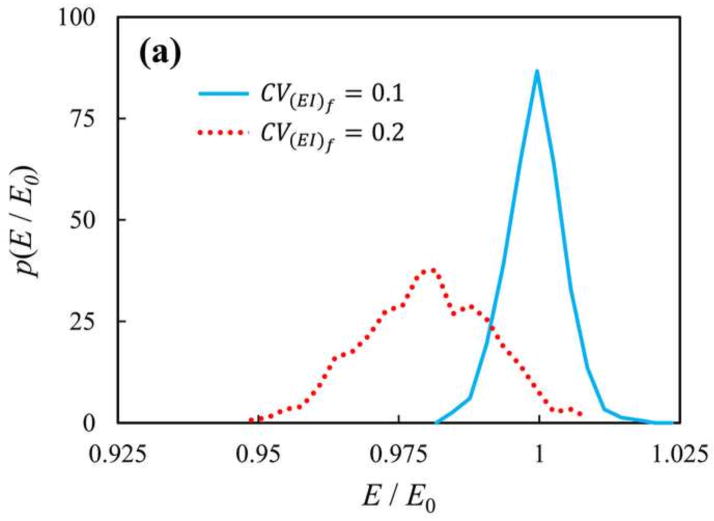
First, we considered networks of fibers having the same axial stiffness, (EA)f = 103(EA)f0, while the bending stiffness of the fibers was sampled from a normal distribution of mean and coefficient of variation†, . The parameters and were chosen such for the network deformation to be bending dominated (Fig. 2). Five hundred replicas with the same geometry as the homogenous network were used to obtain the distribution of E associated with the distribution of (EI)f. Fig. 3(a) shows the probability distribution function (PDF) of the normalized network modulus, p(E/E0), for two cases, with CV(EI)f = 0.1 and 0.2.
Fig. 3.
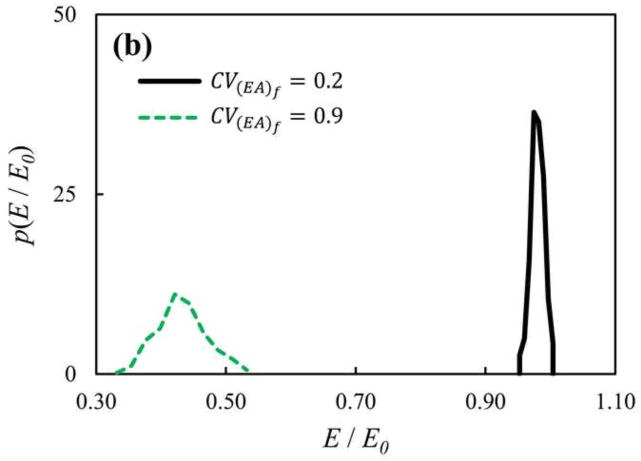
PDF of the normalized network stiffness, E/E0, for networks with non-identical (a) bending and (b) axial fiber stiffness. (a) The fiber bending stiffness follows a normal distribution of mean and coefficient of variation . Distributions of network stiffness are shown for two values of the coefficients of variations of (solid blue) 0.1 and (dotted red) 0.2. (b) The axial stiffness of fibers in these models is selected from a distribution of mean and coefficient of variation . Distributions of network stiffness are shown for two values of the coefficient of variations of (solid black) 0.2 and (dashed green) 0.9. The network stiffness, E, is normalized by the stiffness of the respective reference homogeneous network, E0.
It was observed that the variance of the network stiffness PDF increased with increasing the coefficient of variation of the fiber bending stiffness CV(EI)f. Interestingly, the mean of the network stiffness, 〈E〉, decreased with increasing CV(EI)f. So, the composite networks were on average softer than their homogeneous counterparts.
In the tests mentioned above the strain energy was predominantly stored in the bending mode of fiber deformation. Therefore, the observed shift was not due to a change of deformation mechanism from the bending-dominated to the axially-dominated mode. We further considered axially-dominated networks. In these models, fibers had identical bending stiffness (EI)f = (EI)f0 and a PDF of axial stiffnesses. The mean fiber axial stiffness was and the coefficient of variation was . The result is shown in Fig. 3(b) for networks with CV(EA)f= 0.2 and 0.9. The trends are identical to those seen in Fig. 3(a), but the effect is more pronounced since the variance of the fiber stiffness distribution is larger.
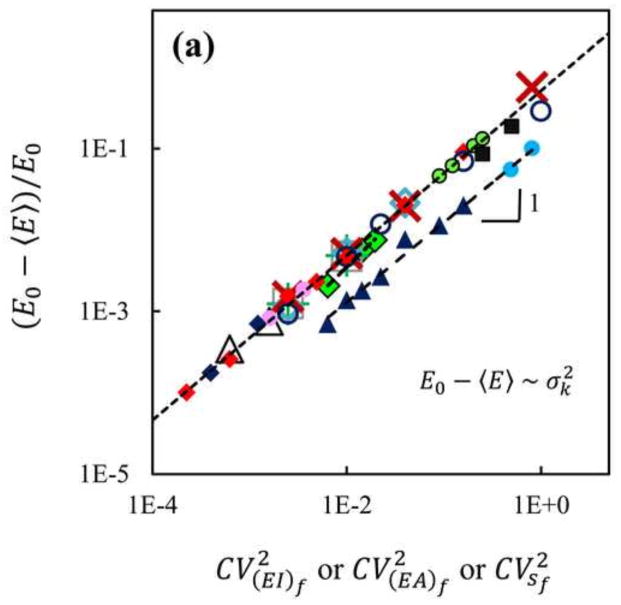
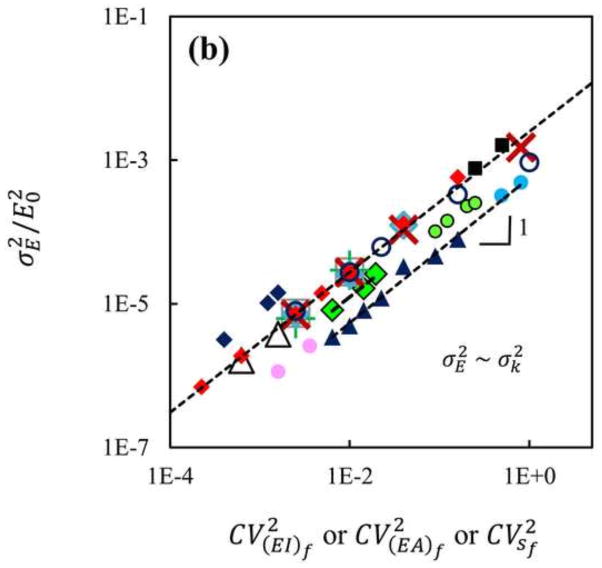
Various network geometries (3D Voronoi, 3D Delaunay and 2D Mikado), various types of fiber stiffness distribution (normal, log-normal and bimodal) and various values were considered in separate simulations. values ranging from 10−3(EA)f0 to 103(EA)f0 were considered in the tests. So, values close to both axial and bending asymptotes of the plot in Fig. 2, and in the transition region were considered. The tests were performed using different CV(EI)f and CV(EA)f values and the average network softening was measured. The results of these tests are shown in Fig. 4. In Fig. 4(a) the relative network softening, (E0 − 〈E〉)/E0, is plotted against the coefficient of variation of the fiber stiffness. The figure shows or if (EI)f or (EA)f are sampled from distributions, respectively. The various symbols correspond to networks with the various properties listed in Table 1. It is observed that if the network is selected close to the bending dominated asymptote of the plot in Fig. 2, there is no significant effect due to the variability of the fiber axial stiffness. This is expected since E is not significantly affected by the fiber axial stiffness close to the bending dominated asymptote. Similarly, E is not affected by a distribution of fiber bending stiffness if the system is close to the axially dominated asymptote.
Fig. 4.
(a) The normalized softening and (b) normalized variance of the overall network stiffness against the coefficient of variation of the stiffness of the constituent fibers. For each data set, both these quantities scale linearly with the variance of the fiber stiffness. The variable on the horizontal axis is the coefficient of variation of the distribution of either (EA)f, (EI)f or sf as appropriate for the respective test. The various symbols used here are described in Table 1 or in the text. Each point in this plot was obtained by averaging over five hundred replicas. k in the scaling laws denotes the fiber stiffness in a single mode, either (EA)f, (EI)f or sf. The values shown by the vertical axes are normalized by the small-strain stiffness of the respective homogeneous network stiffness, E0, for each data series.
Table 1.
Parameters of the various network models considered in the numerical study and associated symbols used in Fig. 4.
| # | Symbol | Fiber Axial Behavior |
|
Distribution | Geometry | |
|---|---|---|---|---|---|---|
| 1 | Open Cyan Diamonds | Symmetric | 103 | Normal | Voronoi | |
| 2 | Green Plus Signs | Symmetric | 102 | Normal | Voronoi | |
| 3 | Open Grey Squares | Symmetric | 10−2 | Normal | Voronoi | |
| 4 | Filled Red Diamonds | Symmetric | 10−3 | Normal | Voronoi | |
| 5 | Open Black Triangles* | Symmetric | 10−3 | Normal | Voronoi | |
| 6 | Red Crosses | Symmetric | 10−3 | Bimodal† | Voronoi | |
| 7 | Open Black Circles | Symmetric | 10−3 | Lognormal | Voronoi | |
| 8 | Filled Green Diamonds‡ | Symmetric | 1 | Normal | Voronoi | |
| 9 | Filled Navy Triangles | Symmetric | 10−3 | Normal | Delaunay | |
| 10 | Filled Blue Circles | Asymmetric | 10−3 | Bimodal | Delaunay | |
| 11 | Filled Black Squares§ | Symmetric | N/A | Bimodal | Delaunay | |
| 12 | Filled Green Circles | Symmetric | 10−3 | Bimodal | Mikado |
This sample included a different geometric replica of the Voronoi network.
In these tests the stiffness of each fiber was randomly chosen as either or .
The elastic behavior of this sample was not close to either of the stretch or bending dominated asymptotes in Fig. 2.
Indicates tests on networks of linear springs (zero bending, torsional and shear stiffness).
If the parameters are such that the network is not close to the stretch dominated asymptote it was observed that, in all cases, the network softening is proportional to . Hence, with all other parameters kept constant and variable σ(EI)f,
| (2) |
In Fig. 4(b) the normalized variance of the network stiffness is plotted against the coefficient of variation of the fiber stiffness, . It was observed that is proportional to and the scaling prefactor depends on the average nodal coordination number (network functionality) and Nf. It was also observed that if all other parameters stay constant and only σ(EI)fvaries,
| (3) |
Similar results were obtained when (EI)f was identical for all fibers and (EA)f was sampled from a distribution. In this case the network softening and variance of the stiffness distribution scale linearly with .
Figure 4 also shows data for 3D Delaunay and 2D Mikado networks, which all follow the scaling laws shown by Eqs. (2) and (3). The Mikado, Voronoi and Delaunay networks considered have average nodal coordinations of 3.76, 4.00 and 21.12 respectively. The scaling prefactor for Delaunay networks is smaller. This can be attributed to the difference in the nodal coordination number. Furthermore, the dimensionality of the system (2D vs. 3D) does not affect the scaling laws. Note also that the structure of Voronoi networks (which is closer to that of open cell foams) is very different from that of the Mikado networks (mimicking paper and fiber mats used in consumer products) and Delaunay networks, but the scaling laws of Eqs. 2 and 3 are not affected by these factors.
We further investigated axially-dominated systems in which the fibers have compressive axial stiffness much smaller than their tensile stiffness. This models situations in which fiber buckling occurs under local compressive loading and the post-critical, bending-dominated stiffness of buckled fibers is very small compared to their stiffness in tension. To this end, we rendered (EA)f different in tension and compression, the tension-compression asymmetry being characterized by the ratio . As the results shown using filled blue circles in Fig. 4 indicate, Eqs. (2) and (3) hold in this case as well.
We also tested networks of harmonic springs that have no bending or shear deformation mode. The results are shown with filled black squares in Fig. 4 and indicate that Eqs. (2) and (3) hold for these networks too. The spring network simulations are performed using the Delaunay network geometry to insure stability. In this case, the network modulus is measured in units of where is the average spring stiffness and the stiffness of the springs in the model is sampled from a distribution with a coefficient of variation .
As discussed in the literature, the network modulus is generally influenced by size effects (Dirrenbergerl et al., 2014; Hatami-Marbini et al., 2013; Shahsavari and Picu, 2012). We tested the effect of the model size on the results reported above and observed that the softening behavior (Fig. 4(a) and Eq. (2)) is not affected by the size effect. In contrast, the variance of the network modulus, E, vanishes for infinitely large networks. In Fig. 4 the pink circles and navy diamonds correspond to networks containing different numbers of fibers. The circles correspond to a network whose dimensions were increased by a factor of 1.5 relative to the reference network, while the diamonds correspond to a network with 1/3 the reference network density. Varying Nf leaves the scaling laws (2) and (3) unchanged and only affects the pre-factor in Eq. (3).
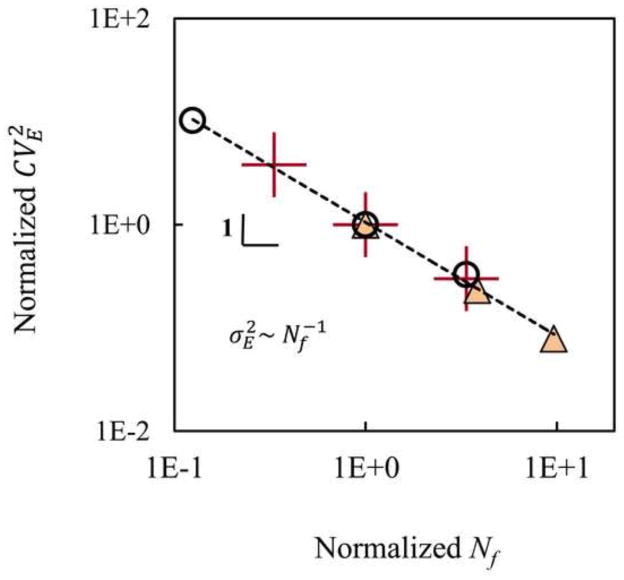
In Fig. 5 the red plus symbols show the dependence of the variance of the network modulus on Nf. Nf was altered by changing the network size in one case and by changing the fiber density in another case. The red plus sign with the smallest Nf corresponds to networks with a density 1/3 of the reference network, while the point with the largest Nf corresponds to tests with networks that are 1.5 times larger than the reference network. In each of these tests the networks had the same geometry. Multiple replicas were considered for each data point. A constant value of was used in all these tests. The CVE and Nf values are normalized by the corresponding parameters of a network with Nf = Nf0.
Fig. 5.
Normalized coefficient of variation of the network stiffness against the normalized number of constituent fibers. The source of variability in network stiffness was either geometric (for homogeneous networks) or due to the variability in fiber properties (in composite networks). The data series are described in the text. Each point in this plot was obtained by averaging over 500 replicas.
To provide a reference, homogeneous networks of different size were also considered. In this case the variability of the modulus is due to geometric variability from replica to replica. Different initial seed points were used to create samples with geometric variability. The resulting variability of the network modulus is also shown in Fig. 5. The CVE and Nf values reported for these tests are normalized by the corresponding parameters from tests with Nf = Nf0. The black circles correspond to samples of various sizes while the triangles correspond to samples with various fiber densities. Whether the variability in E results from the fiber stiffness distribution or in the case of homogeneous networks from geometric variability, the variance of the network modulus scale inversely with the number of fibers: .
Since the variability in E, whether caused by geometric variability or by variability in fiber properties in composite networks, vanishes at large Nf, it can be concluded that the cases reported here (given network geometry, but with fibers of stiffness sampled from a distribution) are representative for composite networks of large dimensions.
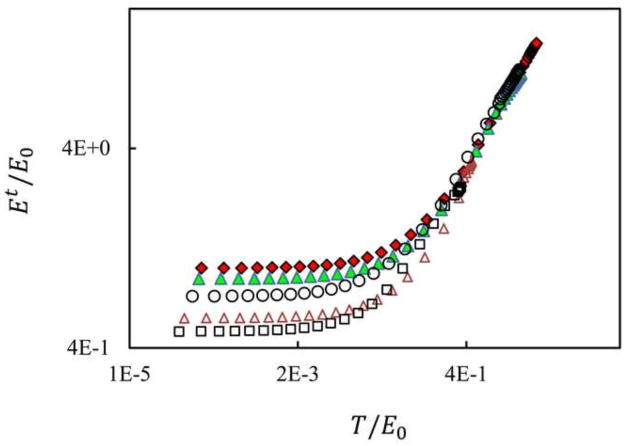
It is further interesting to inquire whether the effect discussed persists in the non-linear range of the network response. Most physical systems with fiber network structure undergo large deformations and the linear elastic regime is limited to relatively small strains (function of the network density). To clarify this issue, we tested 3D Voronoi composite networks in the non-linear range and evaluated the stress-dependent tangent stiffness. We used fibers with bimodal distributions of properties in these tests. Fig. 6 shows the stiffness vs. stress plot for the reference homogeneous network and for composite networks with nonzero CV(EA)f or CV(EI)f.
Fig. 6.
Variation of the tangent stiffness, Et, with true stress, T, for the reference homogeneous network (filled red diamonds) and for composite networks with CV(EA)f equal to (filled green triangles) 0.5, (open brown triangles) 0.8 and (open black squares) 0.9 and (open black circles) CV(EI)f = 0.9. The two axes are normalized with the small strain stiffness of the corresponding reference homogeneous network, E0.
As previously shown in experiments using collagen networks and simulations using random fiber networks (Licup et al., 2015), the curves exhibit constant stiffness at small stresses and strains followed by a power law dependence of the stiffness on the stress, Et ~ Tα. α values ranging from 1/2 to 3/2 have been reported depending on network architecture and cross-link properties (Licup et al., 2015; Žagar et al., 2015). The stiffening behavior of the tested Voronoi networks is similar to the experimental observations using collagen networks showing α = 1 (Licup et al., 2015). We observe the network softening effect associated with increasing the variance of the fiber properties distribution in the linear elastic range and in the transition to the non-linear range. Deep into the non-linear range, the curves merge and the tangent stiffness measured at the same stress value becomes independent of the variance of fiber properties. When measured at the same value of the strain, the tangent stiffness has a similar trend with increasing strain, but the convergence to the regime in which fluctuations in fiber properties have no effects on the stiffness is slower. In the systems studied, the difference in tangent stiffness from microstructural variability persists up to strains as high as 50%.
4. Theory
In this section, we provide analytical arguments to support expressions (2) and (3) and demonstrate their validity for any structure of beams subjected to small deformations. To this end we first find the change in the overall structural stiffness due to generalized forces applied to their internal nodes. Then we consider replacing a structural element of the structure by the generalized forces it applies to the structure. This leads to a relation between the overall structural stiffness and the stiffness of an element. Finally this relation, along with statistical arguments, are used to derive the scaling laws (2) and (3) in the limit of small beam stiffness variability.
We consider a reference state (state 0) in which the structure is subjected to displacement boundary conditions over a part of its boundary, , and zero tractions boundary conditions elsewhere. To make the discussion specific, we consider a uniaxial deformation in which zero displacements are applied on in the X1 direction and the displacement d0 is applied at all points of Sx in the X1 direction. The traction over Sx in the X1 direction is denoted by t0. The displacement field corresponding to these boundary conditions is denoted by u0 and the overall stiffness in this state, E0, results from Eq. (1).
4.1. Effect of the variation of the axial stiffness of a structural element on the global stiffness
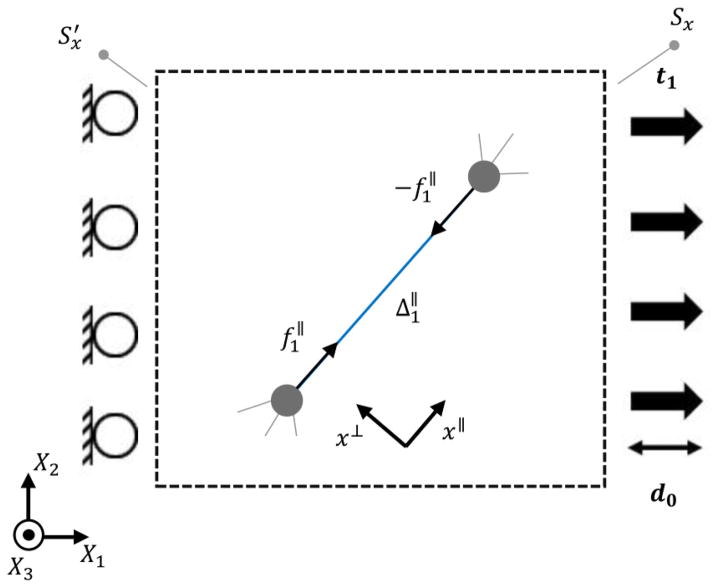
We modify the reference structure of state 0 by the addition of an element which has only a finite axial stiffness δ(EA)f, to generate state 1 of overall stiffness E1. We replace the effect of the added element by point forces of magnitude and express E1 in terms of E0 and . Then we replace the forces by the element and find E1 in terms of E0 and δ(EA)f.
As shown schematically in Fig. 7, state 1 can be constructed by adding a pair of equal and opposite forces to state 0. Consider that in state 0, before adding the two forces, the respective element would deform axially by an amount where and are the axial displacements of the two ends of the element in state 0. The addition of the force couple changes the boundary traction over Sx from t0 to t1. By applying the Maxwell-Betti’s reciprocal theorem (Maxwell, 1864) to the states 0 and 1 we can write
Fig. 7.
Schematic representation of state 1.
| (4) |
Clearly, the application of the forces leads to a new displacement field and a new elongation of the beam, denoted by . A similar state 2 can be defined by adding two similar forces of magnitude to state 0. Schematics of the considered element in states 0, 1 and 2 are shown in Similarly Maxwell-Betti’s reciprocal theorem applied to the states 1 and 2 gives:
| (5) |
Eqs. (4) and (5) and the counterpart of Eq. (4) applied to states 0 and 2 can be combined to obtain . This is an indication that the quantity is invariant of the magnitude of the applied loads f||. We denote this quantity by 1/C. It can be concluded that for a generic magnitude of forces f||, an elongation Δ|| results that is related to f|| by
| (6) |
We inquire now to what extent the overall stiffness of the structure changes when the axial stiffness of a given beam changes by δ(EA). As commonly done in elasticity, we represent an increase of stiffness with an effective pair of equal and opposite axial forces to map the problem to state 1 defined above. The magnitude of these forces is related to δ(EA) through where l0 is the original length of the beam. Combining this constitutive relation with Eq. (6) gives:
| (7) |
Eqs. (1), (4) and (7) can be combined to obtain the effective modulus:
| (8) |
It can be concluded that constant C must be non-negative because otherwise a stiffness value δ(EA)f can be found such that the second term on the right hand side of Eq. (8) diverges. This can also be concluded from the positive definiteness of the structural stiffness matrix.
Eq. (8) shows that increasing the axial stiffness of an element will increase the overall stiffness of the structure, as expected. It further shows that this dependence is concave, i.e.
| (9) |
These arguments hold for a spring network as well. In this case, the variation given to a specific spring element is δs, which is related to the variation of the axial stiffness as δs = δ(EA)f/l0. It is straightforward to show using the same procedure that in this case too: ∂2E/∂(δs)2 < 0.
4.2. Effect of the variation of the bending stiffness of a structural element on the global stiffness
In this section arguments similar to those in section 4.1 are provided to relate the variation of the global stiffness to the variation of the bending stiffness of a structural element.
Consider a linear elastic structure of beams in a loading state 0 as described in the beginning of section 4. Also consider that the bending of a generic linear beam loaded at its ends is described by two displacements and two rotations, u⊥, u′⊥, θ and θ′, which can be combined to compute the two effective rotation angles ϕ and ϕ′ defined as ϕ = θ − Δ⊥/l0 and ϕ′ = θ′ − Δ⊥/l0 where Δ⊥ = u′⊥ − u⊥.
Now consider a loading state 1 constructed by adding a moment M1 and two opposite forces to balance it with a magnitude acting perpendicular to the beam axis, at its ends. This state of loading is shown in Fig. 9(a). Using the equilibrium equation for the beam and the Maxwell-Betti’s theorem relating the states 0 and 1 it can be concluded that
Fig. 9.
Schematic of the decomposition of the general state of loading for a beam loaded at its ends. The blue curve shows a hypothetical deformed elastic beam, while the black (straight) curve shows the initial state of the beam. The two states of loading shown in (a) and (b) can be superimposed to construct state (c). Panels (a), (b) and (c) show the states of loading A, B and C, respectively.
| (10) |
As in section 4.1, if a different set of generalized forces, M2, and two opposing forces of magnitude are considered, a similar state 2 can be defined. Then Maxwell-Betti’s theorem can be written to relate the boundary tractions in the states 1 and 2 as
| (11) |
where and are the deformation angles at the start node of the beam associated with the applied loads of state 1 and 2.
Combining Eqs. (10) and (11) and the counterpart of Eq. (10) for comparing states 0 and 2 yields , which indicates that (ϕM − ϕ0)/M = C′ is invariant of the generalized loads applied. Consequently
| (12) |
The loading by M and the two balancing forces can be regarded as state A as shown in Fig. 9(a). The same argument holds if the same loads are applied to the other end of the beam. This can be regarded as state B as shown schematically in Fig. 9(b). We denote these generalized forces as M′, fM′ and −fM′. Similarly, the change in the deformation angle in the end node and the corresponding structural invariant can be denoted by ϕ′M′ and C″ respectively to obtain
| (13) |
The general state of loading of the beam may be represented as the superposition of the two states A and B as shown in Fig. 9(c).
It can be shown that states 0 and C are related through:
| (14) |
On the other hand the moments and deformation angles can be related using the Euler-Bernoulli beam theory (Love, 1944). For a beam of bending stiffness δ(EI)f loaded at its ends with M̂ and and two balancing forces and .
The beam is exerting moments M and M′ to the surrounding structure as generalized reaction forces in directions that are opposite to M̂ and . Application of the moments is accompanied by the application of reactions to the balancing forces. Now consider that the application of M̂ and and the balancing forces, state C, can results from the superposition of state A with M̂ and balancing forces only and another state B with and balancing forces only. State C can result by the superposition of states A and B. So ϕ = ϕM + ϕM′ and ϕ′ = ϕ′M + ϕ′M′ where ϕM′ and ϕ′M are the contribution from M′ to ϕ and from M to ϕ′ respectively. If we only consider the part of loads in state C that are present in state A we get
| (15) |
Similarly, considering only the part of loads in state C that are present in state B we get
| (16) |
The Eqs. (15) and (16) hold for any M and M′ in the state C.
We can represent the effect of a bending element with two moments M and M′ and two balancing forces f⊥ and −f⊥. The Eqs. (12) and (15) hold between M and ϕM in the general state of loading. The two equations can be used to eliminate ϕM to obtain
| (17) |
Similarly,
| (18) |
By replacing M and M′ from Eqs. (17) and (18) into Eq. (14) and substituting in Eq. (1), the overall stiffness can be expressed as
| (19) |
Constants C′ and C″ must be nonnegative to avoid the divergence of the two fractions in Eq. (19) for any value of δ(EI)f. Eq. (19) indicates that increasing the bending stiffness of an element of the structure leads to the increase of the overall stiffness as expected. Taking the second derivative with respect to δ(EI)f it is also observed that
| (20) |
4.3. Variation of the structural stiffness for a composite beam network
Now we can consider the more general case discussed in section 3 in which all elements of a beam structure, a random network in particular, have non-identical stiffness. This situation is treated as a small perturbation from the homogeneous case, in which all elements have the same stiffness.
We denote the axial or bending stiffness of element i by ki and group these variables in the vector k = {k1, k2, …, kNf} and express the network stiffness E as a function of k. In the homogeneous case vector k takes the constant value μ0 = {μ0, μ0, …, μ0} and the network has stiffness E(μ0) = E0. However in the general case where the ki’s are non-identical E(k) can be expanded in series about k = μ0 as
| (21) |
In section 3 softening is observed using replicas of ki values and one unique network geometry. Using replicas of ki a distribution of E is obtained. So it can be concluded that in all these replicas the expressions ∂E/∂ki and ∂2E/∂ki∂kj are the same at μ0. So they don’t change from replica to replica and are constants when averaging over replicas. Also the ki’s can be considered random variables sampled from independent and identical distributions. The mean and variance of these identical distributions can be denoted by μ0 and .
The variance of E can be computed using the series in Eq. (21). Retaining only the first order terms in (ki − μ0) and by averaging over the replicas of fiber stiffness distribution it can be concluded that
| (22) |
In other words
| (23) |
The mean of the distribution of E can also be computed using Eq. (21). Keeping in the expansion the terms up to the second order in (ki − μ0) and by averaging over replicas of fiber stiffness distribution it can be concludes that
| (24) |
which can be rearranged as
| (25) |
Since are constants for a unique network geometry,
| (26) |
The structures become softer on average if the Laplacian of E, , computed at μ0 is negative. Using the results of sections 4.1 and 4.2 it is possible to show that each term in this sum is negative.
It can be noted that the argument about softening does not hold for a set of axial elements connected in parallel in one dimension. In that case the constant C introduced in Eq. (6) is zero for each of the parallel elements. As a result, the Laplacian is zero in that case and the mean overall stiffness does not change.
Expressions (23) and (26) provide a theoretical explanation for the numerical results presented in Fig. 4 and are the main result of this article.
Taking a more general view, we expect the results presented here to hold for any property of a system composed from microstructural elements subjected to fluctuations, provided the constitutive behavior is linear and that the fluctuations are sufficiently small.
Conclusions
Composite fiber networks, i.e. structures made from fibers of multiple types, are studied in this work. We consider the case where the stiffness of individual fibers in the network is obtained from a distribution. It is observed that increasing the variability of the fiber stiffnesses leads to global, network stiffness reduction. Numerical simulations of random 3D Voronoi, 3D Delaunay and 2D Mikado networks show that microstructural stiffness variability reduces the overall network stiffness on average and the magnitude of the effect scales linearly with the variance of the fiber stiffness distribution. We prove these results analytically for a generic structure of fibers. We also show that the variance of the network stiffness scales linearly with the variance of the fiber stiffness and inversely with the number of elements in a network. We use numerical simulations to study the nonlinear deformation of the composite Voronoi networks. We observe that in the systems tested the softening effect induced by microstructural variability persists in the nonlinear deformation regime up to strains as high as 50%.
Fig. 8.
Schematic of a structural element in its local coordinates at different states of loading. l0 is the original length of the specified element. (a) The element before the structure is loaded. The element when the structure is loaded by (b) prescribing d0 (state 0) (c) prescribing d0 and two point forces of magnitudes (state 1) and (d) prescribing d0 and two point forces of magnitudes (state 2).
Acknowledgments
E.B. is grateful to Javad Heydari and Abouzar Ghavami at RPI for fruitful discussions and also Dan Fovargue, Lijuan Zhang and Ali Shahsavari at RPI for their help with the finite element simulations. We also gratefully acknowledge the financial support of the National Institute of Health (Grant Nos. RO1-EB005813 and U01-EB016638).
Footnotes
Throughout this text σ refers to standard deviation.
Publisher's Disclaimer: This is a PDF file of an unedited manuscript that has been accepted for publication. As a service to our customers we are providing this early version of the manuscript. The manuscript will undergo copyediting, typesetting, and review of the resulting proof before it is published in its final citable form. Please note that during the production process errors may be discovered which could affect the content, and all legal disclaimers that apply to the journal pertain.
References
- Arruda EM, Boyce MC. A three dimensional constitutive model for the large stretch behavior of rubber elastic materials. J Mech Phys Solids. 1993;41:389–412. doi: 10.1016/0022-5096(93)90013-6. [DOI] [Google Scholar]
- Bai M, Missel A, Klug W, Levine A. The mechanics and affine–nonaffine transition in polydisperse semiflexible networks. Soft Matter. 2011;7:907–914. doi: 10.1039/C0SM00496K. [DOI] [PubMed] [Google Scholar]
- Broedersz CP, Mao X, Lubensky TC, MacKintosh FC. Criticality and isostaticity in fibre networks. Nature Phys. 2011;7:983–988. doi: 10.1038/nphys2127. [DOI] [Google Scholar]
- Broedersz CP, Sheinman M, MacKintosh FC. Filament-Length-Controlled elasticity in 3D fiber networks. Phys Rev Lett. 2012;108:078102–078106. doi: 10.1103/PhysRevLett.108.078102. [DOI] [PubMed] [Google Scholar]
- Buxton G, Clarke N. “Bending to stretching” transition in disordered networks. Phys Rev Lett. 2007;98:238103–238106. doi: 10.1103/PhysRevLett.98.238103. [DOI] [PubMed] [Google Scholar]
- Cowin SC, Doty SB. Tissue mechanics. 2. Springer; New York: 2007. [DOI] [Google Scholar]
- Cox H. The elasticity and strength of paper and other fibrous materials. Brit J Appl Phys. 1952;3:72–79. doi: 10.1088/0508-3443/3/3/302. [DOI] [Google Scholar]
- Deshpande VS, Ashby MF, Fleck NA. Foam Topology Bending Versus Stretching Dominated Architectures. Acta Mater. 2001;49:1035–1040. doi: 10.1016/S1359-6454(00)00379-7. [DOI] [Google Scholar]
- Dirrenberger J, Forest S, Jeulin D. Towards gigantic RVE sizes for 3D stochastic fibrous networks. Int J Solids Struct. 2014;51:359–376. doi: 10.1016/j.ijsolstr.2013.10.011. [DOI] [Google Scholar]
- Fletcher DA, Mullins RD. Cell mechanics and the cytoskeleton. Nature. 2010;463:485–492. doi: 10.1038/nature08908. [DOI] [PMC free article] [PubMed] [Google Scholar]
- Flory PJ, Rehner J. Statistical mechanics of cross-linked polymer networks I. Rubberlike elasticity. J Chem Phys. 1943;11:512–520. doi: 10.1063/1.1723791. [DOI] [Google Scholar]
- Gardel ML, Shin JH, MacKintosh FC, Mahadevan L, Matsudaira P, Weitz DA. Elastic behavior of cross-linked and bundled actin networks. Science. 2004;304:1301–1305. doi: 10.1126/science.1095087. [DOI] [PubMed] [Google Scholar]
- Hatami-Marbini H, Shahsavari A, Picu RC. Multiscale modeling of semiflexible random fibrous structures. Comput-Aided Des. 2013;45:77–83. doi: 10.1016/j.cad.2011.10.002. [DOI] [Google Scholar]
- Head DA, Levine AJ, MacKintosh FC. Deformation of cross-linked semiflexible polymer networks. Phys Rev Lett. 2003;91:108102–108105. doi: 10.1103/PhysRevLett.91.108102. [DOI] [PubMed] [Google Scholar]
- Huisman EM, Heussinger C, Storm C, Barkema GT. Semiflexible filamentous composites. Phys Rev Lett. 2010;105:118101–118104. doi: 10.1103/PhysRevLett.105.118101. [DOI] [PubMed] [Google Scholar]
- James HM, Guth E. Theory of the elastic properties of rubber. J Chem Phys. 1943;11:455–481. doi: 10.1063/1.1723785. [DOI] [Google Scholar]
- Janmey P, Peetermans J, Zaner KS, Stossel TP, Takana T. Structure and mobility of actin filaments as measured by quasielastic light scattering, viscometry, and electron microscopy. J Biol Chem. 1986;261:8357–8362. [PubMed] [Google Scholar]
- Kallmes O, Corte H. The structure of paper, I. The statistical geometry of an ideal two dimensional fiber network. Tappi J. 1960;43:737–752. [Google Scholar]
- Kasza KE, Koenderink GH, Lin YC, Broedersz CP, Messner W, Nakamura F, Stossel TP, MacKintosh FC, Weitz DA. Nonlinear elasticity of stiff biopolymers connected by flexible linkers. Phys Rev E. 2009;79:041928–041932. doi: 10.1103/PhysRevE.79.041928. [DOI] [PubMed] [Google Scholar]
- Lee DH, Carnaby GA. Compressive energy of the random fiber assembly: Part I: Theory. Textile Res J. 1992;62:185–191. [Google Scholar]
- Licup AJ, Munster S, Sharma A, Sheinman M, Jawerth LM, Fabry B, Weitz DA, MacKintosh FC. Stress controls the mechanics of collagen networks. Proc Natl Acad Sci USA. 2015;112:9573–9578. doi: 10.1073/pnas.1504258112. [DOI] [PMC free article] [PubMed] [Google Scholar]
- Lieleg O, Claessens MA, Baush AS. Structure and dynamics of cross-linked actin networks. Soft Matter. 2010;6:218–225. doi: 10.1039/B912163N. [DOI] [Google Scholar]
- Linder C, Tkachuk M, Miehe C. A micromechanically motivated diffusion-based transient network model and its incorporation into finite rubber viscoelasticity. J Mech Phys Solids. 2011;59:2134–2156. doi: 10.1016/j.jmps.2011.05.005. [DOI] [Google Scholar]
- Lindström SB, Vader DA, Kulachenko A, Weitz DA. Biopolymer network geometries: Characterization, regeneration, and elastic properties. Phys Rev E. 2010;82:051905–051909. doi: 10.1103/PhysRevE.82.051905. [DOI] [PubMed] [Google Scholar]
- Love A. A treatise on the mathematical theory of elasticity. 4. Dover; New York: 2011. [Google Scholar]
- Maxwell JC. On the calculation of the equilibrium and stiffness of frames. Philos Mag. 1864;27:294–299. [Google Scholar]
- Miehe C, Göktepe S, Lulei F. A micro-macro approach to rubber-like materials—Part I: the non-affine micro-sphere model of rubber elasticity. J Mech Phys Solids. 2004;52:2617–2660. doi: 10.1016/j.jmps.2004.03.011. [DOI] [Google Scholar]
- Picu RC. Mechanics of random fiber networks—a review. Soft Matter. 2011;7:6768–6785. doi: 10.1039/C1SM05022B. [DOI] [Google Scholar]
- Raina A, Linder C. A homogenization approach for nonwoven materials based on fiber undulation and reorientation. J Mech Phys Solids. 2014;65:12–34. doi: 10.1016/j.jmps.2013.12.011. [DOI] [Google Scholar]
- Raub CB, Suresh V, Krasieva T, Lyubovitsky J, Mih JD, Putnam AJ, Tromberg BJ, George SC. Noninvasive assessment of collagen gel microstructure and mechanics using multiphoton microscopy. Biophys J. 2007;92:2212–2222. doi: 10.1529/biophysj.106.097998. [DOI] [PMC free article] [PubMed] [Google Scholar]
- Reddy C. Basic structure analysis. 3. Tata McGraw-Hill; New Delhi: 2001. [Google Scholar]
- Shahsavari A, Picu RC. Model selection for athermal cross-linked fiber networks. Phys Rev E. 2012;86:011923–011928. doi: 10.1103/PhysRevE.86.011923. [DOI] [PubMed] [Google Scholar]
- Shahsavari A, Picu RC. Elasticity of sparsely cross-linked random fibre networks. Philos Mag Lett. 2013;93:354–361. doi: 10.1080/09500839.2013.783241. [DOI] [Google Scholar]
- Shahsavari A, Picu RC. Exceptional stiffening in composite fiber networks. Phys Rev E. 2015;92:012401–012406. doi: 10.1103/PhysRevE.92.012401. [DOI] [PubMed] [Google Scholar]
- Tkachuk M, Linder C. The maximal advance path constraint for the homogenization of materials with random network microstructure. Philos Mag. 2012;92:2779–2808. doi: 10.1080/14786435.2012.675090. [DOI] [Google Scholar]
- Treloar LRG. The photoelastic properties of short-chain molecular networks. Trans Faraday Soc. 1954;50:881–896. doi: 10.1039/TF9545000881. [DOI] [Google Scholar]
- van Dillen TV, Onck P, van der Giessen E. Models for stiffening in cross-linked biopolymer networks: A comparative study. J Mech Phys Solids. 2008;56:2240–2264. doi: 10.1016/j.jmps.2008.01.007. [DOI] [Google Scholar]
- Wada H, Tanaka Y. Mechanics and size-dependent elasticity of composite networks. Europhys Lett. 2009;87:58001–58006. doi: 10.1209/0295-5075/87/58001. [DOI] [Google Scholar]
- Wu XF, Dzenis YA. Elasticity of planar fiber networks. J Appl Phys. 2005;98:093501–093509. doi: 10.1063/1.2123369. [DOI] [Google Scholar]
- Žagar G, Onck P, van der Giessen E. Two fundamental mechanisms govern the stiffening of cross-linked networks. Biophys J. 2015;108:1470–1479. doi: 10.1016/j.bpj.2015.02.015. [DOI] [PMC free article] [PubMed] [Google Scholar]


