Abstract
Purpose
We developed and evaluated the performance of a novel computer-based image analysis system for grading plus disease in retinopathy of prematurity (ROP), and identified the image features, shapes, and sizes that best correlate with expert diagnosis.
Methods
A dataset of 77 wide-angle retinal images from infants screened for ROP was collected. A reference standard diagnosis was determined for each image by combining image grading from 3 experts with the clinical diagnosis from ophthalmoscopic examination. Manually segmented images were cropped into a range of shapes and sizes, and a computer algorithm was developed to extract tortuosity and dilation features from arteries and veins. Each feature was fed into our system to identify the set of characteristics that yielded the highest-performing system compared to the reference standard, which we refer to as the “i-ROP” system.
Results
Among the tested crop shapes, sizes, and measured features, point-based measurements of arterial and venous tortuosity (combined), and a large circular cropped image (with radius 6 times the disc diameter), provided the highest diagnostic accuracy. The i-ROP system achieved 95% accuracy for classifying preplus and plus disease compared to the reference standard. This was comparable to the performance of the 3 individual experts (96%, 94%, 92%), and significantly higher than the mean performance of 31 nonexperts (81%).
Conclusions
This comprehensive analysis of computer-based plus disease suggests that it may be feasible to develop a fully-automated system based on wide-angle retinal images that performs comparably to expert graders at three-level plus disease discrimination.
Translational Relevance
Computer-based image analysis, using objective and quantitative retinal vascular features, has potential to complement clinical ROP diagnosis by ophthalmologists.
Keywords: computer-based image analysis, retinopathy of prematurity, machine learning
Introduction
Retinopathy of prematurity (ROP) is a leading cause of childhood blindness in the United States and throughout the world, and it is largely treatable with appropriate and timely diagnosis.1 In 2005, a revised international classification system was developed.2,3 The most critical parameter of this classification system is “plus disease,” defined as arterial tortuosity and venous dilation greater than that found in a standard published photograph. Furthermore, an intermediate “preplus disease” is defined as vascular abnormality that is less than that in the standard published photograph.3 Clinical studies have shown that infants with ROP and “plus disease” require treatment to prevent blindness, and infants with preplus disease require very close observation. Although it is essential to diagnose plus and preplus disease accurately, multiple studies have shown significant variability in clinical diagnosis, even among experts.4–7
Automated image analysis may improve the delivery and quality of ROP care. An automated grading scale could provide a more objective and consistent determination of plus disease and could be combined with telemedicine ROP screening programs to improve access to care in rural and less developed regions. Despite major advances in our understanding of ROP pathogenesis, risk factors, and treatment, the worldwide prevalence of disease is projected to rise due to increased survival of preterm infants, and to persistent challenges in ROP education.8–11 Telemedicine has been used to address these challenges in delivery of care, and computer-based image analysis could complement these systems.12–15
There have been numerous studies on computer-aided quantification of vascular features in ROP.13–15 However, previous studies have had several limitations: (1) Little work to our knowledge has focused on comparative analysis to identify image features that are most important for diagnosis.16,17 (2) Most previous studies have worked on two-level classification (plus versus not plus), and do not address preplus disease.13,14 (3) The “reference standards” for evaluation of computer systems have been very limited, often consisting of diagnosis by a single clinician. (4) There has been no standardization regarding which specific image sizes and vascular parameters should be measured (Patel SN, et al. IOVS. 2014;55:ARVO E-Abstract 5929).18 (5) The optimal method for combining quantitative parameters from multiple vessel segments is unknown. Most studies have used regular statistics (e.g., minimum, maximum, and median) of measured parameters (e.g., tortuosity, integrated curvature),14,15 but these statistics may provide biased estimates about disease severity since an image contains healthy and abnormal vessels. This study was designed to address all of these gaps in knowledge.
In this study, we evaluated the accuracy of plus and preplus diagnosis by computer-based image analysis (CBIA), compared to a reference standard defined by consensus of image reviews by three expert ROP image graders combined with the clinical diagnosis by ophthalmoscopy. Images were cropped to different sizes and shapes for analysis, and the diagnostic impact of analyzing arteries, veins, and all vessels together was examined. We propose a novel feature representation scheme using Gaussian Mixture Models (GMM) to separate out the signal from normal and abnormal vessels to determine whether there might be improved diagnostic performance. We identified the highest performing image analysis system, which we have named the i-ROP system.
Methods
This study was approved by the Institutional Review Board at Oregon Health & Science University, and followed the tenets of the Declaration of Helsinki.
Reference Standard Diagnosis
We acquired 77 wide-angle retinal images during routine clinical care and they were independently graded by three expert ROP graders (MFC, RVPC, SO) as plus, preplus, or normal, and compared to the clinical diagnosis. Images were selected to represent a typical clinical distribution of disease severity, with most images in the “normal” range. Two graders (MFC, RVPC) were experienced clinicians in ROP, and the third (SO) was an experienced ROP study coordinator. When all four grades were concordant, the grade was taken as the reference standard. When there were discordant grades among experts, or between the clinical diagnosis and the experts, these were adjudicated by consensus of the three experts using methods described previously,19 to determine the reference standard.
Image Preparation
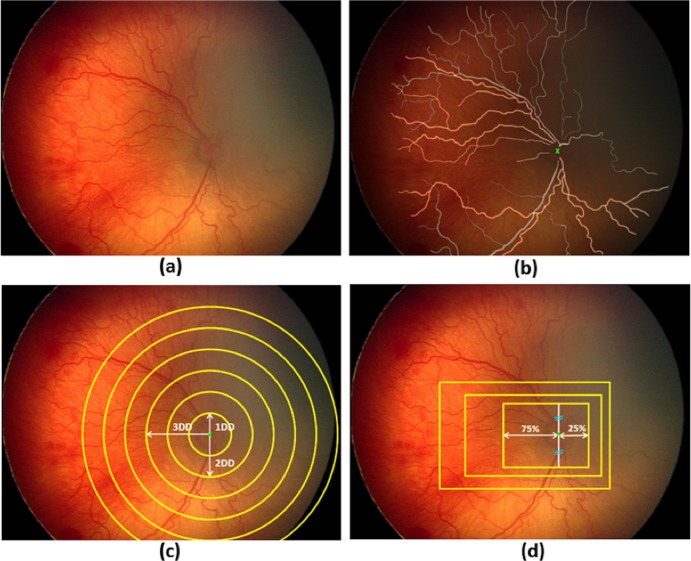
Using graphics editing software (Photoshop CS5; Adobe Systems, San Jose, CA), a “mask” outlining each vessel was created manually for each retinal image, and each vessel was classified as either an artery or vein by author consensus. For quantitative analysis, images then were cropped into two shapes (rectangle or circle) of a range of sizes based on methodology described previously (Patel SN, et al. IOVS. 2014;55:ARVO E-Abstract 5929).20 The segmentation and cropping processes are illustrated in Figure 1.
Figure 1.
Illustration of manual mask generation and cropping processes: (a) original retinal image, (b) mask for manually segmented arteries (yellow) and veins (gray) overlaid on the original image. Optic disc (OD) center is marked with a green “x”, (c) generation of circular crops where each circle is centered at the OD center with diameters ranging from 1 to 6 disc diameters (DD), and (d) generation of rectangular crops maintaining an aspect ratio of 3 × 4 DD. Rectangles were drawn to capture more temporal (75%) than nasal (25%) vessels. Superior and inferior vessels were captured equally.
i-ROP System Development
Manually segmented images were fed into the image processing system to obtain an automated diagnosis. The procedure consisted of 3 stages: (1) preprocessing images to extract vessel centerlines and construct the vasculature tree, (2) extracting image features that account for tortuosity and dilation, and (3) building an automated diagnosis system to classify images using the extracted features (Fig. 2).
Figure 2.
Computer-based image analysis system overview. The masks generated by manual segmentation were preprocessed to find the centerlines and construct the vascular tree. The tree and the manual mask then were fed into the feature extraction module, which outputs segment-based and point-based features quantifying vascular tortuosity and dilation. Given these features, a classification system was built to identify each image as plus, preplus, or normal.
Preprocessing
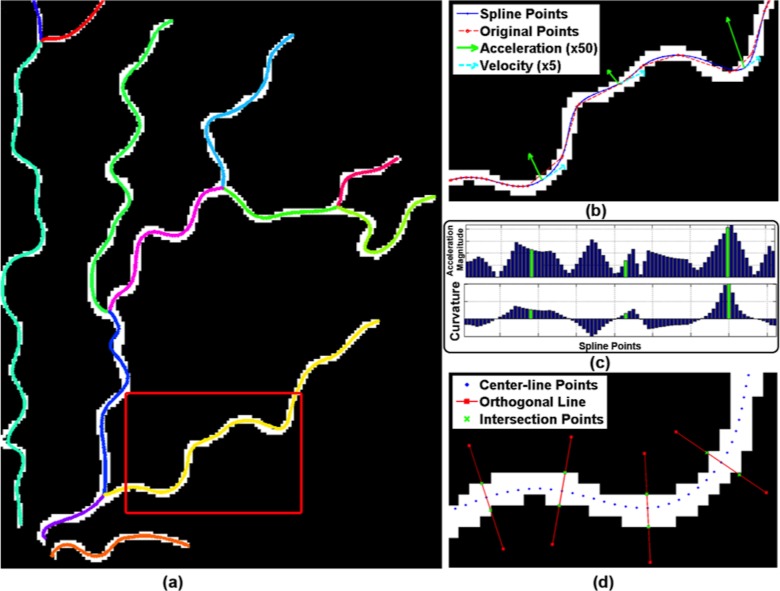
Preprocessing was performed using previously described methods.21 The vasculature structure was represented as a tree of vessel segments, where a “segment” is defined as a curvilinear structure between two junction points, or between a junction point and an endpoint. We then fitted cubic splines to the segments to provide a smoothed continuous line along each vessel segment, from which we sampled points at equidistant intervals along the length of the vessel. The final representation of the tree was composed of these sampled points (Figs. 3a, 3b).
Figure 3.
Preprocessing and feature extraction: (a) the resulting vasculature tree after preprocessing is overlaid on manual segmentation. Centerlines of each vessel segment are smoothed by cubic splines and displayed with different colors. (b) Original center-line points (red) and spline fitted points (blue) are displayed for part of an example vessel segment shown in red rectangle in (a). Velocity and acceleration vectors also are displayed in green and cyan, respectively, for some example points. Note that as tortuosity increases, the magnitude of acceleration vector increases. (c) Bar plot of acceleration magnitude and curvature values computed for the points displayed in (b). The points where green acceleration vectors are displayed in (b) are shown with corresponding green bars in the graph. (d) Diameter for a center-line point is computed by drawing an orthogonal line (red lines) and finding its intersection (green crosses) with the vessel boundary. This is illustrated for some sample points.
Feature Extraction
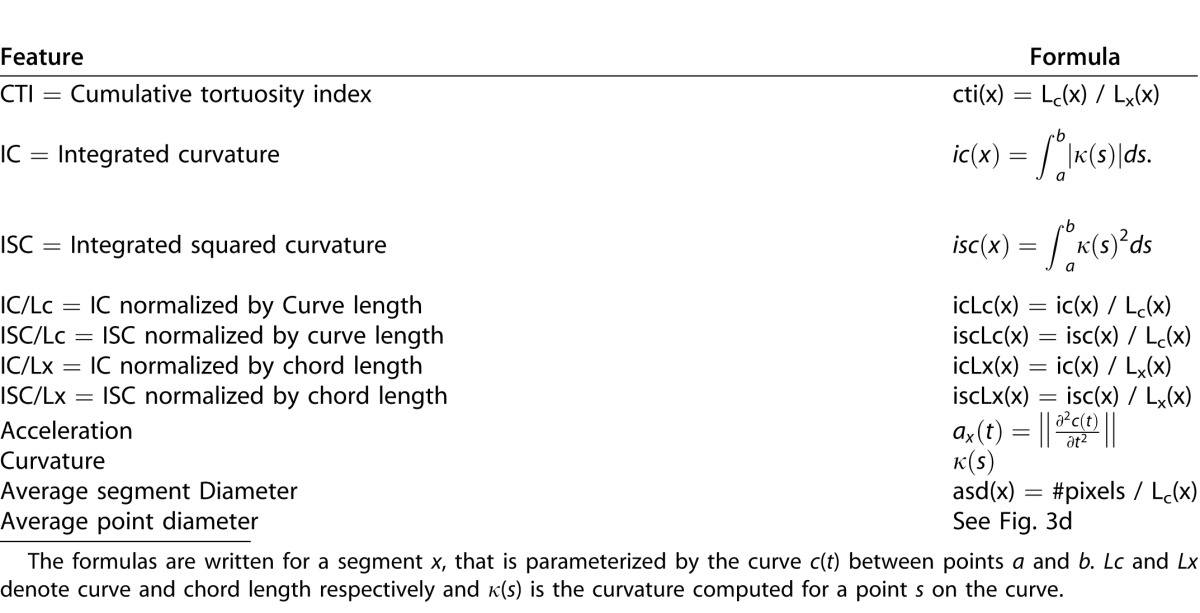
We defined and extracted 11 features that quantify either tortuosity or dilation and that have been described in the literature (Table 1).14,22,24 Tortuosity features were extracted using methods described previously.23 Average segment diameter and average point diameter were computed to quantify dilation (Table 1, Fig. 3d). These features are divided into two groups depending on where the feature is computed: segment-based and point-based features, and were analyzed separately for arteries and/or veins.
Table 1.
List of Extracted Features
Following an expectation maximization procedure designed to learn parameters of statistical models, we fit two component Gaussian Mixture Models (GMMs) to the pool of numbers { f1, f2, … fN} for each image feature, expecting to model healthy and abnormal vessels in different components. The probability of f being from this pool of numbers was defined as:
 |
where the ith component is characterized by weight  , and
, and  denotes the normal distribution with mean
  and variance
  . Each image then was represented with the parameters of the GMM:
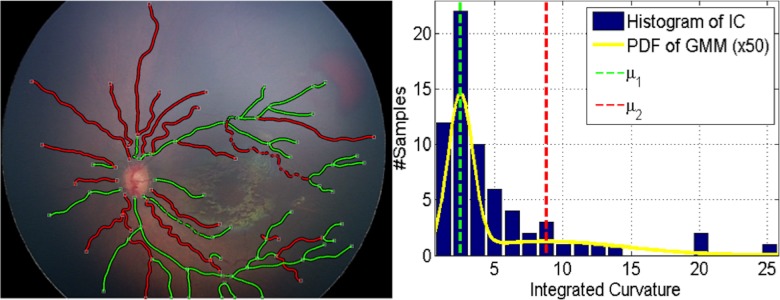
  . As seen in Figure 4, when we clustered the vessel segments based on the likelihoods we get from the two-component GMM, the segments can be divided into two groups: one group with highly tortuous vessels and the other group with more straight vessels. This procedure helped us represent the image-features extracted from a vasculature structure as a probability distribution (with two components, respectively representing the straight and tortuous segments) rather than a set of values coming from regular statistics, such as mean and median.
Figure 4.
Clustering of vessel segments based on the GMM on integrated curvature (IC) feature for an example image. In the left, white squares indicate the junction/end points of vessels. Each segment is shown with its corresponding cluster color. Right figure displays the histogram of the IC feature for that image, along with the GMM. The yellow line indicates the probability density function (PDF) of all the segments. The mean of each mixture component is shown with dashed lines with its respective color.
Classification
To build a CBIA system that accurately classified images as plus, preplus, or normal, we wanted to see whether images with similar feature distributions were more likely to be classified in the same class (i.e., plus, preplus, normal) by an expert. We computed the similarity between two images based on the distance between their distributions. The Euclidean distance between the GMM distributions of image j and image k was computed as:
 |
where pj and pk represent the distributions of the images as indicated in Equation 1. Thus the similarity between them was defined as  .
.
We used this similarity definition as a kernel in training Support Vector Machine (SVM) classifiers that are designed to optimize the margin between samples of different classes.25 The kernel definitions determine what kind of similarity will be used between samples when the decision margin is being optimized. We trained separate classifiers for each crop shape, crop size, feature combination, and vessel type. We identified the highest performing classification system as our i-ROP system for performance evaluation and validation.
Performance Evaluation
We followed a k-fold cross-validation procedure for evaluating performance of the i-ROP system. The goal of cross validation is to assess the accuracy of a predictive model by checking how well it generalizes to previously unseen data. In this procedure, the dataset was divided into k disjoint folds (in this case 10). For each fold, the classifier was trained using the samples in the remaining k-1 folds. Then, the diagnosis for each sample in the selected fold was determined using the trained classifier. The accuracy of the fold was computed as the percentage of correctly classified samples in the fold. Then, the average of all accuracy values was reported as the estimated performance of the i-ROP system.
To compare the performance of the system with the performance of the experts, the accuracy for each expert as well as the confusion matrix was computed. As ROP diagnosis involves a high degree of interexpert variability, we also computed percentage agreement and Kappa statistics between pairs of experts to give a sense of the amount of interexpert variability in our dataset.26 To provide a reference with a group of “nonexperts,” a subset of 22 of the original 77 images were separately graded by 31 ophthalmology trainees from the United States and Canada for comparison. Mean accuracy of this group was compared to the i-ROP system and the experts.
Multidimensional Scaling (MDS)
In this work, each image was represented with the GMM distribution of its image features, which is different than the traditional approach of representing the image with a single statistic (e.g., mean tortuosity, maximum dilation). Using simple descriptive statistics, one can compare directly the tortuosity or dilation between two images. To perform the same comparison with the proposed similarity measure and illustrate its efficiency, we performed nonlinear dimensionality reduction on the distance matrix that was used in the i-ROP system. We reduced the samples into a 1-dimensional space following MDS, which is a commonly used technique in pattern recognition.31 Multidimensional scaling produced the new coordinates that best preserved the given pairwise distances between images. Similar to representing the image with simple statistics, the coordinates of the images in this reduced dimension can be seen as an index to compare the amount of tortuosity/dilation between them.
Results
Reference Standard Diagnosis
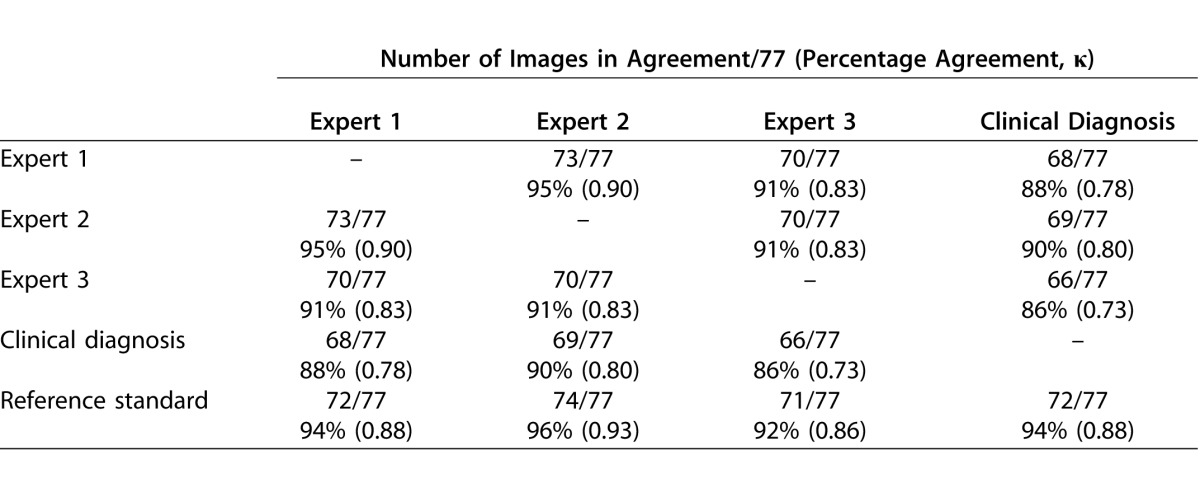
The dataset consisted of 77 wide-angle retinal images, which were graded as 14 plus, 16 preplus, and 47 normal images through the reference standardization process. Table 2 displays the pairwise diagnostic agreement among experts, the clinical diagnosis as determined by the original treating physician, and the reference standard.
Table 2.
Percentage Agreement (and Kappa Statistics) Between Pairs of Experts, the Original Clinical Diagnosis, and Reference Standard
Impact of Feature Extraction Method and Vessel Type
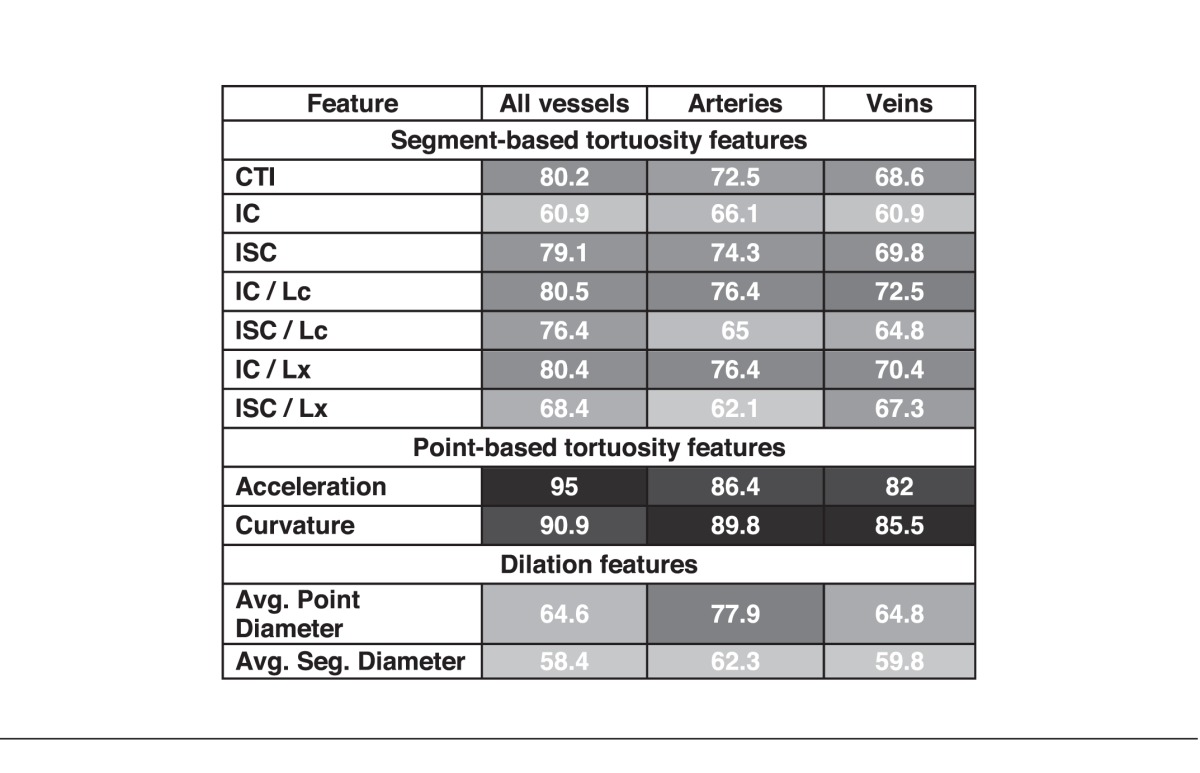
Table 3 reports the accuracy of the classifiers by image feature formula and vessel type (arteries only, veins only, and arteries and veins). Of all of the comparisons, the highest performance was achieved for the measurement of acceleration in a 6DD circular crop considering all vessels combined and performed with 95% accuracy compared to the reference standard. We defined this as the i-ROP system.
Table 3.
Automatic Diagnosis Results for All Image Features When Features are Extracted From Veins, Arteries, or Both Arteries and Veins Together (Units are Percent Agreement With Reference Standard; Darker Box Shading Corresponds to Higher Diagnostic Performance)
Performance of the i-ROP System
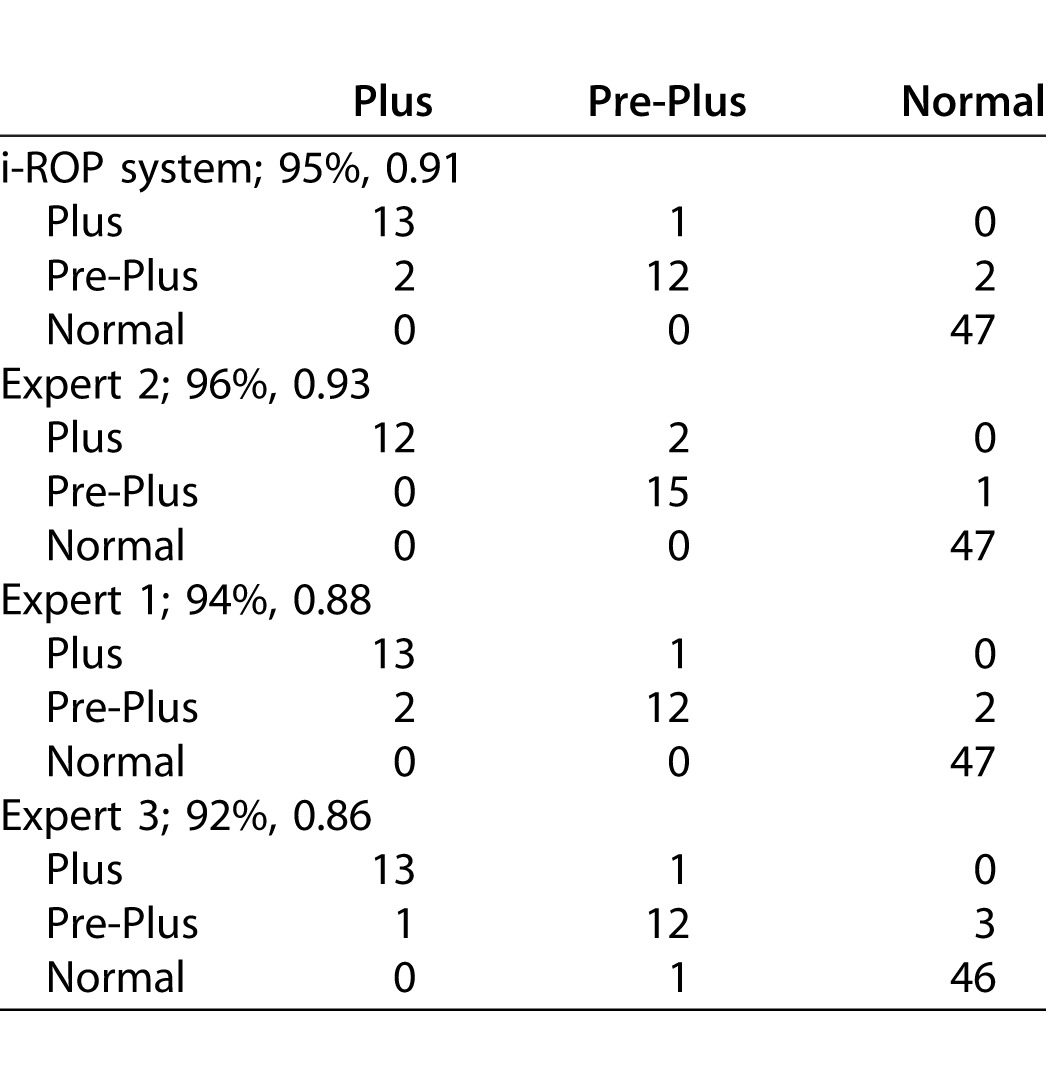
This system agreed with the reference standard diagnosis in 73/77 (95%) images. In comparison, the accuracies of the 3 experts compared to the reference standard were 72/77 (94%), 74/77 (96%), and 71/77 (92%).
To consider this in another way, the number of “misclassifications” by the i-ROP system was comparable to that of the experts. This is shown in Table 4, which displays the confusion matrices, as well as the percent agreement and kappa statistic for the i-ROP system and the three experts compared to the reference standard diagnosis. The i-ROP system had 5 misclassifications (of 77 possible) versus the reference standard, compared to 5 for Expert 1, 3 for Expert 2, and 6 for Expert 3. Sensitivity of the i-ROP system for detecting preplus or worse disease was 29/30 (97%), compared to 28/30 (93%) for Expert 1, 29/30 (97%) for Expert 2, and 27/30 (90%) for Expert 3. Sensitivity of the i-ROP system for detecting plus disease was 13/14 (93%), compared to 13/14 (93%) for Expert 1, 12/14 (86%), for Expert 2, and 13/14 (93%) for Expert 3.
Table 4.
Confusion Matrices for I-ROP System and All Experts (Percentage Agreement with Reference Standard Diagnosis, Kappa)
In comparison, a group of 31 nonexperts (United States and Canadian ophthalmology trainees) were shown a subset of 22 of the original 77 images for classification. The overall mean classification accuracy of the group was 81%. Within that subset, 7/22 images were graded as preplus or plus by the reference standard. The mean sensitivity of the group at detecting preplus or worse disease was 85%, and the mean sensitivity of nonexperts for detecting plus disease was 87%.
Efficiency of the GMM-Based Similarity Measure in Comparing Pairwise Image Tortuosity
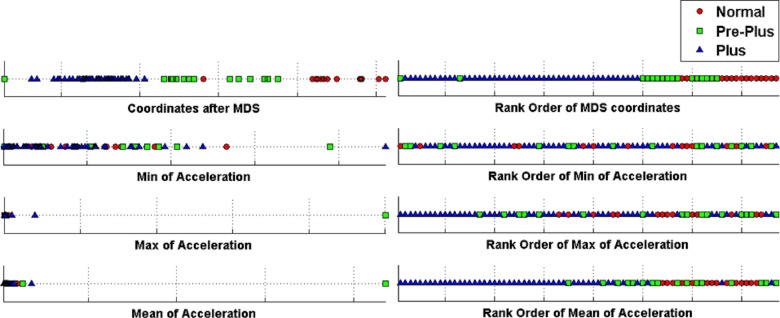
Figure 5 displays the resulting 1-dimensional coordinates after MDS. For comparison purposes, we also showed the minimum, maximum, and mean of the acceleration point estimates. The MDS coordinates illustrate the superior classification efficiency of the GMM compared to the descriptive statistics. In the right panel of Figure 5, we ordered the coordinates and plotted the rank order. The minimum and maximum value of “acceleration” provided poor disease discrimination. Mean acceleration was generally able to discriminate well between normal and plus (two level discrimination), but performed poorly at three level discrimination incorporating preplus classification. The rank order of the MDS coordinates for acceleration was very good at three-level discrimination.
Figure 5.
Results of nonlinear dimensionality reduction by applying MDS on GMM-based distance (top) and regular statistics (minimum, maximum, mean) of the acceleration feature. Left shows the 1-D MDS coordinates and the minimum, maximum, and mean of acceleration respectively. Right shows the rank of image when it is ordered based on corresponding MDS coordinate or acceleration statistic.
Discussion
This is the first study, to our knowledge, that has performed a comprehensive analysis of the impact of image and vessel feature analysis, as well as crop size and shape, affecting the performance of a CBIA system for evaluation of plus disease in ROP. Historically, CBIA system development for ROP has been challenging in part due to poor interexpert agreement and imperfect reference standards.14 Therefore, strengths of the current analysis are the rigorous process used to create the reference standard, and the high interexpert agreement at three-level classification (Table 2).19
Key study findings are: (1) The i-ROP system performs as well as expert image readers, when provided with manually segmented images, (2) the performance of our CBIA system was maximized with larger image crop sizes, and when arteries and veins were analyzed together, and (3) among 11 vascular features analyzed, the point-based tortuosity features of acceleration and curvature performed better than the segment-based or dilation features.
i-ROP System Performance
There are several key advantages between the i-ROP system and previously-reported systems.6,7 First, most previous CBIA systems6,7 have focused on two-level classification (i.e., plus versus not plus) which is easier to develop compared to three-level classification (plus, preplus, normal) systems, in part because of poor interexpert agreement at three-level classification.14 Using the i-ROP system, there were no normal images classified as having plus disease and no plus disease images classified as normal (Table 4). At three-level classification our i-ROP system was 95% accurate, performing as well as (or better than) any of the individual experts. While it is challenging to directly compare the performance of the i-ROP system to prior CBIA systems due to different reference standards, classification levels, and performance measures, no prior system has performed as well as the human experts it was compared against at three level classification.14 Wittenberg et al.14 recently reviewed the four most well characterized CBIA systems, two of which demonstrated >90% sensitivity for the detection of plus disease (with moderate specificity) at two-level classification.
Second, previous studies have not used a cross-validation procedure. This cross-validation procedure increases the generalizability of the performance of this system to other datasets, though this was not tested directly in this analysis. Lastly, previous studies used a simple threshold-based classification using mean and maximum of the extracted image features on smaller datasets.14 Instead, we used GMM-based feature representation that is shown to perform better than using regular statistics of image features in classification.23
Implications for Future Automated CBIA System Development
The finding that the performance of the system was maximized when arteries and veins were analyzed together is advantageous, as accurate separation of arteries and veins has proven quite challenging for human and automated grading systems.15,27–30 Additionally, the observation that the point-based features of acceleration and curvature outperformed segment-based features may suggest that the i-ROP system may perform similarly without requiring manually segmented images as inputs. This may be due to the fact that GMM fitting can be more robust with point-based features, since the number of vessel points is much larger than the number of vessel segments in an image.
Implications for Expert Diagnosis
The i-ROP system was trained against a reference standard consisting of the consensus diagnosis of 3 experts and the clinical diagnosis. Therefore, the performance of image features, vessel selection, and crop size has implications as to what features the experts are considering in the diagnosis of plus disease. Full exploration of these implications is beyond the scope of this report, but these findings suggest that experts may consider tortuosity more than dilation, may consider nonstandard features, such as venous tortuosity, as well as use information from outside of the most posterior vessels.32,33
Limitations
There are several potential limitations to this study: (1) We used manually-segmented images with a tracing algorithm to avoid the possible noise and bias that might come from an automated segmentation algorithm. Therefore, it is not possible to determine how the system would have performed using a completely automated segmentation algorithm, which limits the immediate clinical applicability of these findings. (2) This analysis was limited to images that were of sufficient quality for grading and computer-based modeling. In the real-world, there can be technical and anatomic obstacles to producing gradable images. Overcoming these obstacles was not the focus of this analysis, but also will be necessary for large-scale implementation of future automated systems. (3) Since our aim was to perform a comparison between image features, the proposed i-ROP system only used a single image feature. Training a classifier using more features might create an even more precise system and fusing multiple classifiers, each of which is trained on different image features, or training classifiers using multiple image features, as has been done before with prior CBIA systems, are important potential extensions of this work.34 (4) Though we used a cross-validation procedure to maximize generalizability to other datasets, an important next step of this work will be to validate it using completely separate images.
Future Applications
The development of accurate computer-based automated grading systems could eventually complement the subjective clinician grading of plus disease with a more objective metric, and improve the reliability of plus disease recognition. Additionally, an automated system could be incorporated into the expanding sphere of telemedicine for the diagnosis of ROP in regions where human resources are scarce. The results of this study suggest that with the right inputs, a trained CBIA system, such as the proposed i-ROP system can perform as well as experts. The main future application will be to fully automate the i-ROP system, which would have important implications for improving the care of infants with ROP around the world.
Acknowledgments
This work is being published on behalf of the i-ROP research consortium: Oregon Health & Science University (Portland, OR): Michael F. Chiang, MD, Susan Ostmo, MS, Kemal Sonmez, PhD, J. Peter Campbell, MD, MPH. Cornell University (New York, NY): RV Paul Chan, MD, Karyn Jonas, RN. Columbia University (New York, NY): Jason Horowitz, MD, Osode Coki, RN, Cheryl-Ann Eccles, RN, Leora Sarna, RN. Bascom Palmer Eye Institute (Miami, FL): Audina Berrocal, MD, Catherin Negron, BA. William Beaumont Hospital (Royal Oak, MI): Kimberly Denser, MD, Kristi Cumming, RN, Tammy Osentoski, RN, Tammy Check, RN. Children's Hospital Los Angeles (Los Angeles, CA): Thomas Lee, MD, Evan Kruger, BA, Kathryn McGovern, MPH. Cedars Sinai Hospital (Los Angeles, CA): Charles Simmons, MD, Raghu Murthy, MD, Sharon Galvis, NNP. LA Biomedical Research Institute (Los Angeles, CA): Jerome Rotter, MD, Ida Chen, PhD, Xiaohui Li, MD, Kaye Roll, RN. Massachusetts General Hospital (Boston, MA): Jayashree Kalpathy-Cramer, PhD. Northeastern University (Boston, MA): Deniz Erdogmus, PhD. Asociacion para Evitar la Ceguera en Mexico (APEC) (Mexico City): Maria Ana Martinez-Castellanos, MD, Samantha Salinas-Longoria, MD, Rafael Romero, MD, Andrea Arriola, MD.
M.F. Chiang is supported by NIH grant EY19474 from the National Institutes of Health, Bethesda, MD. M.F. Chiang and J.P. Campbell are supported by grant P30 EY010572 from the National Institutes of Health (Bethesda, MD), and by unrestricted departmental funding from Research to Prevent Blindness (New York, NY). J. Kalpathy-Cramer and M.F. Chiang are supported by NIH grant EY22387. R.V.P. Chan is supported by the St. Giles Foundation, the Bernadotte Foundation for Children's Eyecare, Novartis Excellence in Ophthalmic Vision Award – XOVA, unrestricted departmental funding from Research to Prevent Blindness, and the iNsight Foundation.
Disclosure: E. Ataer-Cansizoglu, None; V. Bolon-Canedo, None; J.P. Campbell, None; A. Bozkurt, None; D. Erdogmus, None; J. Kalpathy-Cramer, None; S. Patel, None; K. Jonas, None; R.V.P. Chan, None; S. Ostmo, None; M.F. Chiang, Unpaid member of the Scientific Advisory Board for Clarity Medical Systems (Pleasanton, CA)
References
- 1. Gilbert C,, Foster A. Childhood blindness in the context of VISION 2020: the right to sight. Bull World Health Organ. 2001; 79: 227–232. [PMC free article] [PubMed] [Google Scholar]
- 2. The Committee for the Classification of Retinopathy of Prematurity. An international classification of retinopathy of prematurity. Arch Ophthalmol. 1984; 102: 1130–1134. [DOI] [PubMed] [Google Scholar]
- 3. The Committee for the Classification of Retinopathy of Prematurity. The international classification of retinopathy of prematurity revisited. Arch Ophthalmol. 2005; 123: 991–999. [DOI] [PubMed] [Google Scholar]
- 4. Chiang MF,, Jiang L,, Gelman R,, Du Y. Inter expert agreement of plus disease diagnosis in retinopathy of prematurity. Arch Ophthalmol. 2007; 125: 875–880. [DOI] [PubMed] [Google Scholar]
- 5. Wallace D,, Quinn G,, Freedman S,, Chiang MF. Agreement among pediatric ophthalmologists in diagnosing plus and pre-plus disease in retinopathy of prematurity. J AAPOS. 2008; 12: 352–356. [DOI] [PMC free article] [PubMed] [Google Scholar]
- 6. Koreen S,, Gelman R,, Martinez-Perez ME,, et al. Evaluation of a computer-based system for plus disease diagnosis in retinopathy of prematurity. Ophthalmology. 2007; 114: e59–e67. [DOI] [PubMed] [Google Scholar]
- 7. Gelman R,, Jiang L,, Du YE,, Martinez-Perez ME,, Flynn JT,, Chiang MF. Plus disease in retinopathy of prematurity: pilot study of computer-based and expert diagnosis. J Am Assoc Ped Ophthalmol Strabismus. 2007; 11: 532–540. [DOI] [PMC free article] [PubMed] [Google Scholar]
- 8. Sommer A,, Taylor HR,, Ravilla TD,, West, Sheila,, et al. Challenges of ophthalmic care in the developing world. JAMA Ophthalmol. 2014; 132: 640–644. [DOI] [PMC free article] [PubMed] [Google Scholar]
- 9. Chan RV,, Williams SL,, Yonekawa Y,, Weissgold DJ,, Lee TC,, Chiang MF. Accuracy of retinopathy of prematurity diagnosis by retinal fellows. Retina 2010; 30: 958–965. [DOI] [PMC free article] [PubMed] [Google Scholar]
- 10. Myung JS,, Chan RV,, Espiritu MJ,, et al. Accuracy of retinopathy of prematurity image-based diagnosis by pediatric ophthalmology fellows: implications for training. J AAPOS 2011; 15: 573–578. [DOI] [PMC free article] [PubMed] [Google Scholar]
- 11. Wong RK,, Ventura CV,, Espiritu MJ,, et al. Training fellows for retinopathy of prematurity care: a web-based survey. J AAPOS 2012; 16: 177–181. [DOI] [PMC free article] [PubMed] [Google Scholar]
- 12. Fierson WM,, Capone AJ. Telemedicine for evaluation of retinopathy of prematurity. Pediatrics. 2014; 135e238–e254. [DOI] [PubMed]
- 13. Wallace DK. Computer-assisted quantification of vascular tortuosity in retinopathy of prematurity (an American Ophthalmological Society thesis). Trans Am Ophthalmol Soc. 2007; 105: 594–615. [PMC free article] [PubMed] [Google Scholar]
- 14. Wittenberg LA,, Jonsson NJ,, Chan RVP,, Chiang MF. Computer-based image analysis for plus disease diagnosis in retinopathy of prematurity. J AAPOS. 2012; 49: 11–16. [DOI] [PMC free article] [PubMed] [Google Scholar]
- 15. Wilson CM,, Cocker KD,, Moseley MJ,, et al. Computerized analysis of retinal vessel width and tortuosity in premature infants. Invest Ophthalmol Vis Sci. 2008; 49: 3577–3585. [DOI] [PubMed] [Google Scholar]
- 16. Ataer-Cansizoglu E,, You S,, Kalpathy-Cramer J,, Keck KM,, Chiang MF,, Erdogmus D. Observer and feature analysis on diagnosis of retinopathy of prematurity. IEEE Int Workshop Mac Learn Signal Process. 2012: 1–6. [DOI] [PMC free article] [PubMed]
- 17. Ataer-Cansizoglu E,, Kalpathy-Cramer J,, You S,, Keck KM,, Erdogmus D,, Chiang MF. Analysis of underlying causes of inter-expert disagreement in retinopathy of prematurity diagnosis: Application of machine learning principles. Methods Inf Med. 2015; 54 (1): 93–102. [DOI] [PubMed] [Google Scholar]
- 18. Keck KM,, Kalpathy-Cramer J,, Ataer-Cansizoglu E,, You S,, Erdogmus D,, Chiang MF. Plus disease diagnosis in retinopathy of prematurity: vascular tortuosity as a function of distance from optic disc. Retina. 2013; 33: 1700–1707. [DOI] [PMC free article] [PubMed] [Google Scholar]
- 19. Ryan MC,, Ostmo S,, Jonas K,, et al. Development and evaluation of reference standards for image-based telemedicine diagnosis and clinical research studies in ophthalmology. AMIA Ann Symp Proc. 2014; 2014: 1902–1910. [PMC free article] [PubMed] [Google Scholar]
- 20. De Silva DJ,, Cocker KD,, Lau G,, et al. Optic disk size and optic disk-to-fovea distance in preterm and full-term infants. Invest Ophthalmol Vis Sci. 2006; 47: 4683–4686. [DOI] [PubMed] [Google Scholar]
- 21. Bas E,, Ataer-Cansizoglu E,, Kalpathy-Cramer J,, Erdogmus D. Retinal vasculature segmentation using principal spanning forests. Int Symp Biomed Imaging. 2012: 1792–1795.
- 22. Grisan E,, Foracchia M,, Ruggeri A. A novel method for the automatic evaluation of retinal vessel tortuosity. IEEE Trans Med Imaging. 2008; 27: 310–319. [DOI] [PubMed] [Google Scholar]
- 23. Bolon-Canedo V,, Ataer-Cansizoglu E,, Erdogmus D,, Kalpathy-Cramer J,, Chiang MFA. GMM-based feature extraction technique for the automated diagnosis of retinopathy of prematurity. Int Symp Biomed Imaging. 2015: 1498–1501.
- 24. Davitt BV,, Wallace DK. Plus disease. Surv Ophthalmol. 2009; 54: 663–670. [DOI] [PubMed] [Google Scholar]
- 25. Duda RO,, Hart PE,, Stork DG. Pattern Classification 2nd ed. New York, NY: John Wiley & Sons; 2011: 259–265. [Google Scholar]
- 26. Cohen JA. Coefficient of agreement for nominal scales. Educ Psychol Meas. 1960; 20: 37–46. [Google Scholar]
- 27. Wilson CM,, Wong K,, Ng J,, Cocker KD,, Ells AL,, Fielder AR. Digital image analysis in retinopathy of prematurity: a comparison of vessel selection methods. J AAPOS. 2012; 16: 223–228. [DOI] [PubMed] [Google Scholar]
- 28. Tramontan L,, Poletti E,, Fiorin D,, Ruggeri A. A web-based system for the quantitative and reproducible assessment of clinical indexes from the retinal vasculature. IEEE Trans Biomed Eng. 2011; 58: 818–821. [DOI] [PubMed] [Google Scholar]
- 29. Johnston SC,, Wallace DK,, Freedman SF,, Yanovitch TL,, Zhao Z. Tortuosity of arterioles and venules in quantifying plus disease. J AAPOS. 2009; 13: 181–185. [DOI] [PubMed] [Google Scholar]
- 30. Perez-Rovira A,, MacGillivray T,, Trucco E,, et al. VAMPIRE: Vessel assessment and measurement platform for images of the retina. Int Conf IEEE Eng Med Biol Soc. 2011: 3391–3394. [DOI] [PubMed]
- 31. Kruskal JB. Multidimensional scaling by optimizing goodness of fit to a nonmetric hypothesis. Psychometrika. 1964; 29: 1–27. [Google Scholar]
- 32. Rao R,, Jonsson NJ,, Ventura C,, et al. Plus disease in retinopathy of prematurity: diagnostic impact of field of view. Retina. 2012; 32: 1148–1155. [DOI] [PMC free article] [PubMed] [Google Scholar]
- 33. Hewing NJ,, Kaufman DR,, Chan RP,, Chiang MF. Plus disease in retinopathy of prematurity: qualitative analysis of diagnostic process by experts. JAMA Ophthalmol. 2013; 131: 1026–1032. [DOI] [PMC free article] [PubMed] [Google Scholar]
- 34. Cabrera MT,, Freedman SF,, Kiely AE,, Chiang MF,, Wallace DK. Combining ROPtool measurements of vascular tortuosity and width to quantify plus disease in retinopathy of prematurity. J AAPOS. 2011; 15: 40–44. [DOI] [PMC free article] [PubMed] [Google Scholar]


