Abstract
Background & objectives:
Elevated blood pressure (BP) in the young predicts serious cardiovascular events in the adults. High prevalence of adult hypertension reported from Assam, North East (NE) India may be linked with elevated blood pressure in the childhood. The present study was an attempt to describe the distribution of BP and correlates of hypertension in children aged 5-14 yr.
Methods:
A total of 10,003 school children from 99 schools of Dibrugarh district, Assam, NE India, were surveyed by stratified random cluster method. Blood pressure, demographic and anthropometric information were recorded. Blood pressure was categorized in to normal, prehypertension, stage I and stage II hypertension.
Results:
Girls had significantly higher (104.2 ± 12.0 vs. 103.2 ± 11.6 mm Hg, P<0.001) mean systolic blood pressure (SBP) than boys. Both SBP and diastolic blood pressure (DBP) revealed significant correlation with age, height, weight and BMI in overall and in gender specific analysis. Hypertension was found in 7.6 per cent school children (Boys: 7.3%, Girls: 7.8%). In multivariable analysis older age (OR 3.3, 95% CI: 2.82-3.91), children from tea garden community (OR 1.3, 95% CI: 1.08-1.55) and other community (OR 1.4, 95% CI: 1.18-1.73) and overweight (OR 1.5, 95% CI: 1.1-2.1) were independently associated with hypertension.
Interpretation & conclusions:
Mean blood pressure in the young school children of 5-14 yr was high. A programme comprising screening, early detection and health promotion through school health programmes may help prevent future complications of hypertension.
Keywords: Hypertension, North-East India, prevalence, school children
Many developing countries including India are now in advanced phases of epidemiological transition resulting in increasing burden of cardiovascular diseases (CVDs) and their risk factors such as hypertension. This results in significant economic losses to the country1. Hypertension has its origin in childhood2 and studies2,3,4,5 show that slight elevations in blood pressure in childhood will elevate the risk of developing hypertension in adult several folds. According to the World Health Report 20026, CVDs will be the largest cause of death and disability by 2020 in India. The Global Burden Disease study 2010 reveals that one in four deaths is from heart disease or stroke and blood pressure is one of the biggest global risk factors7. The studies in north eastern States of India also reveal a high burden of hypertension in the adult population8,9,10,11. Such increase may be related to epidemiological transition involving dietary, lifestyle and behavioural changes added to genetic profile12. Children are also expected to be affected by these changes with probable increase in cardiovascular disease13. Data from other parts of India14,15,16 showing a high burden of hypertension in younger age groups are also noteworthy. However, such data from north eastern region are lacking and thus need to be investigated. Considering the importance of early identification of children at risk of high blood pressure, proper evaluation and appropriate management to prevent the serious long tern complications associated with it, the present study was undertaken to find out distribution of blood pressure and correlates of hypertension in children in 5-14 yr age group.
Material & Methods
Study design, sample size calculation and sampling: The present study was a part of the Task Force study entitled “Jai Vigyan Mission Mode Project on Community Control of Rheumatic Fever/Rheumatic Heart Disease in India” carried out during 2008-2010 in Dibrugarh district, Assam, India. The district has 1,631 schools covering 1,80,153 children. School children from the selected schools belonging to the age group 5-14 yr were eligible for the present study.
Sample size was calculated using software OpenEpi, version-2 (www.OpenEpi.com). Assuming confidence level 95%, confidence limit 1% and outcome factor 50%, we calculated a sample size of 9513. Sampling was done by stratified random cluster method17. The schools were stratified into five groups according to educational levels, government vs. private or provincialised schools. A representative sample of 99 schools (Lower primary: 72, Middle English/Middle Vernacular: 16, government aided/private: 4, provincialised: 5 and higher secondary: 2) were chosen at random.
Survey procedure and consent: On the first day, selected schools were visited and permission from school authorities to carry out the blood pressure screening of the children was obtained. On the 2nd day parents/guardians of the children were called and provided with a description of the project, and informed consent forms were signed. A total of 10,003 school children from 99 schools were included. The selected schools had been surveyed in a sequential manner without considering any relationship between blood pressure and temperature or climatic conditions.
Record of anthropometric and clinical data: Demographic data viz. name, age, gender were recorded. Age was recorded from the school records. Gender and community were self-described. For the purpose of analysis within the database, self-described community was categorized as Assamese (Assamese speaking and native to Assam), tea garden workers (migrated from Orissa, Bihar, Madhya Pradesh who have settled in Assam and mainly engaged in tea industry) and others (not native to Assam and speak languages other than Assamese).
Children were advised to remove footwear and wear light clothes before measurement of body weight (to the nearest 0.5 kg). A digital weighing machine (Krup, India) was used for all measurements. Height was measured (to the nearest 0.5 cm) using stadiometer (Seca, UK). Body mass index (BMI) was calculated as weight in kilograms / height in meter squared. Overweight and obesity were assessed by BMI for age18. CDC 2000 dataset for males and females was used to identify BMI percentiles19. Children who had BMI for age percentile 5th to < 85th were regarded as of healthy weight, 85th to < 95th as of overweight and ≥95th as obese. Children with BMI for age percentile < 5th were regarded as underweight.
Blood pressure was recorded in sitting position with child's back supported, feet on the floor, the right arm supported and cubital fossa at the heart level. Mercury sphygmomanometer (Diamond, India) was used to measure BP. According to the ages of the children different sizes of cuff recommended by working group2 were used. Systolic blood pressure (SBP) was recorded when the sound first appeared and diastolic blood pressure (DBP) was taken at the point of 4th Korotkoff phase of sounds20. Three measurements were taken at interval of five minutes each and mean of these three readings was taken for analysis.
Classification of blood pressure: Blood pressure percentiles were computed for arbitrary sex, age and height as per guidelines provided by The The Fourth Report on the Diagnosis, Evaluation and Treatment of High Blood Pressure in Children and Adolescents2. CDC growth charts19 were used to convert the observed height into height Z- score. After obtaining these Z- score values regression equation was done in our data set (N=10,003) and regression coefficients obtained. These values were used in the formulae provided with the guidelines to calculate expected SBP or DBP2. From the expected BP, SBP or DBP Z-scores were calculated which were then converted to corresponding SBP or DBP percentiles. Finally, the BP percentiles were used to categorize blood pressure in the following manners2: (i) Normal: SBP and DBP< 90th percentile; (ii) Prehypertension: SBP or DBP ≥ 90th percentile to <95th percentile or BP >120/80 mmHg to <95th percentile; (iii) Stage I hypertension: SBP and or DBP≥ 95th percentile to < 99th percentile plus 5 mmHg; (iv) Stage II hypertension: SBP and or DBP≥ 99th percentile plus 5 mmHg.
The study protocol was approved by the institutional ethics committee of Regional Medical Research Centre, NE Region, Dibrugarh.
Statistical analysis: Statistical analysis was carried out using Statistical Package for Social Science (SPSS) version 17.0 (SPSS for windows, version 12.0.1.2001; SPSS Inc., Chicago, USA). Analysis included calculation of age and sex specific means and standard deviation (SD) for systolic and diastolic blood pressure, correlation coefficient, ANOVA and prevalence of hypertension. Univariate analysis was carried out to calculate crude odds ratio (OR) of selected socio-demographic variables and multivariable analysis to identify independent predictors of hypertension.
Results
Age and gender specific distribution of school children (n=10,003) and anthropometric variables (weight, height and BMI) are depicted in Table I. There were no significant differences in the values of anthropometric parameters across the age groups. Gender and community specific distribution of BMI categories (Table II) revealed predominance of underweight category among girls as compared to boys (27.4 vs. 22.2%, P<0.001) with high prevalence among children from tea garden community (34.7 vs. 20.1% and 22.0% among Assamese and other category of community, respectively, P<0.001).
Table I.
Distribution of anthropometric variables according to age and gender
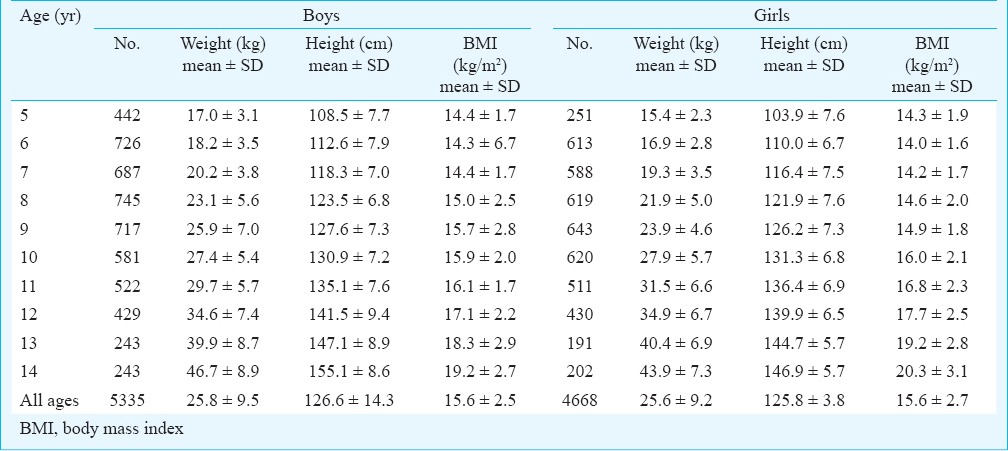
Table II.
Gender and community specific distribution of body mass index (BMI) in school children

Girl children had significantly higher mean SBP (104.2 ± 12.0 vs. 103.2 ± 11.6 mmHg, P<0.001) than boys. With increase of age there was a gradual rise in both SBP and DBP in boys and girls (Tables III and IV). Table V reveals age, gender and community specific distribution of mean blood pressure in the study population. The community categorized as other group had higher mean blood pressure than other groups. Significant correlations were obtained between BP (SBP and DBP) and anthropometric variables (height, weight and BMI) in overall and gender specific analysis (P<0.001).
Table III.
Age specific distribution, mean blood pressure and percentiles of systolic and diastolic blood pressure (SBP and DBP) in boys
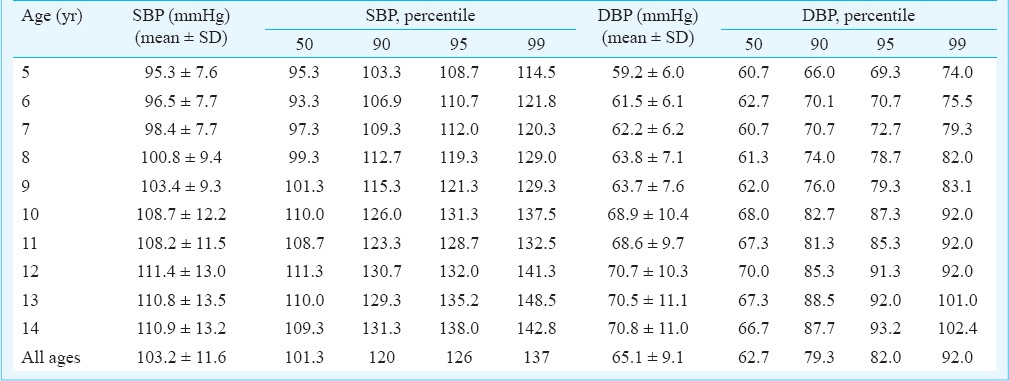
Table IV.
Age specific distribution, mean blood pressure and percentiles of systolic and diastolic blood pressure (SBP and DBP) in girls
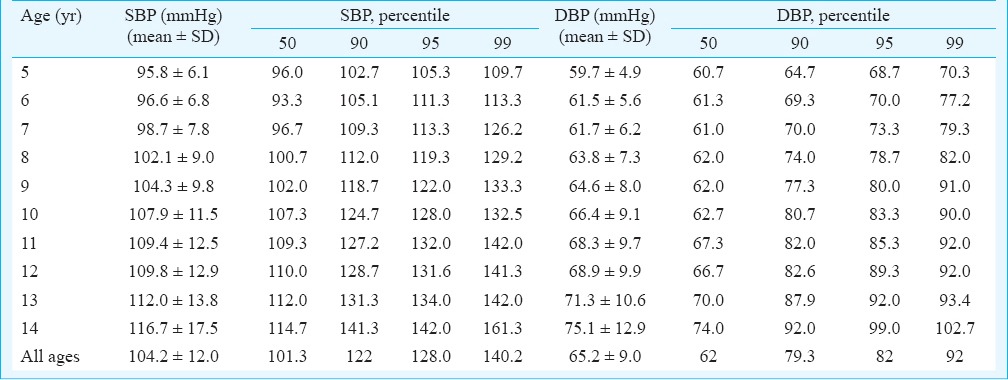
Table V.
Age, gender and community specific distribution of mean blood pressure

Table VI depicts regression coefficients derived by running regression equation in the present dataset. Hypertension was found in 7.6 per cent school children (boys: 7.3%, girls: 7.8%). Distribution of hypertension across the communities was significant (P=0.035) with highest prevalence in the community categorized as others (8.8%) followed by tea garden (7.6%) and Assamese community (7.0%). Figure (A, B) shows gender specific distribution of blood pressure categories according to age groups.
Table VI.
Regression coefficients from blood pressure regression model (N=10,003)
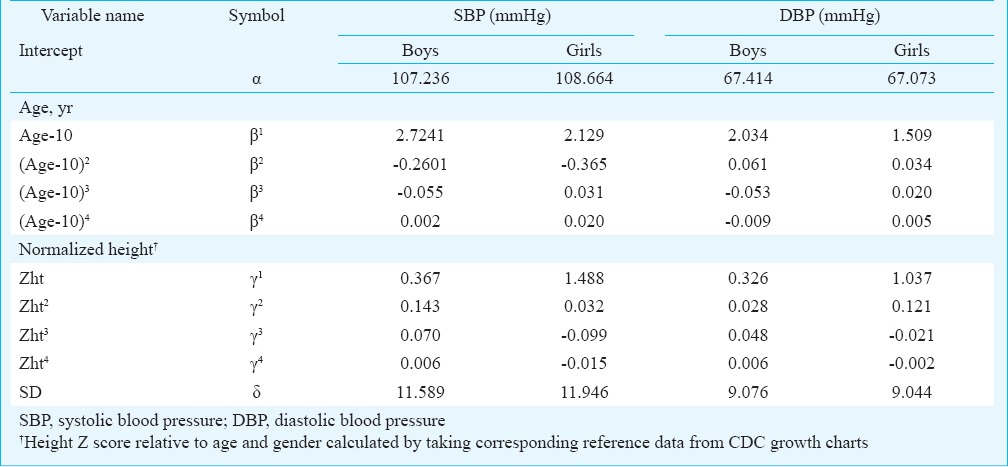
Figure.
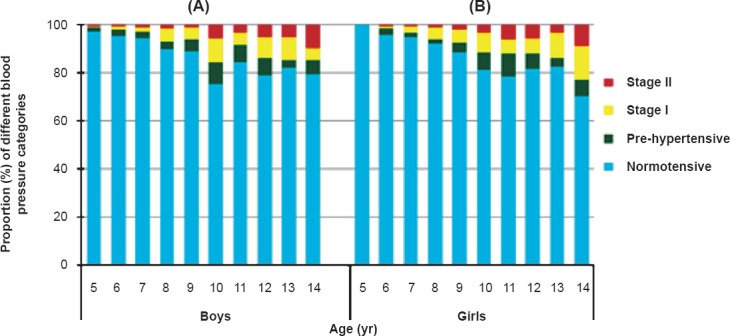
Age-specific distribution of blood pressure categories in boys (A) and girls (B).
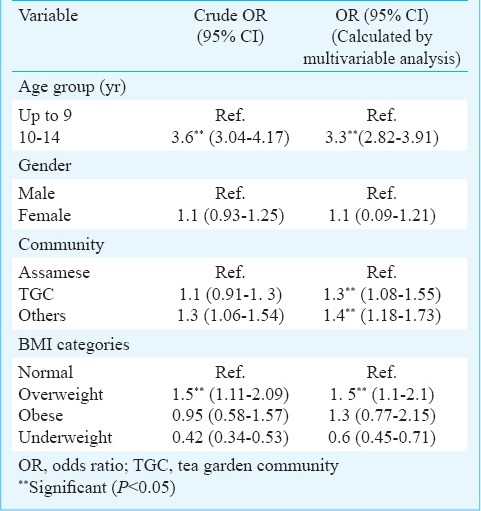
Table VII shows crude odds ratios of selected socio-demographic variables and the odds ratios of the independent predictors for hypertension. Older age (OR 3.3, 95% CI: 2.82-3.91), children from tea garden community (OR 1.3, 95% CI: 1.08-1.55) and community categorized as others (OR 1.4, 95% CI: 1.18-1.73) and overweight (OR 1.5, 95% CI: 1.1-2.1) were independently associated with hypertension.
Table VII.
Independent predictors for hypertension in children by multivariable analysis
Discussion
The present study highlights distribution of blood pressure and correlates of hypertension in school children aged 5-14 yr from Dibrugarh district. Mean blood pressure in this young segment of population was high. Hypertension was detected in 7.3 and 7.8 per cent for male and female children, respectively which was comparable to study carried out by Chadha et al21 in Delhi and that among children from a suburban area of south Kolkata reporting 6.9 per cent prevalence of hypertension in the normal weight children22, but higher in comparison with earlier studies carried out in Indian population23. A study carried out among the Gujrati school children revealed hypertension in 9.8 per cent boys and 10.3 per cent girls24. However, our values were lower in comparison with earlier studies carried out in school children from Fort Worth Texas25, minority school children and Hispanics where prevalence of hypertension at the first screening was 16, 17 and 25 per cent, respectively26. In a large survey of 5641 Pakistani children aged 5 to 14 yr, the overall prevalence of high blood pressure was 12.2 per cent27. Consumption of extra salt (salt as a side dish) in the diet is associated with adult hypertension10. The finding of higher number of children from tea garden community having hypertension may be related to this specific dietary behaviour.
Differential prevalence of hypertension across the studies may also be attributed to age differences, difference in study settings, the number of visits made for categorizing blood pressure of children. In our study only single visit was made and mean of three measurements of blood pressure was taken instead of three visits made on separate occasions. A study carried out among the school children aged 10 to 19 yr in eight Houston public schools revealed a decrease of BP from 19.4 per cent in the first visit to 4.5 per cent in the third visit26. In the Muscatine Study28, of the 6662 children, 13 per cent had elevated BP at the initial screening visit while less than one per cent had persistent elevated BP after repeated measurements taken on separated occasions.
Gender variation with significantly higher mean SBP among girls was observed in the present study. The finding was in conformity with an earlier study24.
Older age, tea garden community and the community categorized as others and overweight were independently associated with hypertension. Although high BMI increases the risk of development of hypertension, our results are insignificant for obese category. The reasons may be low prevalence (2.9% in boys and 1.2% in girls) of obesity in contrast to earlier studies where obesity ranged from 6.57 per cent in Indian children17 to 16.0 per cent in Americans29. Jafar et al27 showed that despite lower BMIs of south Asian children, the prevalence of hypertension was substantially greater than the five per cent predicted prevalence of high blood pressure in children in the United States.
Our study had some limitations. Classification of hypertension was based on measurement of BP in a single visit instead of recording on three separate occasions. During the survey, only 90 per cent school children were covered, therefore, BP status of the remaining 10 per cent school children could not be judged. We did not take the family history of hypertension and evaluate the socio-economic status of the parents which has a strong relationship with high blood pressure30,31. We chose 4th Korotkoff sound instead of fifth Korotkoff phase to record DBP.
In spite of these limitations, our findings bear significant impact in revealing high mean blood pressure among the studied sample. Our study included a large number of school children whose participation in the study was spontaneous. Therefore, findings obtained in this study may be generalized for the total population. The present study also indicates that elevated BP based on one visit should not be considered completely benign which may correlate with left ventricular hypertrophy32 and carotid intima-media thickness33.
To conclude, screening and early detection of hypertention through strengthening of school health programme is of utmost importance to prevent future epidemic and complications of hypertension in this young segment of population.
Acknowledgment
The study was funded by the Indian Council of Medical Research, New Delhi, India. The authors acknowledge Dr Bela Shah, and members of the Expert Group of the Task Force study namely Drs. R. Tandon, L.M. Nath, D.S. Agarwal, K.B. Sharma, S. Gupta, V.J. Abraham and K.N. Brahmadatan for technical support and guidance during the study. Assistance from Dr P.K. Mohapatra, Regional Medical Research Centre, NE Region (ICMR), Dibrugarh, in carrying out statistical analysis is acknowledged.
Footnotes
Conflicts of Interest: None.
References
- 1.Antezana FS. Epidemiological aspects of hypertension in the world. [accessed on December 20, 2012]. Available from: www.gfmer.ch/TMCA/Hypertension/Epidemiologicalaspectshypertensionworld.htm .
- 2.National High Blood Pressure Education Program. Working group on High Blood Pressure in Children and Adolescent. The Fourth Report on the Diagnosis, Evaluation and Treatment of High Blood Pressure in C hildren and Adolescents. Pediatrics. 2004;114:555–66. [PubMed] [Google Scholar]
- 3.Soudarssanane B, Mathanraj S, Sumanth MM, Sahai A, Karthigeyan M. Tracking of blood pressure among adolescents and young adults in an urban slum of Puducherry. Indian J Community Med. 2008;33:107–12. doi: 10.4103/0970-0218.40879. [DOI] [PMC free article] [PubMed] [Google Scholar]
- 4.Joshi S, Gupta S, Tank S, Malik S, Salgaonkar DS. Essential hypertension: Antecedents in children. Indian Pediatr. 2003;40:24–9. [PubMed] [Google Scholar]
- 5.Chen X, Wang Y. Tracking of blood pressure from childhood to adulthood: A systematic review and meta-regression analysis. Circulation. 2008;117:3171–80. doi: 10.1161/CIRCULATIONAHA.107.730366. [DOI] [PMC free article] [PubMed] [Google Scholar]
- 6.The World Health Report. Geneva, Switzerland: WHO; 2002. World Health Organization (WHO) [Google Scholar]
- 7.Horton R. GBD 2010: understanding disease, injury, and risk. Lancet. 2012;380:2053–4. doi: 10.1016/S0140-6736(12)62133-3. [DOI] [PubMed] [Google Scholar]
- 8.Hazarika NC, Biswas D, Narain K, Phukan RK, Kalita HC, Mahanta J. Differences in blood pressure level and hypertension in three ethnic groups of Northeastern India. Asia Pac J Public Health. 2000;12:71–8. doi: 10.1177/101053950001200204. [DOI] [PubMed] [Google Scholar]
- 9.Hazarika NC, Biswas D, Narain K, Kalita HC, Mahanta J. Hypertension and its risk factors in tea garden workers of Assam. Natl Med J India. 2002;15:63–8. [PubMed] [Google Scholar]
- 10.Hazarika NC, Narain K, Biswas D, Kalita HC, Mahanta J. Hypertension in the native rural population of Assam. Natl Med J India. 2004;17:300–4. [PubMed] [Google Scholar]
- 11.Hazarika NC, Biswas D, Mahanta J. Hypertension in the elderly population of Assam. J Assoc Physicians India. 2003;51:557–73. [PubMed] [Google Scholar]
- 12.Shankarishan P, Borah PK, Mohapatra PK, Ahmed G, Mahanta J. Population attributable risk estimates for risk factors associated with hypertension in an Indian population. Eur J Prev Cardiol. 2012;20:963–71. doi: 10.1177/2047487312462146. [DOI] [PubMed] [Google Scholar]
- 13.Munter P, He J, Cutler JA, Wildman RP, Whelton PK. Trends in blood pressure among children and adolescents. JAMA. 2004;291:2107–13. doi: 10.1001/jama.291.17.2107. [DOI] [PubMed] [Google Scholar]
- 14.Aggarwal VK, Sharan R, Srivastava AK, Kumar P, Pandey CM. Blood pressure profile in children of age 3-15 years. Indian Pediatr. 1983;20:921–5. [PubMed] [Google Scholar]
- 15.Sharma A, Grover N, Kaushik S, Bhardwaj R, Sankhyan N. Prevalence of hypertension among school children in Shimla. Indian Pediatr. 2010;40:873–6. doi: 10.1007/s13312-010-0148-5. [DOI] [PubMed] [Google Scholar]
- 16.Taksande A, Chaturvedi P, Vilhekar K, Jain M. Distribution of blood pressure in school going children in rural area of Wardha district, Maharashtra, India. Ann Pediatr Card. 2008;1:101–6. doi: 10.4103/0974-2069.43874. [DOI] [PMC free article] [PubMed] [Google Scholar]
- 17.Raj M, Sundaram KR, Paul M, Deepa AS, Kumar RK. Obesity in Indian children: time trends and relationship with hypertension. Natl Med J India. 2007;20:288–93. [PubMed] [Google Scholar]
- 18.Barlow SE, Dietz WH. Obesity evaluation and treatment: Expert Committee Recommendations. The Maternal and Child Health Bureau, Health Resources and Services, Administration and the Department of Health Services. Pediatrics. 1998;102:E29. doi: 10.1542/peds.102.3.e29. [DOI] [PubMed] [Google Scholar]
- 19.Centers for Disease Control and Prevention, National Center for Health Statistics. 2000 CDC Growth Charts: United States. [ accessed on October 28, 2013]. Available from: http://www.cdc.gov/nchs/data/nhanes/growthcharts/html_charts/bmiagerev.htm .
- 20.Chadha SL, Vasan RS, Sarma PS, Shekhawat S, Tandon R, Gopinath N. Age and height specific reference limits of blood pressure for Indian children. Natl Med J India. 1999;12:150–66. [PubMed] [Google Scholar]
- 21.Chadha SL, Tandon R, Shekhawat S, Gopinath N. An epidemiological study of blood pressure in school children (5-14 years) in Delhi. Heart J. 1999;51:178–82. [PubMed] [Google Scholar]
- 22.Genovesi S, Antolini L, Gallieni M, Aiello A, Mandal SK, Doneda A, et al. High prevalence of hypertension in normal and underweight Indian children. J Hypertens. 2011;29:217–21. doi: 10.1097/HJH.0b013e3283407fe3. [DOI] [PubMed] [Google Scholar]
- 23.Anand NK, Tandon L. Prevalence of hypertension in school going children. Indian Pediatr. 1996;33:377–81. [PubMed] [Google Scholar]
- 24.Vivek V, Singh SK. Prevalence of hypertension in Gujarati school going children and adolescents in Anand district. Natl J Community Med. 2012;3:452–7. [Google Scholar]
- 25.Ximena UR, Egbuchunam CU, Bae S, Menchaca J, Bayona M, Rivers PA, et al. High blood pressure in school children: prevalence and risk factors. BMC Pediatr. 2006;6:32. doi: 10.1186/1471-2431-6-32. [DOI] [PMC free article] [PubMed] [Google Scholar]
- 26.Jonathan MS, Dejian L, Turner J, Poffenbarger T, Portman RJ. Overweight, ethnicity and the prevalence of hypertension in school-aged children. Pediatrics. 2004;113:475–82. doi: 10.1542/peds.113.3.475. [DOI] [PubMed] [Google Scholar]
- 27.Jafar TH, Islam M, Poulter N, Hatcher J, Schmid CH, Levey AS, et al. Children in south Asia have higher body mass-adjusted blood pressure levels than white children in the United States: A comparative study. Circulation. 2005;111:1291–7. doi: 10.1161/01.CIR.0000157699.87728.F1. [DOI] [PubMed] [Google Scholar]
- 28.Rames LK, Clarke WR, Connor WE, Reiter MA, Lauer RM. Normal blood pressure and the evaluation of sustained blood pressure elevation in childhood: the Muscatine study. Pediatrics. 1978;61:245–51. [PubMed] [Google Scholar]
- 29.Hedley AA, Ogden CL, Johnson CL, Carroll MD, Curtin LR, Flegal KM. Prevalence of overweight and obesity among US children, adolescents, and adults, 1999-2002. JAMA. 2004;291:2847–50. doi: 10.1001/jama.291.23.2847. [DOI] [PubMed] [Google Scholar]
- 30.Walter HJ, Hofman A. Socio-economic status, ethnic origin and risk factors for coronary heart disease in children. Am Heart J. 1987;113:812–8. doi: 10.1016/0002-8703(87)90724-1. [DOI] [PubMed] [Google Scholar]
- 31.Weiss NS, Hamill PVV, Drizd T. Blood pressure levels of children 6-11 years: Relationship to age sex and socio-economic status, United States. Vital Health stat 11. 1973;135:1–30. [PubMed] [Google Scholar]
- 32.de Simone G, Mureddu GF, Greco R, Scalfi L, Del Puente AE, Franzese A, et al. Relations of left ventricular geometry and function to body composition in children with high casual blood pressure. Hypertension. 1997;30:377–82. doi: 10.1161/01.hyp.30.3.377. [DOI] [PubMed] [Google Scholar]
- 33.Jourdan C, Wuhl E, Litwin M, Fahr K, Trelewicz J, Jobs K, et al. Normative values for intima-media thickness and distensibility of large arteries in healthy adolescents. J Hypertens. 2005;23:1707–15. doi: 10.1097/01.hjh.0000178834.26353.d5. [DOI] [PubMed] [Google Scholar]


