

Abstract
The genetic control of pain has been repeatedly demonstrated in human association studies. In the present study, we assessed the relative contribution of 16 single nucleotide polymorphisms in pain-related genes, such as cathechol-O-methyl transferase gene (COMT), fatty acid amino hydrolase gene (FAAH), transient receptor potential cation channel, subfamily V, member 1 gene (TRPV1), and δ-opioid receptor gene (OPRD1), for postsurgical pain chronification. Ninety preoperatively pain-free male patients were assigned to good or poor outcome groups according to their intensity or disability score assessed at 1 week, 3 months, 6 months, and 1 year after funnel chest correction. The genetic effects were compared with those of two psychological predictors, the attentional bias toward positive words (dot-probe task) and the self-reported pain vigilance (Pain Vigilance and Awareness Questionnaire [PVAQ]), which were already shown to be the best predictors for pain intensity and disability at 6 months after surgery in the same sample, respectively. Cox regression analyses revealed no significant effects of any of the genetic predictors up to the end point of survival time at 1 year after surgery. Adding the genetics to the prediction by the attentional bias to positive words for pain intensity and the PVAQ for pain disability, again no significant additional explanation could be gained by the genetic predictors. In contrast, the preoperative PVAQ score was also, in the present enlarged sample, a meaningful predictor for lasting pain disability after surgery. Effect size measures suggested some genetic variables, for example, the polymorphism rs1800587G>A in the interleukin 1 alpha gene (IL1A) and the COMT haplotype rs4646312T>C/rs165722T>C/rs6269A>G/rs4633T>C/rs4818C>G/rs4680A>G, as possible relevant modulators of long-term postsurgical pain outcome. A comparison between pathophysiologically different predictor groups appears to be helpful in identifying clinically relevant predictors of chronic pain.
Keywords: genetics, COMT, OPRM1, postoperative pain, PVAQ
Introduction
Despite good analgesic treatment, a major proportion of patients undergoing surgery still develops chronic pain.1 Pathophysiological mechanisms underlying chronic post-surgical pain comprising inflammation, immune response to injury and wounds, and peripheral sensitization causing neuropathic pain and central sensitization are under genetic regulation.2 Thus, a gene-based approach appears very promising for explaining why some patients develop chronic pain after surgery and others not.
The genetics of pain have been impressively demonstrated in recent years by extensive research in laboratory animals3,4 and in human association studies.5–7 Over 400 genes have been recognized as pain modulators.8 Polymorphisms in genes such as cathechol-O-methyl transferase gene (COMT), µ-opioid receptor gene (OPRM1), GTP cyclohydrolase 1 gene (GCH1), human leukocyte antigen (HLA) gene complex, 5-hydroxytryptamine (serotonin) receptor 2a gene (HTR2A), interleukin 1 alpha gene (IL1A), interleukin 1 beta gene (IL1B), interleukin 1 receptor antagonist gene (IL1RN), and transient receptor potential cation channel, subfamily V, member 1 gene (TRPV1) are among the most often investigated candidate genes in pain genetic research associated with clinical as well as experimental pain.9 Concerning postoperative pain, associations were mostly shown for cytokine genes, the COMT, and OPRM1 genes.10–14 The genetic basis for the transition from acute to chronic postoperative pain is still unknown.
In the present study, we assessed the relative role of genotyping information for explaining pain continuation up to 1 year after funnel chest operation in a slightly enlarged sample of male pain-free patients already reported.15 Given the lack of genetic associations with chronic postthoracotomy pain, 31 single nucleotide polymorphisms (SNPs) were chosen from human association studies published until August 2009 (Table 1 for related references). Candidate genes were selected 1) to involve mechanisms of inflammation and wound healing to cover the obvious pathophysiological processes assumed to play a role in pain after surgery and 2) to include the most broadly investigated genes in pain research such as COMT, OPRM1, GCH1, and fatty acid amino hydrolase gene (FAAH), which are involved in the modulation of pain perception and cognitive processing. The genetic predictors were tested for their predictive power using a comparison to the best psychological predictors identified in a previous study in this clinical sample.15 Two pain-related psychological variables, namely, the attentional bias toward words of positive valence assessed in a dot-probe task and the self-reported pain vigilance (Pain Vigilance and Awareness Questionnaire [PVAQ]), were found to be the strongest predictors for chronic pain and disability after surgery, respectively.15 Thus, these two psychological predictors were used as a frame of comparison for the genetic predictors. Specifically, the genetic predictors were tested for their power to predict the time course of pain intensity and pain disability up to 1 year after surgery. Subsequently, they were added to the prediction of the respective best psychological predictor for establishing their relative contribution for postoperative pain and disability up to 1 year after surgery.
Table 1.
Single nucleotide polymorphisms (SNPs, database number) and haplotypes in candidate pain genes with corresponding observed minor allele frequencies (MAF) used for selection of the genetic predictors
| Gene | Function | SNP database number (minor allele right) | Reference | MAF of SNP (%) | Haplotype | MAF of haplotype(%) |
|---|---|---|---|---|---|---|
| BDKRB1 | Receptor for bradykinin, inflammation, burns, shocks, etc | rs4905475 G>C | 58 | 11.5 | ||
| CARD15 = NOD2 | Immune response | rs2066844 C>T | 59 | 3.9 | ||
| rs2066845 G>C | 1.6 | |||||
| COMT | Metabolization of catecholamines, neurotransmission | rs4646312 T>Ca | 51,57,60,61 | 37.4 | C/C/G/C/G/G | 36.1 |
| rs165722 T>Ca | 43.4 | C/C/G/C/C/G | 0.6 | |||
| rs6269 A>Ga | 36.8 | C/C/A/C/G/G | 0.6 | |||
| rs4633 T>Ca | 43.4 | T/C/G/C/C/G | 0.6 | |||
| rs4818 C>Ga | 36.3 | T/C/A/C/C/G | 6.1 | |||
| rs4680 A>Ga | 43.4 | T/T/A/T/C/A | 56.1 | |||
| FAAH | Degradation of fatty acid amide family of endogenous signaling lipids | rs932816 G>A | 57 | 27.5 | ||
| rs4141964 C>T | 40.7 | |||||
| rs2295633 G>A | 39.0 | |||||
| GCH1 | Biosynthesis of biogenic amines and nitric oxide | rs8007267 C>T | 48,62 | 15.9 | ||
| rs3783641 T>A | 18.1 | |||||
| rs10483639 G>C | 17.0 | |||||
| IL1A | Inflammation, immunity | rs1800587 G>A | 49 | 35.7 | ||
| IL1B | Inflammation | rs1143634 G>A | 59,63,64 | 28.3 | ||
| IL1RN | Inhibition of inflammation | rs2234677 G>A | 5,63 | 23.1 | ||
| IL23R | Immune response | rs11209026 G>A | 65 | 4.4 | ||
| MMP2 | Angiogenesis, tissue repair, inflammation | rs243865 C>T | 66 | 20.9 | ||
| NK1R | Metabolism of substance-P | rs6715729 G>A | 20 | 47.3 | ||
| rs735668 C>Ab | 47.3 | T/A | 35.6 | |||
| rs6741029 G>Tb | 36.3 | T/C | 1.1 | |||
| G/A | 11.7 | |||||
| G/C | 51.7 | |||||
| NR3C2 | Receptor for mineralocorticoids and glucocorticoids | rs5522 T>C | 21 | 14.3 | ||
| rs2070951 C>G | 47.8 | |||||
| OPRD1 | Mediation of encephalin effects | rs2234918 T>C | 54,57 | 39.0 | ||
| OPRM1 | Mediation of endorphin effects | rs1799971 A>G | 5,67 | 12.6 | ||
| TGFB1 | Regulation processes in cells | rs1800469 G>A | 68 | 33.0 | ||
| TRPA1 | Detection of noxious stimuli, cold perception | rs11988795 C>T | 57 | 31.3 | ||
| rs13255063 A>T | 4.4 | |||||
| TRPV1 | Detection of noxious chemical and thermal stimuli | rs8065080 T>C | 54,57,69 | 37.4 |
Notes:
SNPs and haplotypes selected as the final set of genetic predictors are given in bold. SNPs in COMT gene submitted for haplotype analysis;
SNPs in NK1R gene submitted for haplotype analysis.
Abbreviations: BDKRB1, bradykinin receptor B1 gene; CARD15, nucleotide-binding oligomerization domain containing 2 gene; COMT, cathechol-O-methyl transferase gene; FAAH, fatty acid amino hydrolase gene; GCH1, GTP cyclohydrolase 1 gene; IL1A, interleukin 1 alpha gene; IL1B, interleukin 1 beta gene; IL23R, interleukin 23 receptor gene; IL1RN, interleukin 1 receptor antagonist gene; MMP2, matrix metallopeptidase 2 gene; NK1R, tachykinin receptor 1 gene; NR3C2, nuclear receptor, subfamily 3, group C, member 2 gene; OPRD1, δ-opioid receptor gene; OPRM1, µ-opioid receptor gene; TGFB1, transforming growth factor, beta 1 gene; TRPA1, transient receptor potential cation channel, subfamily A, member 1 gene; TRPV1, transient receptor potential cation channel, subfamily V, member 1 gene.
Materials and methods
Patients
Ninety men (mean ± standard deviation [SD] 23.5±4.6 years) undergoing a cosmetic correction of funnel chest malformation were selected among consecutively admitted inpatients at the Department of Pediatric Surgery of the University of Erlangen. Eighty percent of the patients participated also in a previous study by Lautenbacher et al.15 Because of the high rate of men undergoing this type of surgical correction, only male patients participated. Inclusion criteria were 1) age between 14 years and 35 years, 2) informed written consent to data acquisition and an additional separate informed written consent to blood sampling and genotyping, 3) no contraindication for the surgical procedure, and 4) postoperative analgesic treatment via the patient-controlled epidural analgesia (PCEA). Exclusion criteria were 1) concurrent acute or chronic pain conditions, 2) previous major surgical interventions (minor surgical interventions, such as tonsillectomies or dental procedures, were allowed), 3) strong levels of discomfort due to functional limitations because of the chest malformation, and 4) past and current psychological disorders as diagnosed by a German standardized psychological screening for International Statistical Classification of Diseases and Related Health Problems 10th edition, and Diagnostic and Statistical Manual of Mental Disorders, IV edition, the Mini-DIPS.16
All patients underwent a thoracic surgery for cosmetic correction of congenital chest malformations named “funnel chest”. The surgical procedure is known as the Erlangen technique of funnel chest correction.17 For moving the sternum in the desired position, first the sternum is freed through an interior incision and then it is mobilized by freeing of the xiphisternum. After correction of the chest, the chest wall is stabilized with a lightweight transsternal metal implant. The metal implant is removed ~1 year after the surgery. The patients received a standardized analgesia during and after surgery via a commonly applied and recommended thoracic PCEA. Before the induction of general anesthesia for surgery, an epidural catheter was inserted through the interspinous space at Th6/Th7 or Th7/Th8. Postoperative PCEA was provided using a standard PCA pump. The pump was set to deliver 0.2% ropivacaine plus 1.0 µg/mL sufentanil at a basal rate of 6–8 mL/h. Patients could additionally request a bolus dose of 3 mL every 30 minutes by pressing a trigger button. Repeated pressing of the trigger button did not provide more than one bolus per 30 minutes. The PCEA catheter was usually removed 2–3 days after surgery. As rescue analgesics on demand, the nonopioids, S-ketoprofen, diclofenac, dipyrone, and paracetamol, and the opioids, buprenorphine or piritramide, were available.
The study protocol was approved by the Ethics Committee of the Medical Faculty of the University of Erlangen-Nürnberg. All patients gave informed written consent. In case of not having attained legal age (18 years), informed written consent was obtained from their parents and written assent from the subject. All participating patients received financial compensation.
Data acquisition
One preoperative session on the day before surgery and four postoperative sessions at 1 week, ~3 months, 6 months, and 1 year after surgery were conducted. The sessions took place mostly in the afternoon. In the preoperative session 1 day before surgery, among other preoperative predictors (questionnaires, experimental pain sensitivity) a self-report questionnaire of pain hypervigilance (PVAQ)18 and a dot-probe task measuring attentional biases toward pain-related, social threat, and positive words were assessed. Data on preoperative predictors have already been published.15,19 In the postoperative sessions, self-report ratings of pain intensity and pain disability were obtained. Blood samples were collected at the Pain Centre of the University Hospital Erlangen during the preoperative preparation of the patients for surgery. For patients already included in the behavioral assessment before the beginning of the genetic study, blood sampling was conducted 1 year postsurgery during the preparation of the patients for the surgical removal of the metal implant.
Genetic predictors
The candidate genes were selected 1) to involve mechanisms of inflammation and wound healing underlying pathophysiological processes involved in pain after surgery and 2) to include the most frequently investigated genes in pain research such as COMT, OPRM1, GCH1, and FAAH. Specifically, SNPs were derived from a PubMed database search for human association studies published until August 2009 using free text combinations of the termini: pain, nociception, pain disease, single nucleotide polymorphism, polymorphism, genetic polymorphism, human genetics study, and human association study (Table 1). For variants in the tachykinin 1 receptor gene (NK1R) and the mineralocorticoid receptor gene, nuclear receptor, subfamily 3, group C, member 2 gene (NR3C2), no human pain association studies were found up to this time point. Substance P and mineralocorticoids such as cortisol play a crucial role in inflammatory and stress-induced response to pain; thus, variants in the NK1R gene were derived from a study on alcohol dependence20 and for the NR3C2 gene from a study on cortisol responses following dexamethasone application.21 A set of 31 SNPs in 17 genes were finally selected for the study.
Following this selection, we performed a posteriori verification of the functional focus of the selected genes on postoperative inflammatory and wound healing processes. For this purpose, the 17 genes were analyzed in a systems-genetics context. Specifically, the biological roles in which a given set of genes are involved can be obtained from publicly available knowledge databases. The gold standard in this field is the Gene Ontology (GO; http://www.geneontology.org/),22 where the major biological processes of the genes, respectively, gene products, are described by a controlled vocabulary (GO terms).23 An overview on GO as well as on concepts such as “ontology” in computer science can be found in Thomas et al.24 The functions of the 17 selected pain genes were analyzed by means of an overrepresentation analysis (ORA)25 using the web-based GeneTrail tool (http://genetrail.bioinf.uni-sb.de/).26 Other applications of similar GO-based analysis were already reported in biomedicine.27,28 For the present analysis, a reference set of 410 known pain genes and their annotations to GO terms was used for comparison. In particular, all GO terms associated with the available reference list of pain genes, n=410,29 were compared with the occurrence of the terms among the subset of n=17 genes from the present study. ORA was done with parameter P-value threshold, tp = 0.05, and a false discovery rate α correction for multiple testing.30 From this analysis, the biological processes have emerged, in which the n=17 genes were particularly engaged among the reference set of n=410 pain genes (Figure S1, original ORA tree from the GeneTrial results output). Figure S1 displays the 21 significant GO terms annotated at the given ORA parameters to the n=17 genes. Among them, the seven most significant terms (Table S1) pointed to biological processes of “response to chemical stimuli”, “response to stress”, “immune system response”, “immune response”, “cognition”, “inflammatory response”, and “sensory perception” (detailed definitions of the GO terms available at the AmiGo search tool for the GO at http://amigo.geneontology.org/31). This supported our selection of genes as covering key biological processes expected during the development of pain after surgical intervention.
Genotyping analysis
For genotyping of the patients, genomic DNA was extracted from peripheral blood using a Flexigene AGF 3000 technology (Qiagen NV, Venlo, the Netherlands) on an automated Autogenflex 3000 isolator (Autogen, Holliston, MA, USA) according to the protocols supplied by the provider. For genotyping the TaqMan®, OpenArray® Genotyping Systems (Thermo Fisher Scientific, Waltham, MA, USA) was used, which is a high-performance, high-throughput technology based on real-time polymerase chain reaction. The plates used for the OpenArray® assay were composed of 48 subarrays, with 64 nanowells that were prefilled with custom-made assays (Thermo Fisher Scientific) for the genotyping of 32 SNPs in total. After addition of 100 ng genomic DNA and reaction mix to the corresponding wells, the arrays were placed in a Thermocycler BIORAD DNA Engine Peltier Thermal Cycler for fragment amplification. Arrays were scanned on the Open-Array NT imager, and genotypes were called using the Open-Aray SNP Genotyping Analysis software. Whenever assay design or the genotyping assay failed, SNPs were genotyped by polymerase chain reaction amplification (primer sequences available on request) and subsequent Sanger sequencing of both strands on an automated capillary sequencer ABI3730 (Thermo Fisher Scientific). The resulting sequences were then analyzed with the Sequencer DNA Sequence Analysis software (Gene Codes Corporation, Ann Arbor, USA).
Psychological factors
For determining the predictive strength of the genetic predictors, two psychological predictors were used for comparison, namely, the preoperatively measured pain vigilance and the attentional bias to positive words assessed via a dot-probe task. These were chosen as best possible predictors according to our previously published findings in this sample.15 In this study, preoperative predictors encompassing pain-related and general psychological predictors (pain catastrophizing, pain anxiety and hypervigilance, depression, state anxiety, somatization, attentional bias for emotionally loaded words), psychophysical predictors (cold and heat pain thresholds, heat pain summation), and cortisol reactivity were tested for their power to explain chronic pain and disability up to 6 months after surgery. The attentional bias for positive words and the self-reported pain vigilance (PVAQ) proved to be the best preoperative predictors for persisting pain and disability for both 3 months and 6 months after surgery, respectively.15 Thus, these two psychological predictors were chosen for comparison and are described in the following.
The PVAQ18 has been developed as a comprehensive measure of attention to pain and validated for the use in chronic pain and nonclinical samples. It consists of 16 items that are rated on a six-point scale and assess awareness, vigilance, preoccupation, and observation of pain. For the present study, the questionnaire was translated into German using a standard “forward–backward” procedure. Only if the resulting backward English version was very similar to the original version according to the evaluation of an English native speaker, translation accuracy was considered as sufficient. The original English version of the questionnaire has been shown to have good internal consistency (Cronbach’s α=0.86) and test–retest reliability (rtt =0.80).18 The German version used in this study showed sufficient internal consistency (Cronbach’s α=0.85) in a previous study.32 The present German version of the PVAQ was repeatedly successfully used in clinical and experimental studies.15,19,32,33 For further analyses, the sum score of the PVAQ was used as a parameter of interest for predicting pain disability.
The selective attention task used in the present study was based on the dot-probe task described by Keogh et al.34 It has been used in our laboratory in different clinical and experimental studies.15,19,32,35 It contains three emotional word categories: pain-related (eg, stechend (Ger.)/stinging), social threat (eg, beschämt (Ger.)/ashamed), and positive words (eg, glücklich (Ger.)/lucky). These words are paired with neutral words (Anstrich (Ger.)/paintwork); neutral–neutral word pairs served as filler items.
Following Keogh et al,34 a fixation cross in the center of a computer screen was presented for 500 ms. Subsequently, two words, that is, a neutral one paired with an emotional one, were presented concurrently, one below and one above the center. After another 500 ms, the words disappeared and a dot appeared at the location of one of the two words. Patients were required to indicate by pressing a key as quickly as possible where the dot had appeared (below or above). After 20 practice trials, patients had to complete 128 experimental trials (32 trials per word-pair category) presented in random order. The reaction times in response to the dot were assessed. To assess selective attentional processes related to each of the emotional word categories, bias indices were calculated according to the formula by Keogh et al:34 Bias score = ((eudl − eldl) + (eldu − eudu))/2, where the letters mean e = emotional word, d = dot, u = upper position, and l= lower position. A positive score indicates an attentional preference for the location of the emotional word, whereas a negative score may suggest attentional avoidance.
Assessment of postoperative pain
At each of the postoperative time points, patients were asked to rate the average intensity of their pain on an eleven-point numerical rating scale (NRS), labeled with the verbal anchors “no pain” (0) and “strongest pain imaginable” (10). At 1 week postsurgery, pain ratings were acquired for the preceding week, and at 3 months, 6 months, and 1 year postsurgery for the preceding 4 weeks. Patients were also asked to complete the pain disability index (PDI)36 as a common measure of pain disability. It consists of seven items assessing the degree to which pain interferes with functioning across different classes of activities, such as social activities, recreation activities, and professional life activities. Each item could be scored between 0 (no interference) and 10 (total interference). Our previous study in this sample showed enough variance in data regarding the two outcome measures after 3 months postsurgery, a time frame which is commonly defined as chronic pain.
Statistics
Preprocessing of genetic data
For verifying a random genetic sample, the distribution of homozygous and heterozygous carriers of alleles was tested for agreement with the Hardy–Weinberg equilibrium37 using χ2 goodness-of-fit tests (Haploview software Version 4.238). For subsequent analyses, only SNPs were used that fulfilled the following criteria: 1) genotype groups with n>10 patients as prerequisite for parametric group statistics and 2) observed minor allelic frequency (MAF) of ≥10% as a prerequisite for sufficient distribution of the genetic variants in the present sample. The resulting set of genetic predictors comprised 16 SNPs in eight genes (Table 1), which is roughly half of the originally targeted 17 genes. These SNPs were then included in the order of their chromosome positions in in silico haploblock detection using 95% confidence bounds on D′39 and in a subsequent haplotype analysis (PHASE40,41).
Classification of postoperative outcome
For separating patients with poor outcome after surgery from patients who have almost optimally recovered, a classification of postoperative outcome was computed. Patients were assigned to a “high” (NRS: 3–10) or “low” (NRS: 0–2) pain intensity group and to a “high” (PDI: 9–70) or “low” (PDI: 0–9) pain disability group for each of the postoperative time points according to their pain intensity and disability scores. The protocol followed the classification used in Lautenbacher et al.15 The cutoff score of two points for pain intensity was set according to the findings of Farrar et al,42 suggesting that relevant clinical changes on the numerical rating scale are indicated by differences of at least two scale units. The cut off for pain disability was set at a score of 8, indicating the minimum level of clinically relevant pain-related disability as suggested by Dillmann et al.43
Additionally, time-dependent changes in pain intensity and disability over the postoperative time course were tested using nonparametric repeated-measures approach (Friedman’s test) because the scores of both measures were not normally distributed (D(90)=[0.150–0.309], P<0.001) with the only exception of the pain disability scores at 1 week postsurgery. Post hoc analyses for differences between time points were run using Wilcoxon signed-rank test.
Prediction of postoperative outcome
The power of the genetic predictors for explaining the postoperative 1-year time course of pain-associated clinical parameters was assessed by means of Cox regression analysis. The proportional hazard function allows assessing the probability (hazard ratio [HR]) to reach an event of interest, adjusted for the influencing factors, during a defined period of time termed survival time.44 In the present study, the event of interest was a postoperative outcome of low pain intensity or low pain disability at 1 year after surgery (criterion variables). The genetic and psychological variables were defined as covariates (predictors) influencing the course of postoperative outcome. Predictors were entered in the prediction model at a threshold significance level of α<0.05 (corresponding to a critical χ2=3.842, df =1) and were removed at α<0.10.
First, the influence of the genetic variables on postoperative outcome was tested. Separate stepwise Cox regression analyses (stepwise forward procedure) were conducted for pain intensity and disability including the final set of genetic variables (SNPs and haplotypes) as predictive factors for reaching an outcome of low pain intensity and disability. Each SNP or haplotype was defined as a separate categorical covariate (occurrence of 0, 1, or 2 times of the minor allele for SNPs and the occurrence of 0, 1, or 2 times of the haplotype). SNPs being components of a haplotype were only regarded within the respective haplotypes and were not additionally tested as separate predictors.
Second, the additional contribution of the genetic predictors to the prediction of the selected psychological predictors was assessed. Therefore, separate Cox regression analyses were again conducted for pain intensity and pain disability including the respective psychological variable in a first block of the Cox regression (the attentional bias toward positive words for predicting pain intensity and the pain vigilance for predicting pain disability) and adding all genetic variables in a second block. The statistical method for selecting predictor variables in these additional analyses was again stepwise forward procedure to identify the best possible pattern of prediction.
Statistical analyses were run using the SPSS software, Version 19 for Windows (IBM Corporation, Armonk, NY, USA). Statistical significance was set at α=0.05 for all analyses.
Effect sizes estimation
Additionally, to reveal the strength of differences between the low and high pain intensity and disability groups as regards the predictors at the end point of survival time 1 year after surgery, effect sizes (Cohen’s d) were calculated. For comparing the effect sizes of the genetic and psychological predictors, we computed the common effect size measure Cohen’s d45 for both predictor groups via a computer-based tool for meta-analysis (Comprehensive Meta-Analysis software version 2.0 for Windows, Biostat, Inc., Englewood, NJ, USA). With respect to the genetic predictors, first genotypes and haplotypes were assigned to pain and disability groups according to the presence of the minor allele (recessive hereditary model). Group frequencies were then estimated by 2×2 cross tabulations conducted between carriers and noncarriers of the minor allele and the outcome groups. The estimated frequency statistics were then used for the calculation of effect sizes regarding the genetic predictors.
Results
Descriptive statistics of clinical data and the final set of genetic predictors
Descriptive statistics of the psychological predictors and postoperative outcome of the sample are shown in Table 2. The attentional bias score for positive words had a negative value suggesting lower attentional preference of the patients for positive words. Low pain intensity and disability were reached by 83 (92.2%) of the patients at 1 year after surgery, however, not necessarily by the same patients (Table 2). Survival curves for the proportion of patients reporting high pain intensity and disability during the postoperative time course are shown in Figure 1. The highest rating scores in both measures of postoperative pain (mean [SD] =3.88 [2.00] for pain intensity; mean [SD] =36.67 [15.79] for pain disability) were reached at 1 week postsurgery and declined in time reaching the lowest values at 1 year after surgery (mean [SD] =0.69 [1.02] for pain intensity; mean [SD] =2.00 [3.63] for pain disability) (Table 2). Taking into account that pain intensity and disability scores were not normally distributed, Friedman’s tests were conducted for detecting differences in the scores of pain intensity and pain disability over the four postoperative points. The results revealed significant effects of time on pain intensity (χ2(3,0)=145.027, P<0.001) and pain disability (χ2(3,0)=198.991, P<0.001). Post hoc analyses using the Wilcoxon test showed significant decreases in the scores of pain intensity and disability over all postoperative points in time (for pain intensity: ZT1−T2/T2−T3/T3−T4 = [(−3.050) − (−6.805)], P≤0.002; for pain disability: ZT1−T2/T2−T3/T3−T4 = [(−3.491) − (−7.406)], P < 0.001).
Table 2.
Clinical characteristics of the sample
| Parameter | Preoperative assessment
|
Preoperative assessment
|
|||
|---|---|---|---|---|---|
| 1 day presurgery | 1 week | 3 months | 6 months | 1 year | |
| Psychological variables | Mean (SD) | ||||
| Attentional bias score for positive words | −5.88 (46.57) | ||||
| PVAQ score | 33.33 (12.21) | ||||
| Postoperative pain characteristics | Mean (SD) | ||||
| Pain intensity ratings | 3.88 (2.00) | 1.64 (1.57) | 1.19 (1.49) | 0.69 (1.02) | |
| Pain disability index | 36.67 (15.79) | 12.81 (12.37) | 4.23 (7.34) | 2.00 (3.63) | |
| Classification in low/high levels of postoperative paina | N (%) | ||||
| Pain intensity ratings | |||||
| Low pain intensity | 25 (27.80) | 69 (76.70) | 78 (86.70) | 83 (92.20) | |
| High pain intensity | 65 (72.20) | 21 (23.30) | 12 (13.30) | 7 (7.80) | |
| Pain disability index | |||||
| Low pain disability | 5 (5.60) | 42 (46.70) | 78 (86.70) | 83 (92.20) | |
| High pain disability | 85 (94.40) | 48 (53.30) | 12 (13.30) | 7 (7.80) | |
Notes:
According to the pain intensity ratings ([0–2] = low pain intensity, [3–10] = high pain intensity) and the pain disability score ([0–8] = low pain disability, [9–70] = high pain disability at the respective assessment points in time).
Abbreviations: SD, standard deviation; PVAQ, Pain Vigilance and Awareness Questionnaire.
Figure 1.
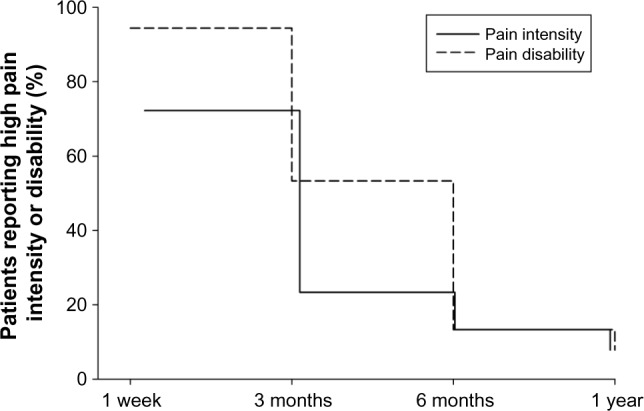
Survival curves of the percentage of patients reporting high pain intensity and disability during the postoperative time course up to 1 year after surgery.
The distribution of the homozygous and heterozygous carriers of all SNPs agree with the expectations of the Hardy–Weinberg law (χ2 goodness-of-fit test, P=[0.169–1.00]. Two haploblocks were estimated between SNPs located in the COMT gene, spanning rs4646312, rs165722, rs6269, rs4633, rs4818, and rs4680 (linkage disequilibrium [LD] 97%), and in the NK1R gene, spanning rs6741029 and rs735668 (LD 93%). Subsequently, six haplotypes were computed for the COMT and four for the NK1R gene (Table 1). Two of the COMT haplotypes and three of the NK1R haplotypes fulfilled the criterion of MAF >10% and were submitted to analysis. The first COMT haplotype rs4646312C/rs165722C/rs6269G/rs4633C/rs4818G/rs4680G was composed of the minor alleles and the second one, COMT rs4646312T/rs165722T/rs6269A/rs4633T/rs4818C/rs4680A, consisted of the major alleles. The three NK1R haplotypes, NK1R rs6741029T/rs735668A, NK1R rs6741029G/rs735668C, and NK1R rs6741029G/rs735668A, were composed of the minor alleles, the major alleles, and a combination, respectively. All the remaining eight SNPs had a MAF >10% and were submitted to statistical analysis. Finally, the resulting set of genetic predictors comprised eight SNPs and five haplotypes (Table 1, relevant SNPs and haplotypes marked in bold).
Prediction of postoperative outcome by the genetic variables
The postoperative time course of pain intensity and disability was first tested for influences of the genetic factors. Stepwise Cox regression analyses identified no significant effects of any of the genetic predictors on survival time up to 1 year after surgery. Table 3 displays the score statistics (χ2 value, df, P) for the genetic predictors that could not surpass the threshold α-level of 0.05. The χ2 values are given for each SNP and haplotype as a categorical covariate where the occurrence of the minor allele for the SNPs (0, 1, or 2 times) and the occurrence of the haplotype (0, 1, or 2 times) are defined.
Table 3.
The prediction of survival time by the genetic predictors (genotypes and haplotypes), for pain intensity and pain disability, respectively
| Genetic predictors (genotypes and haplotypes) | Pain intensity
|
Pain disability
|
||||||||
|---|---|---|---|---|---|---|---|---|---|---|
| χ2 | df | P-value | HRc | CI | χ2 | df | P-value | HRc | CI | |
| IL1A rs1800587 G>A | ||||||||||
| AAa | 0.773 | 2 | 0.680 | – | – | 0.267 | 2 | 0.875 | – | – |
| AG | 0.753 | 1 | 0.386 | – | – | 0.192 | 1 | 0.661 | – | – |
| GG | 0.346 | 1 | 0.556 | – | – | 0.024 | 1 | 0.877 | – | – |
| FAAH rs4141964 C>T | ||||||||||
| TTa | 0.679 | 2 | 0.712 | – | – | 0.863 | 2 | 0.650 | – | – |
| CT | 0.148 | 1 | 0.700 | – | – | 0.145 | 1 | 0.703 | – | – |
| CC | 0.088 | 1 | 0.767 | – | – | 0.771 | 1 | 0.380 | – | – |
| FAAH rs2295633 G>A | ||||||||||
| AAa | 0.277 | 2 | 0.871 | – | – | 1.634 | 2 | 0.442 | – | – |
| AG | 0.193 | 1 | 0.660 | – | – | 0.172 | 1 | 0.679 | – | – |
| GG | 0.010 | 1 | 0.920 | – | – | 1.326 | 1 | 0.249 | – | – |
| NK1R rs6715729 G>A | ||||||||||
| AAa | 0.900 | 2 | 0.638 | – | – | 0.182 | 2 | 0.913 | – | – |
| AG | 0.000 | 1 | 0.984 | – | – | 0.046 | 1 | 0.831 | – | – |
| GG | 0.514 | 1 | 0.473 | – | – | 0.180 | 1 | 0.672 | – | – |
| NR3C2 rs2070951 C>G | ||||||||||
| GGa | 0.004 | 2 | 0.998 | – | – | 0.878 | 2 | 0.645 | – | – |
| CG | 0.000 | 1 | 0.989 | – | – | 0.877 | 1 | 0.349 | – | – |
| CC | 0.004 | 1 | 0.953 | – | – | 0.288 | 1 | 0.592 | – | – |
| OPRD1 rs2234918 T>C | ||||||||||
| CCa | 0.241 | 2 | 0.887 | – | – | 3.785 | 2 | 0.151 | – | – |
| CT | 0.023 | 1 | 0.879 | – | – | 0.914 | 1 | 0.339 | – | – |
| TT | 0.024 | 1 | 0.876 | – | – | 0.004 | 1 | 0.948 | – | – |
| TGFB1 rs1800469 G>A | ||||||||||
| AAa | 0.503 | 2 | 0.777 | – | – | 0.287 | 2 | 0.867 | – | – |
| AG | 0.315 | 1 | 0.575 | – | – | 0.265 | 1 | 0.607 | – | – |
| GG | 0.497 | 1 | 0.481 | – | – | 0.228 | 1 | 0.633 | – | – |
| TRPV1 rs8065080 T>C | ||||||||||
| CCa | 2.265 | 2 | 0.322 | – | – | 2.379 | 2 | 0.304 | – | – |
| CT | 0.002 | 1 | 0.965 | – | – | 2.367 | 1 | 0.124 | – | – |
| TT | 0.868 | 1 | 0.352 | – | – | 1.265 | 1 | 0.261 | – | – |
| COMT C/C/G/C/G/Gd | ||||||||||
| 2×b | 0.757 | 2 | 0.685 | – | – | 0.846 | 2 | 0.655 | – | – |
| 1× | 0.151 | 1 | 0.697 | – | – | 0.823 | 1 | 0.364 | – | – |
| No | 0.049 | 1 | 0.826 | – | – | 0.638 | 1 | 0.424 | – | – |
| COMT T/T/A/T/C/Ae | ||||||||||
| 2×b | 0.968 | 2 | 0.616 | – | – | 0.234 | 2 | 0.889 | – | – |
| 1× | 0.155 | 1 | 0.694 | – | – | 0.180 | 1 | 0.671 | – | – |
| No | 0.325 | 1 | 0.569 | – | – | 0.168 | 1 | 0.682 | – | – |
| NK1R T/Af | ||||||||||
| 2×b | 0.047 | 2 | 0.997 | – | – | 0.328 | 2 | 0.849 | – | – |
| 1× | 0.039 | 1 | 0.843 | – | – | 0.001 | 1 | 0.980 | – | – |
| No | 0.045 | 1 | 0.832 | – | – | 0.147 | 1 | 0.701 | – | – |
| NK1R G/Ag | ||||||||||
| 1×b | – | – | – | – | – | – | – | – | – | – |
| No | 0.010 | 1 | 0.922 | – | – | 0.001 | 1 | 0.980 | – | – |
| NK1R G/Ch | ||||||||||
| 2×b | 0.108 | 2 | 0.948 | – | – | 1.392 | 2 | 0.499 | – | – |
| 1× | 0.044 | 1 | 0.833 | – | – | 1.254 | 1 | 0.263 | – | – |
| No | 0.107 | 1 | 0.744 | – | – | 0.882 | 1 | 0.348 | – | – |
Notes:
Genetic predictors are displayed as genotypes or haplotypes in alphabetical order, reference category in the Cox regression analysis comprising the homozygous carriage of the minor allele;
reference category in the Cox regression analysis for comparing the occurrence of the haplotype (0, 1, or 2 times present), 2× = haplotype present two times, 1× = haplotype present one time, no = haplotype not present;
Hazard ratios are given in the statistical output of the Cox regression analysis only for variables included in the model surpassing the α-level threshold of 0.05;
COMT rs4646312C/rs165722C/rs6269G/rs4633C/rs4818G/rs4680G haplotype;
COMT rs4646312T/rs165722T/rs6269A/rs4633T/rs4818C/rs4680A haplotype;
NK1R rs6741029T/rs735668A haplotype;
NK1R rs6741029G/rs735668A haplotype;
NK1R rs6741029G/rs735668C haplotype.
Abbreviations: df, degrees of freedom; HR, hazard ratio; CI, confidence interval; COMT, cathechol-O-methyl transferase gene; FAAH, fatty acid amino hydrolase gene; IL1A, interleukin 1 alpha gene; NK1R, tachykinin receptor 1 gene; NR3C2, nuclear receptor, subfamily 3, group C, member 2 gene; OPRD1, δ-opioid receptor gene; TGFB1, transforming growth factor, beta 1 gene; TRPV1, transient receptor potential cation channel, subfamily V, member 1 gene.
Prediction of postoperative outcome by the psychological and genetic variables
Given the lack of a statistical evidence for an influence of the genetic predictors on pain-associated postoperative outcome, the relative contribution of the genetic predictors to the predictions of pain intensity by the attentional bias for positive words and of pain disability by the PVAQ was tested. However, none of the genetic predictors could improve the goodness of prediction by each of the psychological predictors. The initial score statistics of the genetic variables entered all together as a second block of the respective regression analysis had the same values as displayed in Table 3 because of the same stepwise forward method used for statistical selection of the best possible predictors. In summary, the values ranged again between χ2=[0.000–2.265], P>0.332 for pain intensity and between χ2=[0.001–3.785], P>0.151 for disability. The Cox regression analysis for predicting the survival time of pain disability showed that the PVAQ score was a significant predictor and was the only covariate entered in the final model. The residual chi-square statistics for the genetic variables showed scores ranging between χ2=[0.003–5.161] that were again not significant at α=0.05. High preoperative PVAQ scores were significantly associated with low likelihood to reach low pain-related disability fast (χ2 [df =1] =4.512, HR =0.980, 95% confidence interval 0.962–0.998, P=0.034). For example, patients in the upper quartile of the PVAQ mean sum score (≥40.25) required a mean time of 24.55 weeks until recovery, whereas patients with a PVAQ score in the lower quartile (≤27.00) took on average only 16.40 weeks. However, the value of the HR reaching almost 1 suggested that this effect was at best small. In contrast, the attentional bias for positive words could not significantly predict the survival time until the patients reached low pain intensity (χ2 [df =1] =0.481, P=0.488).
Effect sizes
Subsequently, effect sizes (Cohen’s d) were calculated according to the outcome in pain intensity and disability at the assessment point 1 year after surgery (Table 4). For example, for the COMT haplotype composed of the minor alleles of the polymorphisms rs4646312T>C/rs165722T>C/rs6269A>G/rs4633T>C/rs4818C>G/rs4680A>G, the effect sizes reached almost medium values regarding both pain intensity and disability; the polymorphism IL1A rs1800587G>A had also similar effect size for pain disability. For some polymorphisms, the effect size calculation was based on frequencies of cases per cell that were lower than the minimum number required for a valid interpretation (n<2 expected and n<1 observed frequencies). For these genetic predictors, the effect sizes were considered only as preliminary and were not further interpreted (Table 4, d values marked in gray). Comparable to the effects of the genetic variables on pain intensity, the attentional bias for positive words reached only a small effect size (Table 4). In contrast, the PVAQ score surpassed the border for large effects (d=0.822).
Table 4.
Effect size measures for predictor variables at the latest postoperative session 1 year after surgery
| Predictor of 1-year postoperative outcome | Pain intensity | Pain disability |
|---|---|---|
|
| ||
| Cohen’s d | ||
| Genetic predictors (SNPs and haplotypes) | ||
| IL1A rs1800587 G>A | 0.975 | 0.465 |
| FAAH rs4141964 C>T | 0.191 | −0.184 |
| FAAH rs2295633 G>A | 0.220 | −0.155 |
| NK1R rs6715729 G>A | 0.041 | 0.555 |
| NR3C2 rs2070951 C>G | −0.474 | 0.972 |
| OPRD1 rs2234918 T>C | −0.244 | −0.244 |
| TGFB1 rs1800469 G>A | −0.333 | −1.217 |
| TRPV1 rs8065080 T>C | −0.070 | 0.304 |
| COMT C/C/G/C/G/Ga | 0.304 | −0.416 |
| COMT T/T/A/T/C/Ab | −0.374 | −0.374 |
| NK1R T/Ac | −0.416 | −0.070 |
| NK1R G/Ad | 0.280 | 0.164 |
| NK1R G/Ce | 0.041 | −0.243 |
| Psychological predictors | ||
| Attentional bias for positive words | 0.004 | |
| PVAQ | 0.822 | |
Notes:
Effect sizes given in gray correspond to 2×2 cross tabulations where either expected or observed frequencies were lower n<2 and cannot be considered as valid results. The algebraic sign denotes the direction of effects regarding the difference between carriers of the minor allele and noncarriers of the same. COMT haplotype rs4646312C/rs165722C/rs6269G/rs4633C/rs4818G/rs4680G;
COMT haplotype rs4646312T/rs165722T/rs6269A/rs4633T/rs4818C/rs4680A;
NK1R rs6741029T/rs735668A;
NK1R rs6741029G/rs735668A;
NK1R rs6741029G/rs735668C; d≥0.3, d≥0.5, and d≥0.8 for small, medium, and large effects, respectively.
Abbreviations: SNP, single nucleotide polymorphism; PVAQ, Pain Vigilance and Awareness Questionnaire; COMT, cathechol-O-methyl transferase gene; FAAH, fatty acid amino hydrolase gene; IL1A, interleukin 1 alpha gene; NK1R, tachykinin receptor 1 gene; NR3C2, nuclear receptor, subfamily 3, group C, member 2 gene; OPRD1, δ-opioid receptor gene; TGFB1, transforming growth factor, beta 1 gene; TRPV1, transient receptor potential cation channel, subfamily V, member 1 gene.
Summary of results
Cox regression analyses testing for influences of the genetic predictors on the course of postoperative pain intensity and disability could not reveal significant results. This was also the case when genetics were entered as additional variables to the prediction of postoperative outcome by the psychological predictors found to be effective in an earlier analysis in this sample. Effect size estimation revealed small to medium effects on pain intensity and disability at assessment time point 1 year after surgery for some genetic predictors. The PVAQ was associated with persistent pain disability on slightly significant level. The effect size reached a value for large effects suggesting higher levels of preoperatively reported pain vigilance as risk factor for long-term pain disability.
Discussion
In THE present study, we investigated whether SNPs in candidate pain genes were associated with pain-related outcome up to 1 year after surgery in a sample of preoperatively pain-free male patients undergoing funnel chest correction. Because the patients had not have any severe pain prior to surgery, the present surgical model provided ideal conditions for studying the development of chronic postoperative pain. SNPs were chosen to be located in genes involved in inflammation and immune response, as well as in genes frequently investigated in pain genetic research.9 The genetic predictors could not significantly contribute to the explanation of the time course of postoperative pain intensity and pain-related disability up to 1 year after surgery. Also, no statistically meaningful effects could be found when the genetic variables were tested as additional predictors adding explained variance to two psychological variables that proved to have high explanatory power for persistent postoperative pain intensity and disability in a previous study.15 Effect size estimation suggested low impact of the genetic predictors on both pain intensity and disability. Concerning the psychological predictors, the preoperative PVAQ score proved again to be a relevant predictor for lasting pain disability after surgery. In contrast, the preoperatively measured attentional bias to positive words assessed in a dot-probe task failed this time to predict chronic pain intensity.
The genetic variants previously reported to modulate pain in humans were not found to have meaningful influence on the course of pain-related outcome in the present clinical setting. The variants in the selected genes appeared not to be crucially involved in long-term consequences of thoracic tissue damage due to surgery. In fact, we tested genetic effects on the transition from acute to persistent postoperative pain and long-standing functional disability. Indeed, there is to date no evidence for genetic associations with the development of postoperative chronic pain46 after surgically produced tissue damage in preoperatively pain-free individuals. In contrast to the present cohort, populations investigated in other genetic association studies on postoperative pain often already had pain as a symptom of disease prior to surgery.13,47 However, even for SNPs or haplotypes in candidate genes frequently assessed in pain genetics, such as COMT, FAAH, or IL1A,9 no significant effects on pain continuation after surgery and its consequences could be found. Among these, variants in COMT13,47 and GCH148 genes had also been reported to affect the chronification of pain after surgery.
To further elucidate possible genetic effects that might not have been strong enough to surpass the level of significance, we additionally quantified the effects of the genetic predictors on postoperative outcome 1 year after surgery using effect sizes. Again, most of the genetic predictors had no meaningful impact. Nevertheless, some of them could reach small to medium effect sizes. The COMT haplotype composed of the minor alleles rs4646312T>C/rs165722T>C/rs6269A>G/rs4633T>C/rs4818C>G/rs4680A>G could be identified to have up to medium effect sizes on both pain intensity and disability at 1 year after surgery. The polymorphism IL1A rs1800587G>A reached similar effects on 1-year disability outcome. The IL1A gene codes for a proinflammatory protein of the cytokine family usually released as inflammatory or immune response. In our study, carriers of the minor allele of the IL1A polymorphism seem to be at higher risk for longstanding disability. The COMT gene codes for an enzyme acting in the metabolism of catecholamines, such as dopamine and epinephrine. The COMT haplotype composed of the minor alleles was associated with persistent pain intensity but less disability at 1 year after surgery. Notably, such interpre tations give a hint for further investigation rather than being definitive results as they are based on nonsignificant results in the main analyses and post hoc interpretations of the effect size calculations. However, for both genes, previous evidence exists showing association between variants in these genes and chronic pain. Specifically, simultaneous carriage of IL1A rs1800587C>T and IL1RN rs2234677G>A was a risk factor for low back pain and was also associated with reported pain intensity.49 The homozygous TT889(rs1800587C>T) genotype was shown to enhance the transcriptional activity of the IL1A gene.50 Translated to our results, this could mean that carriers of the minor allele have an increased production of messenger RNA and thus protein leading to a stronger proinflammatory regulation. The COMT haplotype ATCA (rs6269, rs4633, rs4818, rs4680) was associated with less pain disability and greater relief after lumbar disk surgery.47 Diatchenko et al reported, however, an opposite relationship between the same haplotype and experimental pain sensitivity.51
Furthermore, the effect sizes obtained for our genetic predictors of postoperative pain development were comparable to the effect sizes reported recently for several frequently occurring variants in human genes shown to modulate pain.52 Doehring et al52 estimated effect sizes for the impact of SNPs in the OPRM1, OPRD1, COMT, FAAH, GCH1, TRPV1 genes, and transient receptor potential cation channel, subfamily A, member 1 gene (TRPA1) on experimental pain thresholds to different stimuli. The genetic variants reached mainly modest, in some cases medium to high effect sizes (Cohen’s d=0.0–1.8). The COMT rs4646312C/rs165722C/rs6269G/rs4633C/rs4818G/rs4680G haplotype reached up to medium effect sizes in our study. Doehring et al also reported only small effect sizes on pain thresholds for cold and heat, electrical and blunt pressure stimuli (d=0.06–0.23, recessive hereditary model) for the same haplotype as assessed in our study.
Notably, it has been discussed that the reproducibility of genetic effects in pain research is often only modest6 and may not be verified by meta-analysis. Moreover, reproducibility of effects may be reduced by the coexistence of frequent variants in a single individual that act as confounders canceling out effects on phenotype.53 However, even for these two seemingly major influential genetic variables IL1A and COMT, the effects were below the effect shown for the preoperatively assessed pain hypervigilance as assessed by the questionnaire PVAQ. The self-reported attentional engagement toward pain-related bodily sensations had a large effect (d=0.82). Similarly, Doehring et al52 reported that the SNPs they assessed had smaller effect sizes compared with those of gender and sensitization by capsaicin. It seems important to consider such results when comparing genetic influences with those of other relevant factors.
Furthermore, our findings on the psychological predictors additionally indicate that it is of high clinical relevance to compare between pathophysiologically different predictor groups. We have already reported on the strength of the two psychological variables used in the present study to explain persistent pain and disability at 3 months and 6 months after surgery.15 Here, in this second analysis in the same but enlarged sample of patients, the PVAQ was the only significant predictor of survival time, even though the corresponding HR suggested low explanatory power. Individuals with higher levels of preoperatively reported pain vigilance tended to be at a risk for still experiencing pain-related disability at 1 year after surgery. The PVAQ also reached the highest effect size among all predictors, again supporting our previous results. In contrast, the attentional bias for positive words, assessed by the dot-probe task, was not able to explain lasting pain in the present study, thus complementing our previous results concerning persistent pain at 3 months and 6 months postsurgery.15 While at earlier time points, both psychological factors appeared to play a major role in the chronification process (Cohen’s d=0.5–0.7), the PVAQ remains the only psychological predictor when considering the final outcome 1 year postsurgery.
Pain research increasingly recognizes the necessity of addressing the complexity of pain phenotypes by considering large sets of risk and resilience factors as well as their interaction in explanatory models. In this sense, the present analysis has made use of two major predictor groups based on genetic and psychological risk factors in a comparative approach for explaining persistent pain after cosmetic thoracic surgery. Although no significant additive effects of the genetic with the psychological predictors could be shown, the results adumbrate concomitant influences of both predictor groups on chronic postoperative pain. Advanced analysis of the combined effects of genetic and psychological factors on long-standing consequences after surgery, for example, via classification and regression tree algorithms, are to be recommended for future studies on larger samples. Such combined examinations have already been reported for OPRD1 and TRPV1 variants on experimental pain sensitivity in dependence of personality traits,54 and COMT polymorphisms in interaction with pain-related catastrophic thinking and depressive mood on shoulder pain.55,56
There are some limitations of the present study. It is important to note that the study might be underpowered because of the small sample size. This is a clear limitation, probably leading to an underestimation of a genetic effect. Due to this limitation, certain allele groups were very small, and for some of the genetic variables, the results on the effect sizes could not be validly interpreted. Furthermore, the study sample comprised only young male patients undergoing funnel chest correction. This should be kept in mind when the results are transferred to other types of postoperative pain. Next, the present assessment has started a while ago with 31 pain-related genetic polymorphisms that built a comprehensive set of possible relevant genetic modulators at this time. However, it meanwhile represents a small subset from >400 genes being currently proven for their involvement in the multifactorial pathophysiology of pain.29 Finally, we tested possible multigene effects on the development of persistent postoperative pain in terms of statistically added explained variance by entering single genetic predictors but not their interaction in the regression model. This approach cannot fully consider functional interaction effects of genes on phenotype such as the coexistence of variants with opposite functional consequences on pain in the same individual;53 for example, FAAH rs2295633G>A57 and TRPV1 rs8065080T>C54 have been shown to be associated with increased and reduced pain sensitivity, respectively.
Conclusion
In conclusion, our results showed that common genetic variants previously associated with or functionally related to pain perception could not significantly predict the development of chronic postoperative pain as assessed in a longitudinal design in initially pain-free patients undergoing cosmetic thoracic surgery. According to effect size estimation, some promising suggestions for relevant genetic modulators could be made, as for a genetic variant of the IL1A gene and a haplotype of commonly investigated variants in the COMT gene. A comparison between pathophysiologically different predictor groups might help to identify clinically relevant predictors for chronic pain.
Supplementary materials
Graphical polyhierarchical representation of functional annotations assigned to the set of 17 genes.
Notes: The graph resulted from an over representation analysis (ORA) on the present set of 17 genes with the GeneTrial web-based analysis tool (http://genetrail.bioinf.uni-sb.de/).1 ORA determines a significant set of terms for given genes based on Fisher’s exact test statistics.2 Only terms that exceed a predefined P threshold (correction of α level included) are significantly annotated to the genes. The terms (gene ontology [GO] terms) are derived from a knowledge database, Gene Ontology (GO; http://www.geneontology.org/), where the major biological processes of genes, respectively, gene products, are described by a controlled vocabulary (so-called GO terms). In the present study, the specific ontology of GO terms related to the n=17 genes was derived using a reference set of 410 candidate pain genes from the study by Lötsch et al.3 For all GO terms of the specific ontology, the genes annotated to a particular GO term as a subset of the reference gene set were compared with the occurrence of the term among the subset of n=17. Threshold of tp=0.05 and false discovery rate correction of α level for multiple comparison were used. The red ellipses in the graph represent the significant terms annotated to the 17 selected genes. S1.
Table S1.
Significant GO term annotations for the n=17 genes
| GO terms | GO term ID | Nr expected genes | Nr observed genes | P-values (FDR) |
|---|---|---|---|---|
| Response to molecule of bacterial origin | GO:0002237 | 1.09809 | 7 | 0.00109967 |
| Response to biotic stimulus | GO:0009607 | 1.42344 | 8 | 0.00109967 |
| Response to lipopolysaccharide | GO:0032496 | 1.05742 | 7 | 0.00109967 |
| Response to other organism | GO:0051707 | 1.38278 | 8 | 0.00109967 |
| Response to bacterium | GO:0009617 | 1.26077 | 7 | 0.00238186 |
| Immune system process | GO:0002376 | 3.70096 | 11 | 0.00252648 |
| Response to chemical stimulus | GO:0042221 | 6.26316 | 14 | 0.00252648 |
| Multi-organism process | GO:0051704 | 2.39952 | 9 | 0.00252648 |
| Immune response | GO:0006955 | 2.48086 | 9 | 0.00297911 |
| Defense response | GO:0006952 | 3.25359 | 10 | 0.00401951 |
| Response to stress | GO:0006950 | 6.18182 | 13 | 0.00984719 |
| Response to organic substance | GO:0010033 | 4.43301 | 11 | 0.00984719 |
| Inflammatory response | GO:0006954 | 2.5622 | 8 | 0.0177146 |
| Positive regulation of cellular component organization | GO:0051130 | 0.976077 | 5 | 0.018748 |
| Response to organic cyclic substance | GO:0014070 | 1.50478 | 6 | 0.0213529 |
| Sensory perception of pain | GO:0019233 | 1.54545 | 6 | 0.0232001 |
| Cognition | GO:0050890 | 3.70096 | 9 | 0.0385276 |
| Protein transport | GO:0015031 | 1.26077 | 5 | 0.0462816 |
| Establishment of protein localization | GO:0045184 | 1.26077 | 5 | 0.0462816 |
| Positive regulation of immune system process | GO:0002684 | 1.30144 | 5 | 0.0483854 |
| Sensory perception | GO:0007600 | 2.48086 | 7 | 0.0483854 |
Notes: The ORA analysis resulted in 21 significant functional annotations (GO terms IDs and respective GO terms). The expected and observed number of genes for each term and the respective corrected P-value (FDR) are given. GO terms marked in bold represent the seven most annotated biological processes, in which the selected genes are involved.
Abbreviations: ORA, overrepresentation analysis; GO, gene ontology; Nr, number; FDR, false discovery rate.
References
- 1.Keller A, Backes C, Al-Awadhi M, et al. GeneTrailExpress: a web-based pipeline for the statistical evaluation of microarray experiments. BMC Bioinformatics. 2008;9:552. doi: 10.1186/1471-2105-9-552. [DOI] [PMC free article] [PubMed] [Google Scholar]
- 2.Backes C, Keller A, Kuentzer J, et al. GeneTrail – advanced gene set enrichment analysis. Nucleic Acids Res. 2007;35(Web Server issue):W186–W192. doi: 10.1093/nar/gkm323. [DOI] [PMC free article] [PubMed] [Google Scholar]
- 3.Lotsch J, Doehring A, Mogil JS, Arndt T, Geisslinger G, Ultsch A. Functional genomics of pain in analgesic drug development and therapy. Pharmacol Ther. 2013;139(1):60–70. doi: 10.1016/j.pharmthera.2013.04.004. [DOI] [PubMed] [Google Scholar]
Acknowledgments
This study was supported by the Deutsche Forschungsgemeinschaft (La 685/6, SL). The research also received funding, in particular additional personnel costs, from the Else Kröner – Fresenius Foundation (EKFS), Research Training Group Translational Research Innovation – Pharma (TRIP, JL). The funders had no role in method design, data selection, and analysis, decision to publish, or preparation of the manuscript.
Footnotes
Disclosure
The authors report no conflicts of interest in this work.
References
- 1.Kehlet H, Jensen TS, Woolf CJ. Persistent postsurgical pain: risk factors and prevention. Lancet. 2006;367(9522):1618–1625. doi: 10.1016/S0140-6736(06)68700-X. [DOI] [PubMed] [Google Scholar]
- 2.Deumens R, Steyaert A, Forget P, et al. Prevention of chronic postoperative pain: cellular, molecular, and clinical insights for mechanism-based treatment approaches. Prog Neurobiol. 2013;104:1–37. doi: 10.1016/j.pneurobio.2013.01.002. [DOI] [PubMed] [Google Scholar]
- 3.Mogil JS, Grisel JE. Transgenic studies of pain. Pain. 1998;77(2):107–128. doi: 10.1016/S0304-3959(98)00093-1. [DOI] [PubMed] [Google Scholar]
- 4.Lacroix-Fralish ML, Mogil JS. Progress in genetic studies of pain and analgesia. Annu Rev Pharmacol Toxicol. 2009;49:97–121. doi: 10.1146/annurev-pharmtox-061008-103222. [DOI] [PMC free article] [PubMed] [Google Scholar]
- 5.Lötsch J, Geisslinger G. Current evidence for a modulation of nociception by human genetic polymorphisms. Pain. 2007;132(1–2):18–22. doi: 10.1016/j.pain.2007.06.024. [DOI] [PubMed] [Google Scholar]
- 6.Lötsch J, Geisslinger G. A critical appraisal of human genotyping for pain therapy. Trends Pharmacol Sci. 2010;31(7):312–317. doi: 10.1016/j.tips.2010.04.002. [DOI] [PubMed] [Google Scholar]
- 7.Mogil JS. Are we getting anywhere in human pain genetics? Pain. 2009;146(3):231–232. doi: 10.1016/j.pain.2009.07.023. [DOI] [PubMed] [Google Scholar]
- 8.Lacroix-Fralish ML, Ledoux JB, Mogil JS. The Pain Genes Database: an interactive web browser of pain-related transgenic knockout studies. Pain. 2007;131(1–2):3.e1–e4. doi: 10.1016/j.pain.2007.04.041. [DOI] [PubMed] [Google Scholar]
- 9.Mogil JS. Pain genetics: past, present and future. Trends Genet. 2012;28(6):258–266. doi: 10.1016/j.tig.2012.02.004. [DOI] [PubMed] [Google Scholar]
- 10.Stephens K, Cooper BA, West C, et al. Associations between cytokine gene variations and severe persistent breast pain in women following breast cancer surgery. J Pain. 2014;15(2):169–180. doi: 10.1016/j.jpain.2013.09.015. [DOI] [PMC free article] [PubMed] [Google Scholar]
- 11.Henker RA, Lewis A, Dai F, et al. The associations between OPRM 1 and COMT genotypes and postoperative pain, opioid use, and opioid-induced sedation. Biol Res Nurs. 2013;15(3):309–317. doi: 10.1177/1099800411436171. [DOI] [PMC free article] [PubMed] [Google Scholar]
- 12.Kambur O, Kaunisto MA, Tikkanen E, Leal SM, Ripatti S, Kalso EA. Effect of catechol-O-methyltransferase-gene (COMT) variants on experimental and acute postoperative pain in 1,000 women undergoing surgery for breast cancer. Anesthesiology. 2013;119(6):1422–1433. doi: 10.1097/ALN.0000000000000013. [DOI] [PMC free article] [PubMed] [Google Scholar]
- 13.Lee PJ, Delaney P, Keogh J, Sleeman D, Shorten GD. Catecholamine-O-methyltransferase polymorphisms are associated with postoperative pain intensity. Clin J Pain. 2011;27(2):93–101. doi: 10.1097/AJP.0b013e3181f15885. [DOI] [PubMed] [Google Scholar]
- 14.Kolesnikov Y, Gabovits B, Levin A, et al. Chronic pain after lower abdominal surgery: do catechol-O-methyltransferase/opioid receptor mu-1 polymorphisms contribute? Mol Pain. 2013;9:19. doi: 10.1186/1744-8069-9-19. [DOI] [PMC free article] [PubMed] [Google Scholar]
- 15.Lautenbacher S, Huber C, Schöfer D, et al. Attentional and emotional mechanisms related to pain as predictors of chronic postoperative pain: a comparison with other psychological and physiological predictors. Pain. 2010;151(3):722–731. doi: 10.1016/j.pain.2010.08.041. [DOI] [PubMed] [Google Scholar]
- 16.Margraf J. Diagnostisches Kurz-Interview bei psychischen Störungen. Berlin: Springer; 1994. [Google Scholar]
- 17.Weber PG, Hummer HP. Die “neue” Erlanger Trichterbrustkorrektur - Minimalisierung eines bewährten Verfahrens [The “new” Erlangen technique of funnel chest correction – minimalization of a well working procedure] Zentralbl Chir. 2006;131(6):493–498. doi: 10.1055/s-2006-956178. [DOI] [PubMed] [Google Scholar]
- 18.McCracken LM. “Attention” to pain in persons with chronic pain: a behavioural approach. Behav Res Ther. 1997;28:271–284. [Google Scholar]
- 19.Lautenbacher S, Huber C, Kunz M, et al. Hypervigilance as predictor of postoperative acute pain: its predictive potency compared with experimental pain sensitivity, cortisol reactivity, and affective state. Clin J Pain. 2009;25(2):92–100. doi: 10.1097/AJP.0b013e3181850dce. [DOI] [PubMed] [Google Scholar]
- 20.Seneviratne C, Ait-Daoud N, Ma JZ, Chen G, Johnson BA, Li MD. Susceptibility locus in neurokinin-1 receptor gene associated with alcohol dependence. Neuropsychopharmacology. 2009;34(11):2442–2449. doi: 10.1038/npp.2009.65. [DOI] [PMC free article] [PubMed] [Google Scholar]
- 21.van Leeuwen N, Kumsta R, Entringer S, et al. Functional mineralocorticoid receptor (MR) gene variation influences the cortisol awakening response after dexamethasone. Psychoneuroendocrinology. 2010;35(3):339–349. doi: 10.1016/j.psyneuen.2009.07.006. [DOI] [PubMed] [Google Scholar]
- 22.Ashburner M, Ball CA, Blake JA, et al. Gene ontology: tool for the unification of biology. The Gene Ontology Consortium. Nat Genet. 2000;25(1):25–29. doi: 10.1038/75556. [DOI] [PMC free article] [PubMed] [Google Scholar]
- 23.Camon E, Magrane M, Barrell D, et al. The Gene Ontology Annotation (GOA) Database: sharing knowledge in Uniprot with Gene Ontology. Nucleic Acids Res. 2004;32(Database issue):D262–D266. doi: 10.1093/nar/gkh021. [DOI] [PMC free article] [PubMed] [Google Scholar]
- 24.Thomas PD, Mi H, Lewis S. Ontology annotation: mapping genomic regions to biological function. Curr Opin Chem Biol. 2007;11(1):4–11. doi: 10.1016/j.cbpa.2006.11.039. [DOI] [PubMed] [Google Scholar]
- 25.Backes C, Keller A, Kuentzer J, et al. GeneTrail – advanced gene set enrichment analysis. Nucleic Acids Res. 2007;35(Web Server issue):W186–W192. doi: 10.1093/nar/gkm323. [DOI] [PMC free article] [PubMed] [Google Scholar]
- 26.Keller A, Backes C, Al-Awadhi M, et al. GeneTrailExpress: a web-based pipeline for the statistical evaluation of microarray experiments. BMC Bioinformatics. 2008;9:552. doi: 10.1186/1471-2105-9-552. [DOI] [PMC free article] [PubMed] [Google Scholar]
- 27.Ultsch A, Lotsch J. What do all the (human) micro-RNAs do? BMC Genomics. 2014;15:976. doi: 10.1186/1471-2164-15-976. [DOI] [PMC free article] [PubMed] [Google Scholar]
- 28.Ultsch A, Lotsch J. Functional abstraction as a method to discover knowledge in gene ontologies. PLoS One. 2014;9(2):e90191. doi: 10.1371/journal.pone.0090191. [DOI] [PMC free article] [PubMed] [Google Scholar]
- 29.Lotsch J, Doehring A, Mogil JS, Arndt T, Geisslinger G, Ultsch A. Functional genomics of pain in analgesic drug development and therapy. Pharmacol Ther. 2013;139(1):60–70. doi: 10.1016/j.pharmthera.2013.04.004. [DOI] [PubMed] [Google Scholar]
- 30.Benjamini Y, Hochberg Y. Controlling the false discovery rate – a practical and powerful approach to multiple testing. J R Stat Soc B. 1995;57:289–300. [Google Scholar]
- 31.Carbon S, Ireland A, Mungall CJ, et al. Web Presence Working Group AmiGO: online access to ontology and annotation data. Bioinformatics. 2009;25(2):288–289. doi: 10.1093/bioinformatics/btn615. [DOI] [PMC free article] [PubMed] [Google Scholar]
- 32.Baum C, Huber C, Schneider R, Lautenbacher S. Prediction of experimental pain sensitivity by attention to pain-related stimuli in healthy individuals. Percept Mot Skills. 2011;112(3):926–946. doi: 10.2466/02.09.22.PMS.112.3.926-946. [DOI] [PubMed] [Google Scholar]
- 33.Dimova V, Horn C, Parthum A, et al. Does severe acute pain provoke lasting changes in attentional and emotional mechanisms of pain-related processing? A longitudinal study. Pain. 2013;154(12):2737–2744. doi: 10.1016/j.pain.2013.08.005. [DOI] [PubMed] [Google Scholar]
- 34.Keogh E, Ellery D, Hunt C, Hannent I. Selective attentional bias for pain-related stimuli amongst pain fearful individuals. Pain. 2001;91(1–2):91–100. doi: 10.1016/s0304-3959(00)00422-x. [DOI] [PubMed] [Google Scholar]
- 35.Lautenbacher S, Huber C, Baum C, Rossaint R, Hochrein S, Heesen M. Attentional avoidance of negative experiences as predictor of postoperative pain ratings and consumption of analgesics: comparison with other psychological predictors. Pain Med. 2011;12(4):645–653. doi: 10.1111/j.1526-4637.2011.01076.x. [DOI] [PubMed] [Google Scholar]
- 36.Nagel B, Gerbershagen HU, Lindena G, Pfingsten M. Entwicklung und empirische Überprüfung des Deutschen Schmerzfragebogens der DGSS [Development and evaluation of the multidimensional German pain questionnaire] Schmerz. 2002;16(4):263–270. doi: 10.1007/s00482-002-0162-1. [DOI] [PubMed] [Google Scholar]
- 37.Hardy GH. Mendelian proportions in a mixed population. Science. 1908;28:49–50. doi: 10.1126/science.28.706.49. [DOI] [PubMed] [Google Scholar]
- 38.Barrett JC, Fry B, Maller J, Daly MJ. Haploview: analysis and visualization of LD and haplotype maps. Bioinformatics. 2005;21(2):263–265. doi: 10.1093/bioinformatics/bth457. [DOI] [PubMed] [Google Scholar]
- 39.Gabriel SB, Schaffner SF, Nguyen H, et al. The structure of haplotype blocks in the human genome. Science. 2002;296(5576):2225–2229. doi: 10.1126/science.1069424. [DOI] [PubMed] [Google Scholar]
- 40.Stephens M, Donnelly P. A comparison of bayesian methods for haplo-type reconstruction from population genotype data. Am J Hum Genet. 2003;73(5):1162–1169. doi: 10.1086/379378. [DOI] [PMC free article] [PubMed] [Google Scholar]
- 41.Stephens M, Smith NJ, Donnelly P. A new statistical method for haplotype reconstruction from population data. Am J Hum Genet. 2001;68(4):978–989. doi: 10.1086/319501. [DOI] [PMC free article] [PubMed] [Google Scholar]
- 42.Farrar JT, Berlin JA, Strom BL. Clinically important changes in acute pain outcome measures: a validation study. J Pain Symptom Manage. 2003;25(5):406–411. doi: 10.1016/s0885-3924(03)00162-3. [DOI] [PubMed] [Google Scholar]
- 43.Dillmann U, Nilges P, Saile H, Gerbershagen HU. Behinderungsein-schätzung bei chronischen Schmerzpatienten [Assessing disability in chronic pain patients] Schmerz. 1994;8(2):100–110. doi: 10.1007/BF02530415. [DOI] [PubMed] [Google Scholar]
- 44.Cox D. Regression models and life tabels. J R Stat Soc B. 1972;34:187–220. [Google Scholar]
- 45.Cohen J. Statistical Power Analysis for the Behavioral Sciences. New York: Academic Press; 1998. [Google Scholar]
- 46.Katz J, Seltzer Z. Transition from acute to chronic postsurgical pain: risk factors and protective factors. Expert Rev Neurother. 2009;9(5):723–744. doi: 10.1586/ern.09.20. [DOI] [PubMed] [Google Scholar]
- 47.Dai F, Belfer I, Schwartz CE, et al. Association of catechol-O-methyltransferase genetic variants with outcome in patients undergoing surgical treatment for lumbar degenerative disc disease. Spine J. 2010;10(11):949–957. doi: 10.1016/j.spinee.2010.07.387. [DOI] [PubMed] [Google Scholar]
- 48.Tegeder I, Costigan M, Griffin RS, et al. GTP cyclohydrolase and tetrahydrobiopterin regulate pain sensitivity and persistence. Nat Med. 2006;12(11):1269–1277. doi: 10.1038/nm1490. [DOI] [PubMed] [Google Scholar]
- 49.Solovieva S, Leino-Arjas P, Saarela J, Luoma K, Raininko R, Riihimaki H. Possible association of interleukin 1 gene locus polymorphisms with low back pain. Pain. 2004;109(1–2):8–19. doi: 10.1016/j.pain.2003.10.020. [DOI] [PubMed] [Google Scholar]
- 50.Dominici R, Cattaneo M, Malferrari G, et al. Cloning and functional analysis of the allelic polymorphism in the transcription regulatory region of interleukin-1 alpha. Immunogenetics. 2002;54(2):82–86. doi: 10.1007/s00251-002-0445-9. [DOI] [PubMed] [Google Scholar]
- 51.Diatchenko L, Slade GD, Nackley AG, et al. Genetic basis for individual variations in pain perception and the development of a chronic pain condition. Hum Mol Genet. 2005;14(1):135–143. doi: 10.1093/hmg/ddi013. [DOI] [PubMed] [Google Scholar]
- 52.Doehring A, Kusener N, Fluhr K, Neddermeyer TJ, Schneider G, Lotsch J. Effect sizes in experimental pain produced by gender, genetic variants and sensitization procedures. PLoS One. 2011;6(3):e17724. doi: 10.1371/journal.pone.0017724. [DOI] [PMC free article] [PubMed] [Google Scholar]
- 53.Lötsch J, Fluhr K, Neddermayer T, Doehring A, Geisslinger G. The consequence of concomitantly present functional genetic variants for the identification of functional genotype-phenotype associations in pain. Clin Pharmacol Ther. 2009;85(1):25–30. doi: 10.1038/clpt.2008.103. [DOI] [PubMed] [Google Scholar]
- 54.Kim H, Neubert JK, San Miguel A, et al. Genetic influence on variability in human acute experimental pain sensitivity associated with gender, ethnicity and psychological temperament. Pain. 2004;109(3):488–496. doi: 10.1016/j.pain.2004.02.027. [DOI] [PubMed] [Google Scholar]
- 55.George SZ, Parr JJ, Wallace MR, et al. Biopsychosocial influence on exercise-induced injury: genetic and psychological combinations are predictive of shoulder pain phenotypes. J Pain. 2014;15(1):68–80. doi: 10.1016/j.jpain.2013.09.012. [DOI] [PMC free article] [PubMed] [Google Scholar]
- 56.George SZ, Hirsh AT. Psychologic influence on experimental pain sensitivity and clinical pain intensity for patients with shoulder pain. J Pain. 2009;10(3):293–299. doi: 10.1016/j.jpain.2008.09.004. [DOI] [PMC free article] [PubMed] [Google Scholar]
- 57.Kim H, Mittal DP, Iadarola MJ, Dionne RA. Genetic predictors for acute experimental cold and heat pain sensitivity in humans. J Med Genet. 2006;43(8):e40. doi: 10.1136/jmg.2005.036079. [DOI] [PMC free article] [PubMed] [Google Scholar]
- 58.Bachvarov DR, Landry M, Houle S, Pare P, Marceau F. Altered frequency of a promoter polymorphic allele of the kinin B1 receptor gene in inflammatory bowel disease. Gastroenterology. 1998;115(5):1045–1048. doi: 10.1016/s0016-5085(98)70071-x. [DOI] [PubMed] [Google Scholar]
- 59.Ferrero-Miliani L, Nielsen OH, Andersen PS, Girardin SE. Chronic inflammation: importance of NOD2 and NALP3 in interleukin-1beta generation. Clin Exp Immunol. 2007;147(2):227–235. doi: 10.1111/j.1365-2249.2006.03261.x. [DOI] [PMC free article] [PubMed] [Google Scholar]
- 60.Diatchenko L, Nackley AG, Slade GD, et al. Catechol-O-methyltransferase gene polymorphisms are associated with multiple pain-evoking stimuli. Pain. 2006;125(3):216–224. doi: 10.1016/j.pain.2006.05.024. [DOI] [PubMed] [Google Scholar]
- 61.Zubieta JK, Heitzeg MM, Smith YR, et al. COMT val158met genotype affects mu-opioid neurotransmitter responses to a pain stressor. Science. 2003;299(5610):1240–1243. doi: 10.1126/science.1078546. [DOI] [PubMed] [Google Scholar]
- 62.Lötsch J, Belfer I, Kirchhof A, et al. Reliable screening for a pain-protective haplotype in the GTP cyclohydrolase 1 gene (GCH1) through the use of 3 or fewer single nucleotide polymorphisms. Clin Chem. 2007;53(6):1010–1015. doi: 10.1373/clinchem.2006.082883. [DOI] [PubMed] [Google Scholar]
- 63.Bessler H, Shavit Y, Mayburd E, Smirnov G, Beilin B. Postoperative pain, morphine consumption, and genetic polymorphism of IL-1beta and IL-1 receptor antagonist. Neurosci Lett. 2006;404(1–2):154–158. doi: 10.1016/j.neulet.2006.05.030. [DOI] [PubMed] [Google Scholar]
- 64.Guimaraes AL, de Sa AR, Victoria JM, de Fatima Correia-Silva J, Gomez MV, Gomez RS. Interleukin-1beta and serotonin transporter gene polymorphisms in burning mouth syndrome patients. J Pain. 2006;7(9):654–658. doi: 10.1016/j.jpain.2006.02.011. [DOI] [PubMed] [Google Scholar]
- 65.Duerr RH, Taylor KD, Brant SR, et al. A genome-wide association study identifies IL23R as an inflammatory bowel disease gene. Science. 2006;314(5804):1461–1463. doi: 10.1126/science.1135245. [DOI] [PMC free article] [PubMed] [Google Scholar]
- 66.Rodriguez-Lopez J, Perez-Pampin E, Gomez-Reino JJ, Gonzalez A. Regulatory polymorphisms in extracellular matrix protease genes and susceptibility to rheumatoid arthritis: a case-control study. Arthritis Res Ther. 2006;8(1):R1. doi: 10.1186/ar1849. [DOI] [PMC free article] [PubMed] [Google Scholar]
- 67.Fillingim RB, Kaplan L, Staud R, et al. The A118G single nucleotide polymorphism of the mu-opioid receptor gene (OPRM1) is associated with pressure pain sensitivity in humans. J Pain. 2005;6(3):159–167. doi: 10.1016/j.jpain.2004.11.008. [DOI] [PubMed] [Google Scholar]
- 68.Sugiura Y, Niimi T, Sato S, et al. Transforming growth factor beta1 gene polymorphism in rheumatoid arthritis. Ann Rheum Dis. 2002;61(9):826–828. doi: 10.1136/ard.61.9.826. [DOI] [PMC free article] [PubMed] [Google Scholar]
- 69.Park JJ, Lee J, Kim MA, Back SK, Hong SK, Na HS. Induction of total insensitivity to capsaicin and hypersensitivity to garlic extract in human by decreased expression of TRPV1. Neurosci Lett. 2007;411(2):87–91. doi: 10.1016/j.neulet.2006.10.046. [DOI] [PubMed] [Google Scholar]
Associated Data
This section collects any data citations, data availability statements, or supplementary materials included in this article.
Supplementary Materials
Graphical polyhierarchical representation of functional annotations assigned to the set of 17 genes.
Notes: The graph resulted from an over representation analysis (ORA) on the present set of 17 genes with the GeneTrial web-based analysis tool (http://genetrail.bioinf.uni-sb.de/).1 ORA determines a significant set of terms for given genes based on Fisher’s exact test statistics.2 Only terms that exceed a predefined P threshold (correction of α level included) are significantly annotated to the genes. The terms (gene ontology [GO] terms) are derived from a knowledge database, Gene Ontology (GO; http://www.geneontology.org/), where the major biological processes of genes, respectively, gene products, are described by a controlled vocabulary (so-called GO terms). In the present study, the specific ontology of GO terms related to the n=17 genes was derived using a reference set of 410 candidate pain genes from the study by Lötsch et al.3 For all GO terms of the specific ontology, the genes annotated to a particular GO term as a subset of the reference gene set were compared with the occurrence of the term among the subset of n=17. Threshold of tp=0.05 and false discovery rate correction of α level for multiple comparison were used. The red ellipses in the graph represent the significant terms annotated to the 17 selected genes. S1.
Table S1.
Significant GO term annotations for the n=17 genes
| GO terms | GO term ID | Nr expected genes | Nr observed genes | P-values (FDR) |
|---|---|---|---|---|
| Response to molecule of bacterial origin | GO:0002237 | 1.09809 | 7 | 0.00109967 |
| Response to biotic stimulus | GO:0009607 | 1.42344 | 8 | 0.00109967 |
| Response to lipopolysaccharide | GO:0032496 | 1.05742 | 7 | 0.00109967 |
| Response to other organism | GO:0051707 | 1.38278 | 8 | 0.00109967 |
| Response to bacterium | GO:0009617 | 1.26077 | 7 | 0.00238186 |
| Immune system process | GO:0002376 | 3.70096 | 11 | 0.00252648 |
| Response to chemical stimulus | GO:0042221 | 6.26316 | 14 | 0.00252648 |
| Multi-organism process | GO:0051704 | 2.39952 | 9 | 0.00252648 |
| Immune response | GO:0006955 | 2.48086 | 9 | 0.00297911 |
| Defense response | GO:0006952 | 3.25359 | 10 | 0.00401951 |
| Response to stress | GO:0006950 | 6.18182 | 13 | 0.00984719 |
| Response to organic substance | GO:0010033 | 4.43301 | 11 | 0.00984719 |
| Inflammatory response | GO:0006954 | 2.5622 | 8 | 0.0177146 |
| Positive regulation of cellular component organization | GO:0051130 | 0.976077 | 5 | 0.018748 |
| Response to organic cyclic substance | GO:0014070 | 1.50478 | 6 | 0.0213529 |
| Sensory perception of pain | GO:0019233 | 1.54545 | 6 | 0.0232001 |
| Cognition | GO:0050890 | 3.70096 | 9 | 0.0385276 |
| Protein transport | GO:0015031 | 1.26077 | 5 | 0.0462816 |
| Establishment of protein localization | GO:0045184 | 1.26077 | 5 | 0.0462816 |
| Positive regulation of immune system process | GO:0002684 | 1.30144 | 5 | 0.0483854 |
| Sensory perception | GO:0007600 | 2.48086 | 7 | 0.0483854 |
Notes: The ORA analysis resulted in 21 significant functional annotations (GO terms IDs and respective GO terms). The expected and observed number of genes for each term and the respective corrected P-value (FDR) are given. GO terms marked in bold represent the seven most annotated biological processes, in which the selected genes are involved.
Abbreviations: ORA, overrepresentation analysis; GO, gene ontology; Nr, number; FDR, false discovery rate.