Abstract
Satellite remote sensing produces an abundance of environmental data that can be used in the study of human health. To support the development of early warning systems for mosquito-borne diseases, we developed an open-source, client based software application to enable the Epidemiological Applications of Spatial Technologies (EASTWeb). Two major design decisions were full automation of the discovery, retrieval and processing of remote sensing data from multiple sources, and making the system easily modifiable in response to changes in data availability and user needs. Key innovations that helped to achieve these goals were the implementation of a software framework for data downloading and the design of a scheduler that tracks the complex dependencies among multiple data processing tasks and makes the system resilient to external errors. EASTWeb has been successfully applied to support forecasting of West Nile virus outbreaks in the United States and malaria epidemics in the Ethiopian highlands.
Keywords: Software architecture, workflows, remote sensing, early warning, malaria, West Nile virus
1. Introduction
Satellite remote sensing technologies produce an abundance of environmental data that can be used in the study of human health (Ford et al., 2009). Measurements of reflected, emitted, and backscattered radiation provide information about patterns of vegetation, moisture, temperature, and other spatially and temporally variable characteristics of the Earth’s surface. These data can be applied to map environmental conditions that influence the development and transmission of pathogens, habitats for vectors and hosts, and human exposures (Estrada-Pena, 2002; Brown et al., 2008; Chuang et al., 2012a; Baeza et al., 2013). Remote sensing has also been used to monitor environmental health risks such as extreme heat events (Johnson et al., 2014) and air pollution (Martin, 2008), and to map human populations at risk of disease (Linard et al., 2010). These applications are highly relevant to new interdisciplinary fields such as One Health (Coker et al., 2011) and EcoHealth (Charron, 2012), which have expanded the scope of research on large-scale connections between ecosystems, global change, and human health. At the same time, the continued development of health geography (Kearns and Moon, 2002) and spatial epidemiology (Elliott and Wartenberg, 2004) has provided new conceptual models and analytical tools for the spatially explicit study of environmental health. The current constellation of earth observing satellites thus offers enormous potential for supporting transformational public health research and applications at scales ranging from local to global. In particular, the planetary scope and temporal consistency of most remote sensing missions can provide high-quality environmental monitoring data in developing countries where the health risks from environmentally-mediated infectious diseases are highest and data availability is the most limited.
There has been broad interest in using earth observation data for mapping and forecasting the risk of malaria and other mosquito-borne diseases (Kalluri et al., 2007; Anyamba et al., 2009; Machault et al., 2011). Satellite measurements of rainfall, vegetation greenness, soil moisture, and surface water can serve as indicators of potential mosquito breeding locations, and land surface and air temperature retrievals can provide information about rates of mosquito and pathogen development as well as the frequency of mosquito bites. Mosquito-borne disease outbreaks exhibit lagged responses to these environmental fluctuations because mosquito population sizes and infection rates require time to increase to levels that can trigger an outbreak (Teklehaimanot et al., 2004). Therefore, environmental monitoring using satellite remote sensing has been proposed for developing early warning systems to forecast future epidemics (Rogers et al., 2002; Ceccato et al., 2007; Midekisa et al., 2012). However, this type of early warning application requires long-term historical datasets for model development as well as consistent and timely updates to support operational forecasting.
In the present research, our overarching goal was to implement and test early warning systems for case studies of two mosquito-borne diseases in different social and ecological contexts. West Nile virus (WNV) is a vector-borne and zoonotic disease for which birds are the primary zoonotic reservoir. Spatial and temporal variability in human disease occurrence has been associated with climatic fluctuations that influence vector and host populations (Soverow et al., 2009; Hartley et al., 2012; Kwan et al., 2012; Wimberly et al., 2014b). Our focal area for WNV encompassed South Dakota and the surrounding states in the Northern Great Plains of the United States, a region of high WNV risk (Wimberly et al., 2013). Malaria is a vector-borne disease caused by Plasmodium parasites that are transmitted between human hosts by mosquitoes. In many environmental settings, the transmission of malaria is highly sensitive to seasonal and interannual fluctuations in air temperature, rainfall, and other environmental factors that influence the population dynamics of the mosquito vector and development rate of the parasite (Stresman, 2010). Our focal area for malaria was the Amhara region of Ethiopia, a highland region with highly seasonal rainfall and strong elevation-driven temperature gradients where epidemics are associated with climatic fluctuations (Wimberly et al., 2012b).
In both case studies, the specific objectives were to identify environmental risk factors associated with high numbers of human disease cases at lead times ranging from weeks to months, and to use these risk factors to generate dynamic risk maps for use by the public health sector. To meet these objectives, we utilized environmental information from a variety of earth science data products. These products are produced by processing raw data acquired by sensors on board earth-observing satellites, and are then stored in online archives hosted by discipline-oriented data centers. Despite the fundamental similarities of many of the data products, they also have a diversity of source characteristics that include different access methods, data formats, grid sizes, time step lengths, and frequency and latency of updates. Multiple additional steps are therefore required before these “big data” can be linked with smaller epidemiological or entomological datasets for analysis and modeling, and the necessary workflows can be complex (Nativi et al., 2015; Vitolo et al., 2015). To achieve our goal of developing and implementing disease early warning systems, we therefore needed to (1) automatically acquire and process large volumes of historical remote sensing data from online archives, (2) process environmental data from disparate sources into a unified database format that could be linked to epidemiological data for model development, and (3) automatically update the environmental database to make forecasts as new data became available.
To address these needs, we developed the Epidemiological Applications of Spatial Technologies (EASTWeb) open-source software tool to facilitate access to earth science datasets for public health research and application. EASTWeb is a client-based desktop application that allows users to specify an area and time period of interest and then automatically carries out multiple data acquisition and processing steps to generate environmental variables that can be readily linked with epidemiological data. The application generates historical databases from archived data, and will continue to update them in real time as new data become available. Although the software was developed to support disease early warning in our case study areas, it also has the potential to be used more broadly by GIS analysts, biostatisticians, epidemiologists, and others who need access to streams of environmental information that can be immediately connected with health outcome data to conduct analyses and generate risk maps, forecasts, and other products. In this paper we describe the design of the EASTWeb software, highlight key elements of the system architecture that were developed to achieve our project objectives, present examples of how the software has been applied to support the forecasting of mosquito-borne diseases, and discuss lessons learned and future development plans.
2. System Overview
EASTWeb is an open-source client-based application that automatically connects to earth science data archives and acquires, processes, and summarizes selected remote sensing datasets. The user defines a project by specifying a geographic extent and historical time period and providing geospatial data layers that mask out water bodies and characterize the extent and minimum mapping unit of the epidemiological data (e.g., counties, census tracts, or buffered plots) that will be integrated with the remote sensing data stream. After first building a historical database, EASTWeb continues to add information as new data become available on the earth science data archives. Environmental data summaries are stored in a relational database that can be easily queried and linked to ecological and epidemiological datasets for analysis and forecasting in R and other software environments. The software is programmed using JAVA for overall system control and uses the Standard Widget Toolkit (SWT, (https://www.eclipse.org/swt/) for user interface development. Spatial analyses are carried out using the open source Geospatial Data Abstraction Library (http://www.gdal.org). PostgreSQL (http://www.postgresql.org) is used to store and manipulate the resulting data summaries. The EASTWeb system has been tested and run in Windows 7 and Windows 8. The software package provided on the EASTWeb website (https://epidemia.sdstate.edu/eastweb/) is for Windows.
The current version of EASTWeb incorporates information streams from multiple earth science data archives. MODIS land surface temperature (MOD11A2) and nadir BRDF-adjusted reflectance (MCD43B4) products are obtained from the Land Processes Distributed Active Archive Center (LP DAAC, https://lpdaac.usgs.gov). TRMM rainfall products (3B42 and 3B42RT) are obtained from the Goddard Earth Sciences Data and Information Services Center (GES DISC, http://disc.sci.gsfc.nasa.gov/). The daily potential evapotranspiration (ETo) product is obtained from the USGS Early Warning and Environmental Monitoring Program (https://earlywarning.usgs.gov/) (Table 1).
Table 1.
Remote sensing data products ingested and processed by the EASTWeb application.
| Product | Description | Archive | Spatial Resolution | Temporal Resolution | File Format |
|---|---|---|---|---|---|
| MODIS MCD43B41 | BRDF-adjusted surface reflectance | LP DAAC | 1 km | 8d | HDF |
| MODIS MOD11A22 | Land surface temperature | LP DAAC | 1 km | 8d | HDF |
| TRMM 3B423 | Precipitation | GES DISC | 0.25 deg | 1d | NetCDF |
| TRMM 3B42RT3 | Precipitation | GES DISC | 0.25 deg | 1d | NetCDF |
| Global ETo4 | Global potential evapotranspiration | FEWS NET | 1 degree | 1d | GeoTIFF |
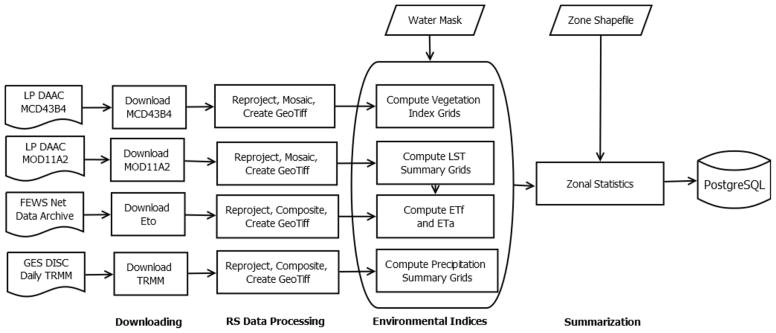
The EASTWeb system encompasses four main types of data processing (Figure 1): downloading data from online archives, remote sensing data processing, computing environmental indices, and summarizing data. The downloading step acquires data for the selected study area and time period. Downloaded data come in a variety of formats including scientific data libraries such as NetCDF and HDF as well as geoferenced image formats such as GeoTIFF.
Figure 1.
Data flow of the EASTWeb system highlighting four sources of remotely-sensed data and the four main data processing steps: downloading, remote sensing data processing, computing environmental indices, and summarizing data.
Remote sensing data processing involves extracting the necessary data layers from the downloaded files, converting all data to a common GeoTIFF format, reprojecting the data to the same map projection, and mosaicking and clipping the data to match the specified study region. Computing environmental indices involves calculating different indices for each data product. MODIS land surface data are used to extract daytime and nighttime land surface temperatures and to compute a mean daily temperature based on these values. MODIS reflectance data in visible, near-infrared, and middle infrared bands are used to calculate a variety of standard spectral indices including the normalized difference vegetation index (NDVI), enhanced vegetation index (EVI), soil-adjusted vegetation index (SAVI), and various forms of the normalized difference water index (NDWI). EASTWeb also includes an algorithm to compute actual evapotranspiration from elevation-corrected land surface temperature and ETo using a simplified surface energy balance (SSEB) methodology (Senay et al., 2007). This algorithm uses MODIS land surface temperature, MODIS NDVI, and a user-supplied elevation layer to downscale and adjust the ETo dataset, resulting in estimates of actual evapotranspiration at a 1 km spatial resolution. The environmental index data are stored in GeoTIFF format.
Data summarization includes temporal summaries of the environmental indices, in which daily data like the TRMM precipitation products are summarized over standard 8-day MODIS composite periods to match the temporal resolution of the MODIS products. Spatial summaries of the environmental indices are also generated by computing zonal statistics based on user-supplied datasets. A mask grid is provided by the user and can be used to exclude open water and uninhabited areas from the zonal statistics calculations. Zones typically represent counties, districts, census tracts, zip codes, or other areal units for which epidemiological data summaries are available.
3. Architectural Design and Implementation
To help meet the objectives of our early warning project, a major goal of the architectural design of the EASTWeb software is to reliably automate all of the necessary workflow steps so that we can obtain environmental indices in a format ready for visualization and data analysis with a minimal investment of time and effort. Users should not need to provide any additional inputs or requests once a project has been initialized. The software also needs to be able to handle the changing requirements that occur during the software development or after the delivery of the system. For example, EASTWeb needs to support the addition of novel sources of remote sensing data from new missions and the calculation of new environmental indices. These critical user requirements are reflected in the following two design decisions:
Design Decision 1: The software should automate the discovery and processing of remotely-sensed environmental datasets
EASTWeb automates the four major data processing steps. One challenge in achieving this objective is that the system must deal with a large volume of data in the downloading and processing stages. Even if the system itself is functioning correctly, errors still could happen due to the external factors. For example, the network connection may be lost while downloading from an earth science data archive, or the archives may be taken offline temporarily for maintenance. As a result, the system must not only automate the sequence of processing tasks without internal errors, but also automatically rediscover and reprocess the datasets from the point where an external error occurs.
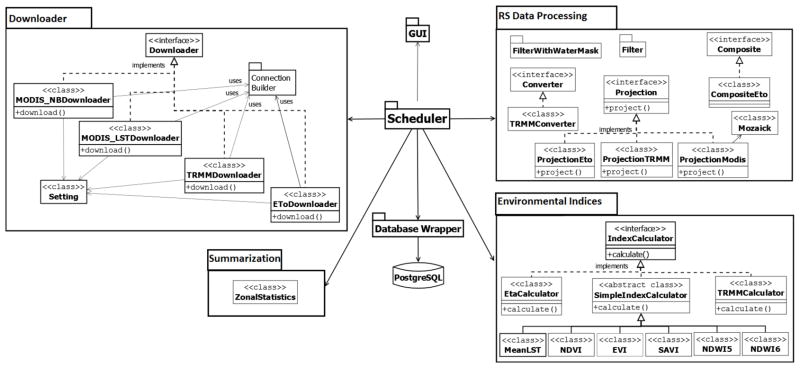
Each major processing step in EASTWeb is abstracted into a component. Four components Downloading, RS Data Processing, Environmental Indices, and Summarization, are mapped to the four major processing steps, respectively. The Database Wrapper component and the Graphical User Interface (GUI) component are introduced to the system to provide convenient ways for querying the database and facilitate the user’s interaction with the system, respectively. To address design decision 1, a Scheduler is designed to coordinate these components to perform the automation of discovering and processing the datasets. Figure 2 shows the high-level architectural design of EASTWeb. Detailed descriptions of the major components are provided in the next section.
Figure 2.
The high-level architecture of EASTWeb, illustrating the major system components.
Design Decision 2: The system should be easily maintainable
The components designed for the four major data processing steps should be easily upgradable and modifiable. In particular, the availability of remotely-sensed data products changes continually as new missions are implemented, new products are created, and existing products are updated. In addition, users may require the calculation of new environmental indices or different methods of summarization to address new scientific problems and applications. The various software components should not need to be completely redesigned or recoded to adapt to changing data availability or user needs.
To meet these needs, a framework and abstract interfaces are used to design the components. A framework is “a generic application that allows different applications to be created from a family of applications” (Schmid, 1999). In general, a framework represents a skeleton of a system that can be customized for a particular purpose. An abstract interface (Britton et al., 1981) of a module specifies the assumptions that are common to all of its implementations. The usage of the abstract interface allows us to add a new implementation of the interface or replace an existing implementation of the interface with another one without impacting the other modules. Both frameworks and abstract interfaces are techniques for helping the system adapt to the changing requirements with minimal impact on the system itself.
4. System Components
4.1. Downloading component
The Downloading component automatically downloads historical MODIS, TRMM, and ETo data from the starting time set by the user up to the current date. Once the historical database has been compiled, the Downloading component will continue to download new data as they become available in the online archives. For a certain data stream, both its communication protocol (such as HTTP, FTP, etc.) and its file location (URI) are subject to change, potentially requiring major revisions to the code. Thus, we developed a downloading framework FDEOD (Hu et al., 2014) to help minimize the impacts of these changes on the system. In the current version of EASTWeb, the Downloading component is actually the downloading framework with MODIS, TRMM and ETo data products implemented.
The downloading framework uses an abstract interface Downloader with a method download() to support the implementation of each data product. The information about the data product, such as its URI and the communication protocol that it uses, are stored in an XML document. The Connection Builder component provides the facilities of parsing the XML document to extract the data stream information, accessing existing communication protocols and adding the new communication protocols. If there are changes to the communication protocol or the URI for a certain data product, modifications only need to be made to its corresponding information in the XML document. The downloading framework can thereby adjust the data stream to the new settings automatically without requesting changes to the code of the downloader.
4.2. RS Processing component
The RS Processing component contains all subcomponents that are needed for processing the downloaded MODIS, TRMM and ETo data. The subcomponents include Projection for reprojecting a particular data product into the projection selected by the user, Converter for handling TRMM data conversion, FilterWithWaterMask for masking the data, Composite for combining more than one data source together, Mozaick for mosaicking the tiles of the data, and Filter for screening the data to filter out invalid values. A partial set of the subcomponents can be used to process each type of data. For example, the TRMM data requires an additional conversion step that the other data types do not. Each subcomponent provides an abstract interface along with the implementations for the data products that require such process.
4.3. Environmental Indices component
The Environmental Indices component takes the remote sensing data processed by the RS Processing component and automatically calculates a variety of environmental metrics. Since there is likely to be a need to add new index computation methods into the system, the Environmental Indices component provides an abstract interface IndexCalculator to facilitate extension. An abstract class SimpleIndexCalculator implements the interface. SimpleIndexCalculator provides the implementation of common functionalities for calculating the standard vegetation indices and the daily mean summarization of the day and night LST. New index computation methods that are similar to these existing indices can be implemented as an extension to SimpleIndexCalculator. More complex index calculations can be implemented by the interface IndexCalculator in the same manner that the SSEB calculation of ETa is implemented in the current version of EASTWeb.
4.4. Summarization component
The Summarization component takes the results produced from the Environmental Indices component as input and computes spatial summaries. The current EASTWeb application implements this component as a single class with the functionality of calculating zonal summaries, in which summary statistics such as mean, standard deviation, minimum, and maximum are calculated via the spatial overlay of a vector GIS layer of polygons supplied by the user.
4.5. Database Wrapper Component
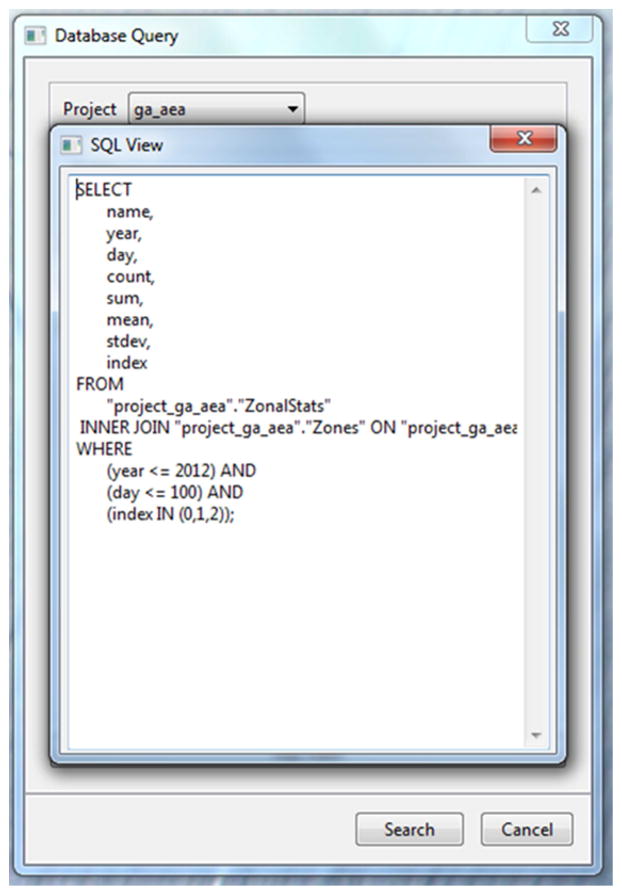
The results produced from the Summarization component are automatically stored into a database in PostgreSQL by the Database Wrapper component. The Database Wrapper component provides methods for building the SQL view for queries of environmental metrics, querying the database, and delivering the results.
4.6. Graphical User Interface (GUI) Component
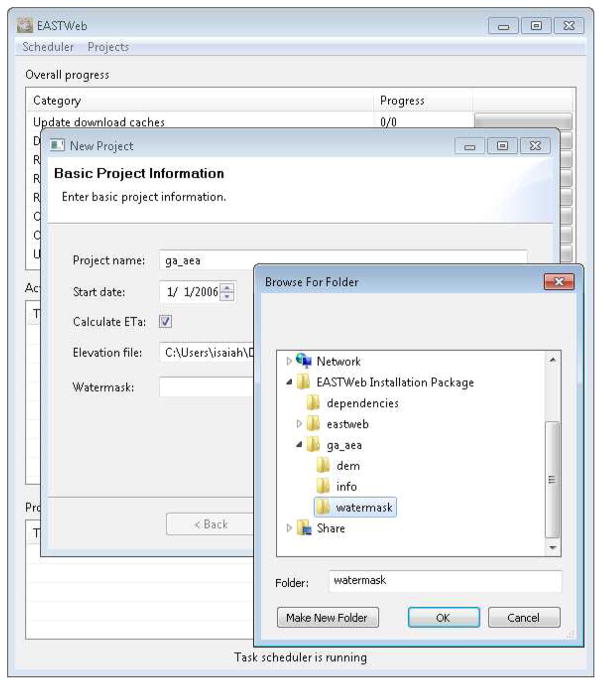
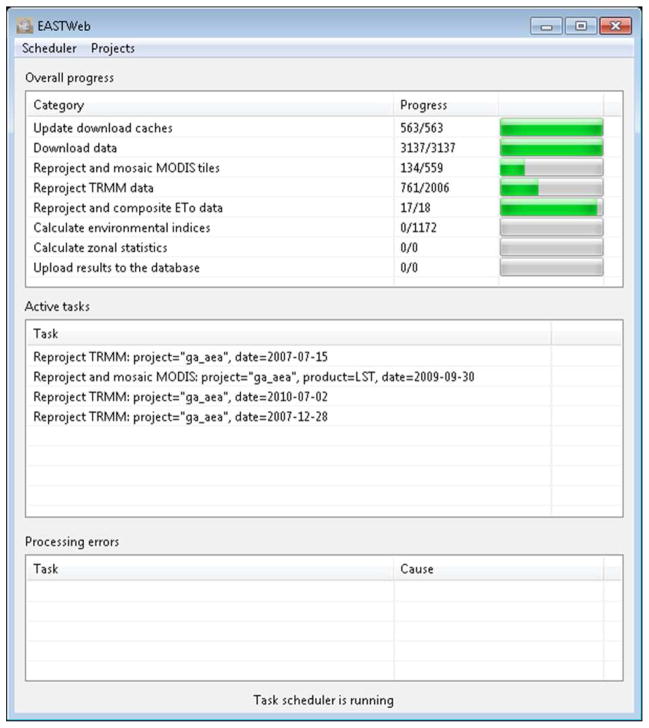
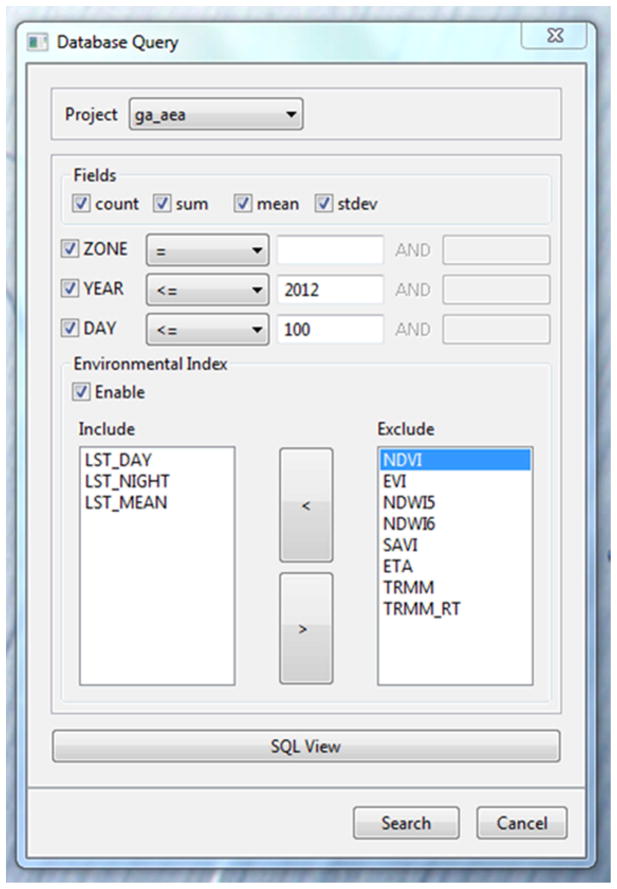
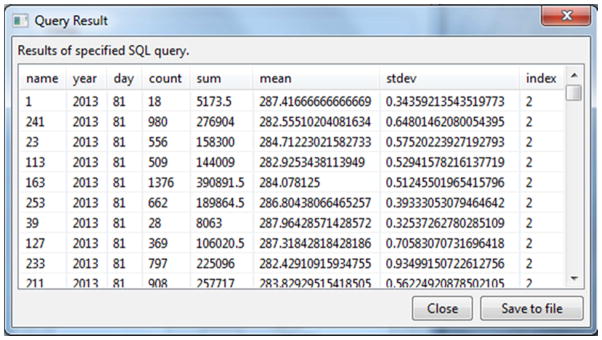
The GUI component provides a convenient way for the users to create projects, track the progress of the data processing steps, and retrieve the results from the database. A user can initiate a project with basic information including a project name, the start date for building the historical the data archive, and supplementary geospatial data layers such as a digital elevation model (DEM) and water mask (Figure 3). The user can also set the map projection for the processed data and upload additional geospatial data layers that will be used to summarize the environmental indices. The scheduler user interface (Figure 4) provides information on the current status of the multiple data processing steps managed by the scheduler. A database query user interface (Appendix A) is designed to allow the user to build queries to retrieve the results stored in the database, view the results and save them in a comma-separated values (csv) file.
Figure 3.
Graphical user interface for entering project information.
Figure 4.
Graphical user interface for monitoring the progress of processing tasks managed by the scheduler.
4.7. Scheduler Component
The Scheduler component is the “manager” of the other components in EASTWeb. It organizes and executes the steps of the data processing and thus enables the automation of the data processing workflow. The design of the Scheduler supports multitasking and multithreading such that the processing steps can be run in parallel as long as each step has the needed resources. The development of the Scheduler component was critical not only for achieving the first design decision, but also to make it possible to migrate the current EASTWeb application from a stand-alone desktop application to a distributed application residing on different computers.
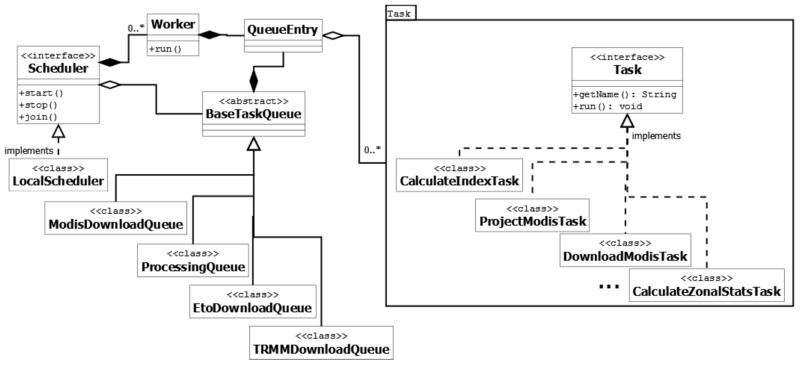
In the design of the Scheduler, each step involved in the data processing is defined as a task. For example, downloading MODIS data is a task and project MODIS data is another task. Each task uses its associated processing component to process data. For example, the task downloading MODIS data uses MODIS_LSTDownlader and MODIS_NBDownloader in the Downloading component. Figure 5 shows the Task interface and a partial view of the tasks dealing with the data processing in the component Task. Every task needs to implement the two methods declared in the interface Task: one is getName() for returning the task name, and the other is run() for invoking the right component to perform the needed data process.
Figure 5.
Major components of the EASTWeb scheduler.
In every project, the tasks must be organized in a certain order to correctly perform the data processing. For example, the task downloading MODIS data has to be executed before the task project MODIS data. The dependencies of the tasks are hosted in the metadata of each instance of a processing component. For example, in the Environmental Indices metadata for a particular project lists the tasks that need to be done prior to the index computation. The metadata are generated by each task that has dependency constraints.
The Scheduler is designed to organize the execution of tasks to enable the automation of data processing. In the Scheduler, the data structure queue is used to store and run the tasks performed in a certain processing step in the order that satisfies the dependencies of the tasks. A queue inserts tasks (by calling method enqueue) and removes them (by calling method dequeue) for execution according to the first-in first-out (FIFO) principle. For example, ModisDownloadQueue manages the downloading tasks of MODIS data, and ProcessingQueue manages the data processing tasks including projection, index calculation and zonal statistics. Worker threads take the tasks from the queue and run them.
The Scheduler provides an abstract interface Scheduler that contains methods start(), stop(), and join() for managing the queues. A concrete LocalScheduler implements those three methods in the interface Scheduler by using the queues (i.e., the instances of ModisDownloadQueue, TrmmDownloadQueue, EtoDownloadQueue, and ProcessingQueue). Figure 5 highlights the most important components in the Scheduler.
The queues are designed in a hierarchy of an abstract base class BaseTaskQueue and derived classes ModisDownloadQueue, TrmmDownloadQueue, EtoDownloadQueue, and ProcessingQueue. BaseTaskQueue provides the implementations to the methods start(), stop() and join() to add, terminate and join the worker threads. All the derived classes inherit these methods. BaseTaskQueue contains QueueEntry, in which a run() method is implemented to invoke the tasks. The worker threads call the run() method to actually run the tasks.
5. Disease Early Warning Applications
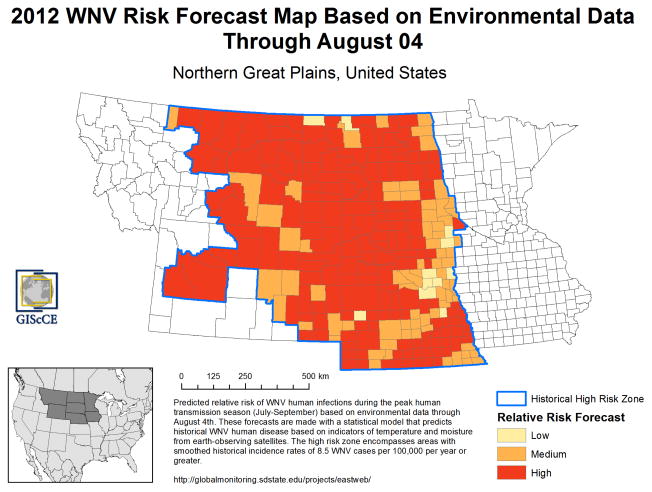
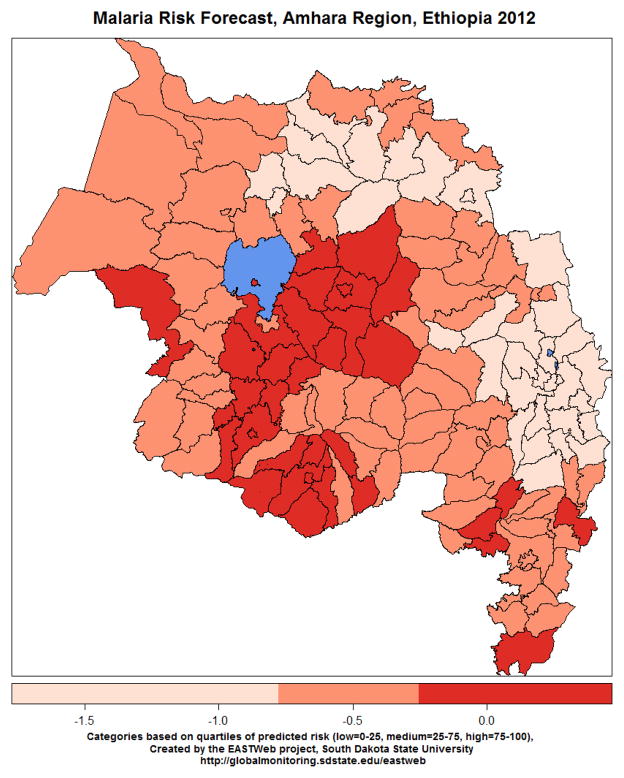
We used the EASTWeb software to create and update environmental databases to support early warning systems for West Nile virus and malaria outbreaks. In both of these case studies, all modeling, forecasting, and generation of risk maps was carried in the R software environment (R Development Core Team, 2015). We developed scripts in R to directly connect to EASTWeb’s PostgreSQL database, query the summarized environmental indices, join them to existing geospatial data layers and epidemiological datasets, and develop statistical models. These scripts also applied statistical modeling functions to generate forecasts when new environmental data were available and used graphical functions to automatically create risk maps based on these predictions (Figures 6–7). We found that directly connecting the EASTWeb database with R was an effective strategy for implementing disease early warning because it allowed us to leverage the automation and data processing capabilities of EASTWeb while also utilizing the modeling and mapping functionality already present in R.
Figure 6.
Example of a WNV risk map for the 2012 West Nile virus outbreak in the northern Great Plains generated using data processed with EASTWeb.
Figure 7.
Example of a malaria risk map for main epidemic season (September-December) in the Amhara region of Ethiopia generated using data processed with EASTWeb. Darker red shading indicates higher risk of a malaria epidemic.
5.1. West Nile Virus
West Nile virus (WNV) has had a substantial public health impact in the United States. A total of 39,557 WNV cases were reported to the Centers for Disease Control through 2013, including 17,463 cases of severe neuroinvasive disease and 1,668 deaths. Regional outbreaks of human WNV disease in 2012 and 2013 following several years of relatively low incidence have highlighted the need for a more comprehensive understanding of the spatial and temporal patterns of WNV and better tools for predicting when and where future outbreaks will occur (Chung et al., 2013). South Dakota, in particular, has the highest long-term WNV neuroinvasive disease incidence of any state (Wimberly et al., 2013). Previous research conducted in South Dakota and other NGP states has documented regional associations of human WNV disease with climatic gradients and land use patterns (Wimberly et al., 2008) as well as landscape-level associations with land cover, soils, and physiography (Chuang et al., 2012b). These relationships reflect the underlying influences of weather and land cover on the abundance of Culex tarsalis, the primary vector species in the region (Chuang et al., 2011).
Based on these results, a statistical model was developed to forecast the relative risk of human WNV across the NGP based on remotely sensed metrics of cumulative NDVI, land surface temperature, and actual evapotranspiration during the WNV amplification season from May through August (Chuang and Wimberly, 2012). The relative risk of WNV occurrence for each county, computed over the main West Nile virus season from June through September, was the dependent variable. Generalized additive models (GAMs) were fitted to predict relative risk at the county level using historical environmental and epidemiological data from 2004 through 2011. Model fit improved as the environmental metrics were summarized over longer parts of the season. For example, the adjusted R2 value of the fitted model was 0.41 when the fitted model was based on cumulate environmental variables summarized through the end of May, but increased to 0.61 when the cumulative environmental variables were summarized through the end of July.
EASTWeb was initially used to create the historical databases of NDVI, land surface temperature, and actual evapotranspiration that were used to develop these predictive models using data through the end of the 2010 WNV season. The software was then run starting in the spring of 2011 WNV to collect new environmental data, and these data were used to generate a series of predictions for the upcoming WNV season using the fitted models (Figure 6). At the end of the 2011 WNV season, the predictive models were refitted using the additional year of data and the process was repeated in subsequent years. Using this approach, we were able to make accurate regional forecasts of lower-than-average WNV risk in 2011, higher-than average WNV risk in 2012, and intermediate levels of WNV risk in 2013. However, predictions of the spatial patterns of high and low risk locations in each year generally were much less accurate at the individual county level.
5.2. Malaria
The Amhara region of Ethiopia is home to more than 17 million people and encompasses 157,000 km2 with elevations ranging from 506 m to 4533 m. A large percentage of the population (87.4%) lives in rural areas and practices subsistence agriculture. The region is characterized by a monsoon climate with a dry season extending from December through March, and a rainy season that typically begins in April and increases to a peak from June through August. The environment of this highland area supports unstable malaria transmission, posing a particular challenge for disease control and prevention. Although malaria transmission rates are relatively low and highly seasonal, interannual fluctuations in rainfall and temperature can increase transmission rates and trigger devastating epidemics (Abeku, 2007). Because of the low level of immunity in the population, malaria epidemics tend to cause severe morbidity and mortality in people of all ages. Knowing how climatic variability influences the timing and locations of malaria epidemics in advance would facilitate early warning and allow for more efficient targeting of resources for malaria prevention, control, and treatment (Guintran et al., 2006).
We used EASTWeb to process historical databases of remotely sensed land surface temperature, TRMM precipitation, NDVI, EVI, and actual evapotranspiration for the Amhara region and analyzed associations between climatic variability and malaria epidemics using a historical malaria surveillance dataset from 2001–2010 assembled by our Ethiopian collaborators (Wimberly et al., 2012b). An environmental model was developed to predict the relative risk of malaria during the main epidemic season from September-December based on environmental anomalies earlier in the year. The best fitting model included January-February precipitation anomalies, May-June land surface temperature anomalies, and April-May precipitation anomalies and had a cross-validated R2 of 0.39 (Wimberly et al., 2012a). We also found that malaria cases during the September-December main epidemic season were correlated with cases during the preceding May-June with a cross-validated R2 of 0.36. A model that included these May-June malaria cases in addition to the environmental variables had a higher R2 of 0.53.
These models were used to generate regional maps of malaria risk during the epidemic season in subsequent years (Figure 7). For example, the 2012 map predicted an increased risk of malaria epidemics compared to 2011 in many of the lower-elevation districts in the vicinity of Lake Tana. Our public health partners in the region reported that there were indeed several outbreaks of malaria in these districts. A separate analysis of monthly variability in malaria cases using time series modeling found consistent positive effects of land surface temperature on malaria cases at a one-month lag, and more variable effects of multiple moisture indicators including EVI, TRMM rainfall, and actual evapotranspiration at 1–3 month lags (Midekisa et al., 2012).
6. Discussion
Our successful application of EASTWeb to support these two disease forecasting efforts has demonstrated that there is a value in developing this type of user-friendly, client-side software for building and updating databases of remotely-sensed environmental variables. The strategy of capturing data from established earth science data archives strikes a middle ground between direct broadcast applications that offer the potential for near-real-time monitoring, but are likely to be too complex and computationally intensive to be implemented by a broad spectrum of end users, and the development of completely new, value added data products that would be updated less frequently. We have found that the latency of MODIS products available via the LP DAAC (typically about 1 week) and of TRMM products available via the GES DISC (typically less than 1 week) to be sufficient to implement seasonal disease forecasting models with lead times of several weeks or more. Thus, the EASTWeb software has the potential to serve as a more general solution to help bridge the gap between earth observation science and the application of geospatial technologies in the public health arena.
Public health experts often lack the specialized software, and technical knowledge required to undertake large remote sensing projects. These types of studies typically involve the implementation of complex scientific workflows involving data retrieval, cleaning, preparation, movement, analysis, and visualization (Littauer et al., 2012). A recent analysis of workflows from a variety of scientific disciplines found that data preparation steps were more common than any other workflow activity (Garijo et al., 2014). The burden of data acquisition and data preparation was particularly high in the geoinformatics domain, where these activities combined to account for more than 80% of the total processing steps. This finding emphasizes that data acquisition and processing needs pose significant barriers that limit the wide utilization of earth observations and other geospatial data by non-specialists in fields such as the health sciences. The availability of customized software to automate basic remote sensing data processing steps would thus allow end users to process data without developing custom scripts, eliminate the need to continually check online earth science data archives for newly available datasets, increase repeatability and consistency, and allow for greater focus on more critical steps related to data visualization and analysis.
6.1. Comparison with Other Approaches
A number of more generic scientific workflow systems such as Kepler and Taverna have been created to facilitate the broader use and reuse of scientific workflows by providing easy-to-use interactive platforms through which users can build, execute, and share workflows (Deelman et al., 2009). A major advantage of these systems is their generality and adaptability to a wide variety of applications. They also provide graphical interfaces that facilitate visualization of the workflow and minimize the amount of programming that is necessary to develop the workflow. However, sophisticated scientific workflow systems include a large number of features that are not necessary for every task, and therefore may not always be the most efficient solution for implementing more straightforward scientific data processing workflows (Gaustad et al., 2014).
Several other software tools have been designed to facilitate utilization of remote sensing data in the health sciences, primarily through the development of data products that are accessible via user-friendly, web-based interfaces. CDC Wonder, a searchable online public health database (http://wonder.cdc.gov/) has incorporated several remote sensing data products including MODIS-derived land surface temperature data and air quality predictions from 2003–2008, and NLDAS-derived air temperature, precipitation, and sunlight from 1979–2010 (Al-Hamdan et al., 2014). These data can be queried as county- and state-level spatial summaries for various temporal summary windows. The IRI/LDEO Climate Data Library (http://iridl.ldeo.columbia.edu/) provides access to a wide variety of climate datasets, including many remote sensing datasets, via a web application that allows customizable downloads via menus and a scripting interface (Blumenthal et al., 2014). Some of these products have been specifically developed to support malaria early warning and other disease forecasting and mapping projects in East Africa (Grover-Kopec et al., 2005; Ceccato et al., 2012). The Infusing Satellite Data into Environmental Applications (IDEA) project utilizes aerosol optical depth retrievals from multiple sensors to produce and disseminate daily air quality forecasts for the conterminous U.S. (http://www.star.nesdis.noaa.gov/smcd/spb/aq/). A follow-on project, IDEA-I (http://idea-i.ssec.wisc.edu/), generates forecasts of high aerosol events in support of international air quality forecasting activities. IDEA-I is implemented using the International MODIS and AIRS Processing Package (IMAPP), a software package that can generate a variety of environmental products from MODIS direct broadcasts.
Despite the existence of a variety of other web-based data portals and workflow applications, we feel that there is still value in developing simpler applications like EASTWeb that are more targeted to a specific application. EASTWeb represents a novel type of application that complements, but does not replicate existing tools, websites, and data products focused on remote sensing application in public health. In particular, our goal was not to facilitate public data access to environmental via a web-based solution, but instead to provide a specific workflow solution to support the creation and dissemination of value-added forecasts and maps. By developing a client-based application, we were able to address our specific needs for disease early warning by automating all of the necessary data processing tasks, while still providing enough flexibility so that projects could be customized for specific study areas and new data streams and environmental indices could be added in the future. However, as discussed in the next section, the core functionality of the EASTWeb application also can be generalized to support a broader range of environment health research and applications.
6.2. Future Directions
One of the limitations associated with a client-based system like EASTWeb is the need to download, process, and store large volumes of data on local computer systems. For example, running on a HP Z400 workstation with 4 CPUs (2.8GHz Intel Xeon processor each), 6GB RAM, and a 64-bit operating system, our existing software currently takes about 24 hours to completely process a 13-year archive of historical remote sensing for a project in the central United States encompassing 1.6 million km2 and including a total of 15 indices derived from two MODIS products, two daily global TRMM products, and a daily global potential evapotranspiration product. The total disk space requirement for this project is 430 GB which includes archiving all of the downloaded data as well as intermediate data files generated during processing. We believe that size of project should be feasible on most computers that are capable of running geographic information systems (GIS) applications such as ArcGIS, and inexpensive storage devices can be used to store multiple terabytes of data. The next version of EASTWeb, currently under development with support from the NASA Advancing Collaborative Connections for Earth System Science (ACCESS) program, will allow users more flexibility to customize data output by selecting the specific environmental indices to be computed and identifying which intermediate files must be archived and which ones can be deleted.
Because of the way that the scheduler handles multiple tasks, it will also be possible to migrate the EASTWeb system into a distributed environment with minor modifications. In such an environment, a project sends directions to the server to keep the summary database up-to-date for a certain date range, while the server maintains each project’s database and hosts the downloaded data and computed files. The current EASTWeb system supports multitasking and multithreading, so the processing components could be migrated to a server within only minor changes. A cloud environment also can be considered to host the processes and improve the performance of the execution. As a simple solution for moving EASTWeb into the cloud environment, each processing component could be treated as a web service and the application configured to allocate these web services. With these modifications, EASTWeb has the potential to be utilized as a shared resource within a large research or public health organization, or could be implemented as a web-based application in which data processing and storage are carried out using shared resources in the cloud.
Another important area for future work is more closely integrating the environmental monitoring data collected and processed by EASTWeb with other types of data and sensors, including streams of entomological and epidemiological surveillance data collected by public health agencies. Although environmental monitoring has the potential to identify critical risk factors before an epidemic actually begins, the accuracy of the resulting forecasts are constrained by the fact that other factors unrelated to the physical environment also influence the risk of mosquito borne disease outbreaks. For example, human mobility has a strong influence the movements of malaria parasites and other pathogens over long distances, and as a result can have a strong influence on patterns of epidemic spread (Wesolowski et al., 2012; Helbing et al., 2015). Other elements of the social environment such as the quality of housing, availability of health care, and malaria control interventions can also exert a strong influence on epidemic risk. An alternative to environmental modeling of future malaria risk is to use early detection methods, which typically involve comparing recent trends in malaria case surveillance data with historical baselines to detect anomalies that may indicate an emerging epidemic (Guintran et al., 2006). This method is often considered more reliable than forecasts based on environmental data since it is conditioned on actual observations of disease (DaSilva et al., 2004). However, predictions based on early epidemic detection offer less lead time and require sources of timely and accurate surveillance data.
One promising approach is to leverage both of these disease forecasting approaches by developing integrated forecasts that incorporate both environmental monitoring data and epidemiological or entomological surveillance data. To achieve this goal, we are currently incorporating the EASTWeb software into a larger Epidemic Prognosis Incorporating Disease and Environmental Monitoring for Integrated Assessment (EPIDEMIA) system (Wimberly et al., 2014a). This system combines EASTWeb with a number of other software tools for uploading and managing surveillance data, implementing models using data assimilation methods and providing public health end users with direct access to data and forecasts using a low-bandwidth web interface. We will test the effectiveness of the system through implementation across a network of sentinel locations in the Amhara region of Ethiopia. In the EPIDEMIA system, EASTWeb will have a critical role in transforming the vast storehouse of environmental “big data” into value added information products that will specifically targeted to public health end users and be made available via easy-to-use web interfaces.
7. Conclusions
The EASTWeb software has provided a core enabling technology that facilitates the automated capture and processing of multiple streams of remotely-sensed environmental monitoring data to support the development and implementation of early warning systems for mosquito-borne disease outbreaks. Key software development innovations that have allowed us to achieve our project objectives include the implementation of a software framework that supports the capture of multiple data sources, and the design of a scheduler that tracks the complex dependencies among multiple data processing tasks and makes the system resilient to variations in data availability. EASTWeb has been integrated with the R environment to carry out modeling and mapping and has been extensively tested through applications to support mosquito-borne disease forecasting for West Nile virus in the United States and epidemic malaria in the highlands of Ethiopia. Ongoing enhancements are underway to extend EASTWeb into a more general and customizable application that can link a wider variety of environmental data streams and support a broader array of public health applications. EASTWeb will also be implemented as a major component of the EPIDEMIA system for integrated disease risk forecasting.
Supplementary Material
Highlights.
The EASTWeb software supports early warning systems for mosquito-borne diseases.
EASTWeb automates acquisition and processing of remotely-sensed environmental data.
Data include temperature, precipitation, spectral indices, and evapotranspiration.
These variables are used to develop forecasting models to predict epidemics.
EASTWeb has been used to carry out forecasting of West Nile virus and malaria.
Acknowledgments
This work was supported by Grant Number R01AI079411 from the National Institute of Allergy and Infectious Diseases, grant NNX11AF67G from the NASA Applied Sciences Program, and cooperative agreement NNX14AI37A from the NASA Advancing Collaborative Connections for Earth System Science (ACCESS) program. We thank Ting-Wu Chuang, Paula Giacomo, and Alemayehu Midekisa for their efforts in testing and applying the EASTWeb application. We also acknowledge our public health partners at the South Dakota Department of Health, the Health Development and Anti-Malaria Association and the Amhara Regional Health Bureau for their contributions to the disease modeling and forecasting research conducted using EASTWeb.
Appendix A: Additional Screenshots of the EPIDEMIA Graphical User Interface
Figure A1.
User interface for querying the EASTWeb database.
Figure A2.
Example of SQL statement generated by the query interface.
Figure A3.
Example query output, which can be saved to a .csv file.
Footnotes
Software Availability
Software Name: EASTWeb 1.0
Software Requirements: Java JDK6 or above, PostgreSQL 9.3 or above
Programming Language: Java
Availability and Cost: Free, https://epidemia.sdstate.edu/eastweb/
Contact Person: Yi Liu, yi.liu@sdstate.edu
Publisher's Disclaimer: This is a PDF file of an unedited manuscript that has been accepted for publication. As a service to our customers we are providing this early version of the manuscript. The manuscript will undergo copyediting, typesetting, and review of the resulting proof before it is published in its final citable form. Please note that during the production process errors may be discovered which could affect the content, and all legal disclaimers that apply to the journal pertain.
References
- Abeku TA. Response to malaria epidemics in Africa. Emerg Infect Dis. 2007;13 (5):681–686. doi: 10.3201/eid1305.061333. [DOI] [PMC free article] [PubMed] [Google Scholar]
- Al-Hamdan MZ, Crosson WL, Economou SA, Estes MG, Estes SM, Hemmings SN, Kent ST, Puckett M, Quattrochi DA, Rickman DL. Environmental public health applications using remotely sensed data. Geocarto Int. 2014;29 (1):85–98. doi: 10.1080/10106049.2012.715209. [DOI] [PMC free article] [PubMed] [Google Scholar]
- Anyamba A, Chretien JP, Small J, Tucker CJ, Formenty PB, Richardson JH, Britch SC, Schnabelf DC, Erickson RL, Linthicum KJ. Prediction of a Rift Valley fever outbreak. Proc Natl Acad Sci USA. 2009;106 (3):955–959. doi: 10.1073/pnas.0806490106. [DOI] [PMC free article] [PubMed] [Google Scholar]
- Baeza A, Bouma MJ, Dhiman RC, Baskerville EB, Ceccato P, Yadav RS, Pascual M. Long-lasting transition toward sustainable elimination of desert malaria under irrigation development. Proc Natl Acad Sci USA. 2013;110 (37):15157–15162. doi: 10.1073/pnas.1305728110. [DOI] [PMC free article] [PubMed] [Google Scholar]
- Blumenthal MB, Bell M, del Corral J, Cousin R, Khomyakov I. IRI Data Library: enhancing accessibility of climate knowledge. Earth Perspectives. 2014;1 (1):1–12. [Google Scholar]
- Britton KH, Parker RA, Parnas DL. A procedure for designing abstract interfaces for device interface modules. Proceedings of the 5th International Conference on Software Engineering.1981. pp. 195–204. [Google Scholar]
- Brown HE, Diuk-Wasser MA, Guan Y, Caskey S, Fish D. Comparison of three satellite sensors at three spatial scales to predict larval mosquito presence in Connecticut wetlands. Remote Sens Environ. 2008;112 (5):2301–2308. [Google Scholar]
- Ceccato P, Ghebremeskel T, Jaiteh M, Graves PM, Levy M, Ghebreselassie S, Ogbamariam A, Barnston AG, Bell M, del Corral J, Connor SJ, Fesseha I, Brantly EP, Thomson MC. Malaria stratification, climate, and epidemic early warning in Eritrea. Am J Trop Med Hyg. 2007;77 (6):61–68. [PubMed] [Google Scholar]
- Ceccato P, Vancutsem C, Klaver R, Rowland J, Connor SJ. A vectorial capacity product to monitor changing malaria transmission potential in epidemic regions of Africa. J Trop Med. 2012;2012:595948. doi: 10.1155/2012/595948. [DOI] [PMC free article] [PubMed] [Google Scholar]
- Charron DF, editor. Ecohealth Research in Practice: innovative Applications of an Ecosystem Approach to Health. Springer; New York: 2012. [Google Scholar]
- Chuang TW, Hildreth MB, Vanroekel DL, Wimberly MC. Weather and land cover influences on mosquito populations in Sioux Falls, South Dakota. J Med Entomol. 2011;48 (3):669–679. doi: 10.1603/me10246. [DOI] [PMC free article] [PubMed] [Google Scholar]
- Chuang TW, Henebry GM, Kimball JS, Vanroekel-Patton DL, Hildreth MB, Wimberly MC. Satellite microwave remote sensing for environmental modeling of mosquito population dynamics. Remote Sens Environ. 2012a;125:147–156. doi: 10.1016/j.rse.2012.07.018. [DOI] [PMC free article] [PubMed] [Google Scholar]
- Chuang TW, Hockett CW, Kightlinger L, Wimberly MC. Landscape-level spatial patterns of West Nile virus risk in the northern Great Plains. Am J Trop Med Hyg. 2012b;86 (4):724–731. doi: 10.4269/ajtmh.2012.11-0515. [DOI] [PMC free article] [PubMed] [Google Scholar]
- Chuang TW, Wimberly MC. Remote Sensing of Climatic Anomalies and West Nile Virus Incidence in the Northern Great Plains of the United States. PLOS One. 2012;7:e46882. doi: 10.1371/journal.pone.0046882. [DOI] [PMC free article] [PubMed] [Google Scholar]
- Chung WM, Buseman CM, Joyner SN, Hughes SM, Fomby TB, Luby JP, Haley RW. The 2012 West Nile encephalitis epidemic in Dallas, Texas. J Amer Med Assoc. 2013;310 (3):297–307. doi: 10.1001/jama.2013.8267. [DOI] [PubMed] [Google Scholar]
- Coker R, Rushton J, Mounier-Jack S, Karimuribo E, Lutumba P, Kambarage D, Pfeiffer DU, Stärk K, Rweyemamu M. Towards a conceptual framework to support One-Health research for policy on emerging zoonoses. Lancet Infect Dis. 2011;11 (4):326–331. doi: 10.1016/S1473-3099(10)70312-1. [DOI] [PMC free article] [PubMed] [Google Scholar]
- DaSilva J, Garanganga B, Teveredzi V, Marx SM, Mason SJ, Connor SJ. Improving epidemic malaria planning, preparedness and response in Southern Africa. Malaria J. 2004;3:37. doi: 10.1186/1475-2875-3-37. [DOI] [PMC free article] [PubMed] [Google Scholar]
- Deelman E, Gannon D, Shields M, Taylor I. Workflows and e-Science: An overview of workflow system features and capabilities. Future Gener Comp Sy. 2009;25 (5):528–540. [Google Scholar]
- Elliott P, Wartenberg D. Spatial epidemiology: Current approaches and future challenges. Environ Health Persp. 2004;112 (9):998–1006. doi: 10.1289/ehp.6735. [DOI] [PMC free article] [PubMed] [Google Scholar]
- Estrada-Pena A. Increasing habitat suitability in the United States for the tick that transmits Lyme disease: A remote sensing approach. Environ Health Persp. 2002;110 (7):635–640. doi: 10.1289/ehp.110-1240908. [DOI] [PMC free article] [PubMed] [Google Scholar]
- Ford TE, Colwell RR, Rose JB, Morse SS, Rogers DJ, Yates TL. Using satellite images of environmental changes to predict infectious disease outbreaks. Emerg Infect Dis. 2009;15 (9):1341–1346. doi: 10.3201/eid/1509.081334. [DOI] [PMC free article] [PubMed] [Google Scholar]
- Garijo D, Alper P, Belhajjame K, Corcho O, Gil Y, Goble C. Common motifs in scientific workflows: An empirical analysis. Future Gener Comp Sy. 2014;36:338–351. [Google Scholar]
- Gaustad K, Shippert T, Ermold B, Beus S, Daily J, Borsholm A, Fox K. A scientific data processing framework for time series NetCDF data. Environ Modell Softw. 2014;60:241–249. [Google Scholar]
- Grover-Kopec E, Kawano M, Klaver RW, Blumenthal B, Ceccato P, Connor SJ. An online operational rainfall-monitoring resource for epidemic malaria early warning systems in Africa. Malar J. 2005;4:6. doi: 10.1186/1475-2875-4-6. [DOI] [PMC free article] [PubMed] [Google Scholar]
- Guintran J, Delacollette C, Trigg P. Systems for the early detection of malaria epidemics in Africa: An analysis of current practices and future priorities. World Health Organization; Geneva: 2006. WHO/HTM/MAL/2006.1115. [Google Scholar]
- Hartley DM, Barker CM, Le Menach A, Niu T, Gaff HD, Reisen WK. Effects of temperature on emergence and seasonality of West Nile virus in California. Am J Trop Med Hyg. 2012;86 (5):884–894. doi: 10.4269/ajtmh.2012.11-0342. [DOI] [PMC free article] [PubMed] [Google Scholar]
- Helbing D, Brockmann D, Chadefaux T, Donnay K, Blanke U, Woolley-Meza O, Moussaid M, Johansson A, Krause J, Schutte S, Perc M. Saving Human Lives: What Complexity Science and Information Systems can Contribute. J Stat Phys. 2015;158 (3):735–781. doi: 10.1007/s10955-014-1024-9. [DOI] [PMC free article] [PubMed] [Google Scholar]
- Hu J, Liu Y, Wimberly MC. FDEOD – A Software Framework for Downloading Earth Observation Data. Proceedings of the Association of Computing Machinery Southeast Conference; Kennesaw, GA. 2014. [Google Scholar]
- Johnson DP, Webber JJ, Urs Beerval Ravichandra K, Lulla V, Stanforth AC. Spatiotemporal variations in heat-related health risk in three Midwestern US cities between 1990 and 2010. Geocarto Int. 2014;29 (1):65–84. [Google Scholar]
- Kalluri S, Gilruth P, Rogers D, Szczur M. Surveillance of arthropod vector-borne infectious diseases using remote sensing techniques: a review. PLoS Pathogens. 2007;3 (10):e116. doi: 10.1371/journal.ppat.0030116. [DOI] [PMC free article] [PubMed] [Google Scholar]
- Kearns R, Moon G. From medical to health geography: novelty, place and theory after a decade of change. Prog Hum Geog. 2002;26 (5):605–625. [Google Scholar]
- Kwan JL, Park BK, Carpenter TE, Ngo V, Civen R, Reisen WK. Comparison of enzootic risk measures for predicting West Nile disease, Los Angeles, California, USA, 2004–2010. Emerg Infect Dis. 2012;18 (8):1298–1306. doi: 10.3201/eid1808.111558. [DOI] [PMC free article] [PubMed] [Google Scholar]
- Linard C, Alegana VA, Noor AM, Snow RW, Tatem AJ. A high resolution spatial population database of Somalia for disease risk mapping. Int J Health Geogr. 2010;9:45. doi: 10.1186/1476-072X-9-45. [DOI] [PMC free article] [PubMed] [Google Scholar]
- Littauer R, Ram K, Ludäscher B, Michener W, Koskela R. Trends in use of scientific workflows: insights from a public repository and recommendations for best practice. Int J Digit Curation. 2012;7 (2):92–100. [Google Scholar]
- Machault V, Vignolles C, Borchi F, Vounatsou P, Pages F, Briolant S, Lacaux JP, Rogier C. The use of remotely sensed environmental data in the study of malaria. Geospat Health. 2011;5 (2):151–168. doi: 10.4081/gh.2011.167. [DOI] [PubMed] [Google Scholar]
- Martin RV. Satellite remote sensing of surface air quality. Atmos Environ. 2008;42 (34):7823–7843. [Google Scholar]
- Midekisa A, Senay G, Henebry G, Semuniguse P, Wimberly M. Remote sensing-based time series models for malaria early warning in the highlands of Ethiopia. Malaria Journal. 2012;11 (1):165. doi: 10.1186/1475-2875-11-165. [DOI] [PMC free article] [PubMed] [Google Scholar]
- Nativi S, Mazzetti P, Santoro M, Papeschi F, Craglia M, Ochiai O. Big Data challenges in building the Global Earth Observation System of Systems. Environ Modell Softw. 2015;68 (0):1–26. [Google Scholar]
- R Development Core Team. R: A language and environment for statistical computing. R Foundation for Statistical Computing; Vienna, Austria: 2015. [Google Scholar]
- Rogers DJ, Randolph SE, Snow RW, Hay SI. Satellite imagery in the study and forecast of malaria. Nature. 2002;415 (6872):710–715. doi: 10.1038/415710a. [DOI] [PMC free article] [PubMed] [Google Scholar]
- Schmid HA. Framework design by systematic generalization. In: Fayad ME, Schmidt DC, Johnson RE, editors. Building application frameworks: Object-oriented foundations of framework design. Wiley; New York: 1999. pp. 353–378. [Google Scholar]
- Senay GB, Buddle M, Verdin JP, Melesse AM. A coupled remote sensing and simplified surface energy balance approach to estimate actual evapotranspiration from irrigated field. Sensors. 2007;7:979–1000. [Google Scholar]
- Soverow JE, Wellenius GA, Fisman DN, Mittleman MA. Infectious disease in a warming world: How weather influenced West Nile virus in the United States (2001–2005) Environ Health Persp. 2009;117 (7):1049–1052. doi: 10.1289/ehp.0800487. [DOI] [PMC free article] [PubMed] [Google Scholar]
- Stresman GH. Beyond temperature and precipitation Ecological risk factors that modify malaria transmission. Acta Tropica. 2010;116 (3):167–172. doi: 10.1016/j.actatropica.2010.08.005. [DOI] [PubMed] [Google Scholar]
- Teklehaimanot HD, Lipsitch M, Teklehaimanot A, Schwartz J. Weather-based prediction of Plasmodium falciparum malaria in epidemic-prone regions of Ethiopia I. Patterns of lagged weather effects reflect biological mechanisms. Malaria J. 2004;3:41. doi: 10.1186/1475-2875-3-41. [DOI] [PMC free article] [PubMed] [Google Scholar]
- Vitolo C, Elkhatib Y, Reusser D, Macleod CJA, Buytaert W. Web technologies for environmental Big Data. Environ Modell Softw. 2015;63 (0):185–198. [Google Scholar]
- Wesolowski A, Eagle N, Tatem AJ, Smith DL, Noor AM, Snow RW, Buckee CO. Quantifying the impact of human mobility on malaria. Science. 2012;338 (6104):267–270. doi: 10.1126/science.1223467. [DOI] [PMC free article] [PubMed] [Google Scholar]
- Wimberly MC, Chuang T-W, Henebry GM, Liu Y, Midekisa A, Semuniguse P, Senay G. A computer system for forecasting malaria epidemic risk using remotely-sensed environmental data. Proceedings: 6th International Congress on Environmental Modelling and Software. International Environmental Modelling and Software Society (iEMSs); Leipzig, Germany. 2012a. [Google Scholar]
- Wimberly MC, Giacomo P, Kightlinger L, Hildreth MB. Spatio-temporal epidemiology of human West Nile virus disease in South Dakota. Int J Environ Res Public Health. 2013;10 (11):5584–5602. doi: 10.3390/ijerph10115584. [DOI] [PMC free article] [PubMed] [Google Scholar]
- Wimberly MC, Henebry GM, Liu Y, Senay GB. EPIDEMIA - An EcoHealth Informatics System for Integrated Forecasting of Malaria Epidemics. Proceedings, 7th International Congress on Environmental Modelling and Software. International Environmental Modelling and Software Society (iEMSs); San Diego, CA, USA. 2014a. [Google Scholar]
- Wimberly MC, Hildreth MB, Boyte SP, Lindquist E, Kightlinger L. Ecological Niche of the 2003 West Nile Virus Epidemic in the Northern Great Plains of the United States. Plos One. 2008;3(12) doi: 10.1371/journal.pone.0003744. [DOI] [PMC free article] [PubMed] [Google Scholar]
- Wimberly MC, Lamsal A, Giacomo P, Chuang TW. Regional variation of climatic influences on West Nile virus outbreaks in the United States. Am J Trop Med Hyg. 2014b;91:677–684. doi: 10.4269/ajtmh.14-0239. [DOI] [PMC free article] [PubMed] [Google Scholar]
- Wimberly MC, Midekisa A, Semuniguse P, Teka H, Henebry GM, Chuang TW, Senay GB. Spatial synchrony of malaria outbreaks in a highland region of Ethiopia. Trop Med Intl Health. 2012b;17 (10):1192–1201. doi: 10.1111/j.1365-3156.2012.03058.x. [DOI] [PMC free article] [PubMed] [Google Scholar]
Associated Data
This section collects any data citations, data availability statements, or supplementary materials included in this article.


