Abstract
Many commercially available cell lines have been in culture for ages, acquiring phenotypes that differ from the original cancers from which these cell lines were derived. Therefore, research on new cell lines could improve the success rates of translational research in cancer. We have developed methods for the isolation and culture of human pancreatic ductal adenocarcinoma (PDAC) cells from murine xenografts of human PDAC. We hypothesize that phenotypes of PDAC cells are modified by in vitro culture conditions over time and by in vivo implantation. Patient-derived xenografts were created in immunodeficient mice using surgically resected tumor specimens. These murine xenografts were then used to establish human PDAC cell lines in culture. Earlier (<5) passage and later (>20) passage cell lines were evaluated separately regarding proliferation, cell cycle, genetic mutations, invasiveness, chemosensitivity, tumorigenesis, epithelial-mesenchymal transition (EMT) status, and proteomics. Later passage cells accelerated their doubling time and colony formation, and were more concentrated in the G0/G1 phase and less in the G2/M checkpoint phase. Later passage cells were more sensitive to gemcitabine and 5-fluorouracil than earlier passage cells, but all four new cell lines were more chemo-resistant compared to commercial ATCC cell lines. EMT induction was observed when establishing and passaging cell lines in vitro and furthermore by growing them as subcutaneous tumors in vivo. This study demonstrates a novel approach to the establishment of PDAC cell lines and observes a process by which newly established cell lines undergo phenotypic changes during in vitro culture and in vivo tumorigenesis. This may help explain differences of treatment effects often observed between experiments conducted in vitro, in vivo, and in human clinical trials.
Keywords: cell line, cell culture methods, epithelial-mesenchymal transition, pancreatic ductal adenocarcinoma
Introduction
Pancreatic ductal adenocarcinoma (PDAC) is one of the most lethal malignancies. The American Cancer Society has estimated that in 2012, PDAC was diagnosed in 43,392 Americans, and 37,390 deaths were attributed to PDAC. Since 2004, the incidence of pancreatic cancer has been increasing by 1.2% per year (1). Despite extensive research, the prognosis has not significantly improved and the disease is almost uniformly lethal, with an average 5-year survival rate of less than 5% (2). One setback to research progress has been the limited amount of viable patient tumor-derived tissue. Therefore, the majority of preclinical research in PDAC has been done in a limited number of commercially available cell lines. Publications from large studies have indicated that cell lines typically recapitulate the genomic events leading to neoplastic changes seen in patient samples. However, some genomic differences between tissues of origin and cell lines have been documented (3, 4). Most commercial cell lines have grown for years in artificial culture conditions, and these long culture times render the cells prone to phenotypic and genetic drift. This is possibly why the majority of preclinical research fails to translate into successful human studies. To counter this, research laboratories should establish their own primary cell lines to obtain a greater heterogeneity of cell lines and to avoid the use of cell lines cultured for extended periods of time. Although various techniques have been used to isolate and culture human PDAC cells, cultivating and preserving these cells remains a challenge (4-6).
In epithelial cell-derived cancers such as PDAC, numerous studies have shown that epithelial-mesenchymal transition (EMT) plays a central role in cancer progression and metastasis. However, there are little data regarding the status of this phenotypic change in cell line populations, specifically whether this phenotype differs between the original tumor tissue and the cell line that was derived from it. The initiation of metastasis requires cell invasion, which starts when tumor cells lose cell-cell adhesion mediated by E-cadherin downregulation. These cells break through the basement membrane with increased invasive properties, and then enter the bloodstream to form micrometastases. When these cells reach a distant site and implant, they undergo a reversal of this process, termed mesenchymal–epithelial transition (MET), and subsequently form clonal outgrowths at these metastatic sites. Thus, EMT and MET respectively comprise the initiation and completion of the invasion-metastasis cascade (5). These E- and N-cadherin proteins are calcium-dependent cell-cell adhesion glycoproteins composed of five extracellular cadherin repeats, a transmembrane region, and a highly conserved cytoplasmic tail (6). Cadherin transitions between epithelial and mesenchymal states play important roles in embryonic development and cancer metastasis. An E-cadherin level change is considered to be a fundamental event in EMT and MET. Changes also occur in the expression of other cytoskeletal proteins, such as cytokeratin 19 and vimentin (7, 8). Little is known about EMT-MET changes that occur when cell lines are transferred from in vivo to in vitro conditions, and vice-versa. Studies have suggested that repeated cycles of growing cancerous cell lines in nude mice cause these cell lines to become more aggressive (9-11). We hypothesize that this increase in aggressiveness is due to a transition from an epithelial to mesenchymal phenotype that occurs during cell line derivation and continues throughout cell culture.
In this study, we established four new PDAC cell lines from our patient-derived tumor xenograft (PATX) program (12)—MDA-PATC43, MDA-PATC50, MDA-PATC53, and MDA-PATC66. We analyzed these cell lines regarding proliferation, cell cycle, genetic mutations, chemosensitivity, invasiveness, tumorigenesis, EMT status, and proteomics. These data were obtained from cell lines separately in earlier (<5) and later (>20) cell passages in vitro. We identified the biologic discrepancies among PATX tumors and the PDAC cell lines derived from them. We also examined alterations in subcutaneous tumors created with these PDAC cells (termed sub-PATC) compared to the original PATX tumors and their derived cell lines.
Materials and Methods
PATX and cell culture procedure
Patient tumor specimens for PATX were obtained from primary pancreatic or metastatic liver tumor sites surgically. All patients were treated in the Department of Surgical Oncology at The University of Texas MD Anderson Cancer Center, and gave informed consent prior to surgery and tumor collection. The methods for developing and maintaining the PATX model have been previously reported (12). After the primary tumor was established in NOD/SCID mice, we harvested the tumor and divided it into separate portions for cell culture and for re-implantation into successive generations of NOD/SCID mice. For the cell culture portion, we first removed the surrounding connective tissue and then washed the specimen with sterile phosphate-buffered saline (PBS) containing 1% penicillin-streptomycin (Mediatech Inc., Herndon, VA). Then, using surgical scalpels, we finely minced the tumor tissue into cubes of approximately 1 mm3 in volume. No enzymatic degradation of the tumor tissues was performed in this procedure. The mechanical dissection method provided us an adequate number of cells for culture on dishes. The tissue was cultured in RPMI-1640 with 2.5 mM L-glutamine (HyClone Laboratories, Inc., Logan, UT) and 10% US source fetal bovine serum (FBS; Mediatech, Inc., Manassas, VA). All media were supplemented with 1% penicillin and streptomycin. The cells were maintained at 37°C in a humidified atmosphere of 5% CO2, and the medium was replaced every 3 days.
When cells outgrew from the tumor piece and formed well-isolated clones, we removed and discarded the growth medium, and washed dishes with PBS twice. These individual clones were isolated via a cloning cylinder (Bel-Art Products, Wayne, NJ). Selected clones were confirmed as human PDAC cells at the MD Anderson Molecular Cytogenetics core facility. New cell lines were further validated via short tandem repeat (STR) DNA fingerprinting using the AmpF/STR Identifier kit (Applied Biosystems cat 4322288) according to the manufacturer's instructions. The STR profiles were compared with known ATCC fingerprints (ATCC.org) and with the Cell Line Integrated Molecular Authentication database version 0.1.200808 (http://bioinformatics.istge.it/clima/) (Nucleic Acids Research 37:D925-D932 PMCID: PMC2686526). The results of the STR profile showed that our four new cell lines were unique. STR profiling did not detect any DNA other than human, and these cells showed an absence of mycoplasma through our core laboratory validation (MD Anderson Characterized Cell Line Core Facility). All experiments for this study were performed on cell lines in the fifth passage or later.
We also used the following commercial pancreatic cancer cell lines obtained from ATCC as controls: PANC-1 (ATCC, CRL-1469), MiaPaCa-2 (CRL-1420), and BxPC-3 (CRL-1687). All cell lines were grown in RPMI-1640 supplemented with 2 mM L-glutamine, 1 mM sodium pyruvate, 4.5 g/L glucose, and 10% FBS. All ATCC cell lines were cultured in a humidified atmosphere containing 5% CO2 at 37°C.
Genomic DNA and total RNA extraction
Genomic DNA was extracted from freshly cultured cells using a Qiagen blood and cell culture DNA mini kit according to the manufacturer's instructions. DNA samples were analyzed for STR DNA fingerprinting and KRAS mutation status by the Sequencing and Microarray Core Facility at MD Anderson.
Total RNA was extracted using TRIzol (Life Technologies) and then purified via an RNeasy mini kit (Qiagen) according to the manufacturer's instructions. First-strand cDNA was synthesized using 1 μg of total RNA with the SuperScript Mixture kit (Bio-Rad). The entire coding region of Smad4 and TP53 was amplified using PCR primers for every exon, as previously cited by Ding et al. and Liu. et al. (13, 14). Smad4 and TP53 mutations were analyzed via direct sequencing of the PCR products by the Sequencing and Microarray Core Facility at MD Anderson. Smad4 immunohistochemical staining was performed on patient tumor slides and PATX tissue microarray slides to confirm Smad4 mutation status.
Cell doubling times, colony formation assay, and cell cycle analysis
Cells proliferation was assessed via a standard MTT assay as previously described (15). A total of 1,000 cells per well were seeded into a 96-well plate in triplicate. On days 1, 3, 5, and 7, 20 μL of a 5 mg/mL solution of MTT (Sigma-Aldrich, St. Louis, MO) was added to the wells and incubated for 3 h at 37°C. The supernatant was removed, and the blue MTT formazan precipitates were then dissolved in 100 μL dimethyl sulfoxide per well. The plates were placed on a shaker for 10 min at room temperature in the dark, and absorbance was measured on a plate reader at 570 nm. Cell doubling times were generated via GraphPad Prism software (version 6.0 for Windows, GraphPad Software, Inc., La Jolla, CA, www.graphpad.com) according to their growth curves.
Colony formation assays were performed by seeding 60 mm dishes in triplicate with 200 single cells of each of the 4 new PDAC cell lines. The colonies per dish were counted after 10 days in culture. Results were shown as the mean value ± standard error using GraphPad Prism. The assay was repeated three times.
Cell cycle analysis was performed for earlier (<5) and later (>20) passages of each cell line. These cells were starved for 24 hours in FBS-free media before cell cycle analysis, and then the cells were resuspended in 0.25% trypsin, washed twice with PBS, and fixed in 70% ethanol. Cells were incubated in propidium iodide (Sigma-Aldrich) and triton X-100 staining solution with RNase A. As a control, these assays were also performed on the ATCC cell lines. Cell cycle profiles of these cells were analyzed by flow cytometry (BD Biosciences, San Jose, CA). Cell cycle status was then analyzed with FlowJo software (www.flowjo.com). Each experiment was repeated three times. Results were expressed as the percentage of cells in each phase.
Cytotoxicity study
The viability of each of these cell lines was evaluated during earlier (<5) and later (>20) passages using MTT assays. Cells were seeded in 96-well plates at a density of 3 × 10³ cells/well in triplicate and allowed to attach overnight. The cells were then starved for 24 hours with FBS-free medium prior to treatment. Cells were then treated with gemcitabine (0.1 μM) and 5-fluorouracil (5-FU; 500 μM) in RPMI 1640 with 10% FBS. After 72 hours, 20 μL of 5 mg/mL MTT was added to each well, and the cells were incubated for 3h at 37°C. The supernatants were discarded, 100 μL dimethyl sulfoxide was added to each well, and the plates were incubated for 10 minutes at room temperature. The number of viable cells was determined by measuring the absorbance at 570 nm of insoluble formazan using a plate reader. This cytotoxicity study on early/late passage cell lines was also performed in Panc-1, BxPc3, and Miapaca2 cell lines as a control. All cells were incubated at 37°C in a humid atmosphere with 5% CO2. Each experiment was repeated three times. Absorbance data were shown as the mean value ± standard error of the three independent experiments by GraphPad Prism.
Western blotting
Sample lysates from these new cell lines, PATX tumors, and cell line subcutaneous tumors (Sub-PATCs) were lysed in RIPA buffer (50 mM Tris HCl [pH 8], 150 mM NaCl, 1 % NP-40, 0.5 % sodium deoxycholate, and 0.1 % sodium dodecyl sulfate [SDS]) supplemented with a protease inhibitor cocktail (Sigma-Aldrich, St. Louis, MO). Proteins were electrophoresed in sample buffer on 8%–12% acrylamide gels and were then transferred to a polyvinylidene fluoride membrane (GE Healthcare, Piscataway, NJ). To block nonspecific binding, the membrane was incubated for 1 or 2 hours at room temperature in 0.5% TBST containing 5% non-fat milk. The membranes were then probed with primary antibodies overnight at 4°C on a rocker. The antibodies used were Smad4 (1:1000) and β-Catenin (1:1000) (Cell Signaling Technology, Inc., Boston, MA), E-cadherin (1:5000), N-cadherin (1:2000), CK19 (1:1000), vimentin (1:1000), caveolin1 (1:1000), NF2 (1:8000), FoxM1 (1:500), and cyclin B1 (1:8000) (Abcam, Cambridge, MA). TFRC (1:10,000) were purchase from Sigma (Sigma-Aldrich, St. Louis, MO). β-actin 1:5000, Sigma) was used as protein loading control. The membranes were then probed with horseradish peroxidase-linked secondary anti-mouse or anti-rabbit antibodies (1:5000; Sigma-Aldrich, St. Louis, MO) for 1 hour at room temperature. After washing with TBST, the specified proteins were visualized using the ECL Western Blotting Detection System (GE Healthcare).
Reverse Phase Protein Microarray
The reverse phase protein microarray (RPPA) is a recently developed quantitative assay that analyzes nanoliter amounts of sample for potentially hundreds of proteins. RPPA is a high-throughput antibody-based technique developed for functional proteomics studies to evaluate protein activities in cell lines and patient tumor samples (16). This antibody-based assay determines levels of protein expression, protein modifications, and multiple signaling molecules and their functional status. The RPPA study has major strengths in identifying and validating cellular targets, characterizing signaling pathways and networks, and determining on- and off-target activities of novel drugs (16, 17).
RPPA analysis was performed in the Department of Systems Biology (Functional Proteomics Core Facility) at MD Anderson. To prepare lysates for RPPA analysis, PATX tumors, corresponding new cell lines, and sub-PATC tumors were lysed in lysis buffer (1% Triton X-100, 50 mM HEPES [pH 7.4], 150 mM NaCl, 1.5 mM MgCl2, 1 mM EGTA, 100 mM NaF, 10 mM Na pyrophosphate, 1 mM Na3VO4, 10% glycerol, containing freshly added protease and phosphatase inhibitors (Roche Applied Science, Indianapolis, IN)). Sample proteins were denatured by 1% (w/v) SDS in the presence of β-mercaptoethanol and adjusted to a final concentration of 1 mg/ml. Samples were diluted in five serial 2-fold dilutions in dilution buffer (lysis buffer containing 1% SDS) and arrayed on nitrocellulose-coated slides (Grace Biolab) using an Aushon 2470 arrayer (Aushon BioSystems). Each slide was probed with a validated primary antibody plus a biotin-conjugated secondary antibody. The signal obtained was amplified using a DakoCytomation–catalyzed system (Dako) and visualized via DAB colorimetric reaction. The slides were scanned, analyzed, and quantified using customized software, Microvigene (VigeneTech Inc.), to generate spot intensity. Each dilution curve was fitted with a logistic model (“Supercurve Fitting” developed by the Department of Bioinformatics and Computational Biology at MD Anderson Cancer Center; http://bioinformatics.mdanderson.org/OOMPA) that fits a single curve using all the samples (e.g., dilution series) on a slide with the signal intensity as the response variable and the dilution steps as independent variables. The fitted curve was plotted with the signal intensities—both observed and fitted—on the y-axis and the log2-concentration of proteins on the x-axis for diagnostic purposes. The protein concentrations of each set of slides were then normalized by median polish, which was corrected across samples by the linear expression values using the median expression levels of all antibody experiments to calculate a loading correction factor for each sample. The results for each antibody were then centered according to the mean, to facilitate visualization. A list of antibodies, including their sources and catalog numbers, may be found at: http://www.mdanderson.org/education-and-research/resources-forprofessionals/scientific-resources/core-facilities-and-services/functional-proteomics-rppa-core/antibodylists---protocols/corestdablist-5-3-13.pdf. Unsupervised hierarchical clustering was performed using GENE-E (broadinstitute.org). The heatmap included was generated in Cluster 3.0 (http://www.eisenlab.org/eisen/) as a hierarchical cluster using Pearson Correlation and a center metric. The resulting heatmap was visualized in Treeview (http://www.eisenlab.org/eisen/).
In vitro invasive capacity and in vivo tumor growth studies
In vitro invasive capacity was measured using a BD modified Boyden invasion chamber assay as previously described (18). These four cell lines were seeded in serum-free medium (RPMI) in the top compartment of matrigel-coated chambers (5 × 10⁴ cells/chamber, 8.0-μm pores, BD Biosciences, Bedford, MA). RPMI+10% FBS medium was placed in the bottom compartment as a chemoattractant. Cells were allowed to invade across the coated inserts for 20 hours. The cells on the apical surface of the insert were scraped off, and membranes containing invaded cells were fixed in 100% methanol, stained with 1% crystal violet (Sigma-Aldrich), and mounted on microscope slides. Invading cells were counted at 10 × magnification in three different fields per membrane. Experiments were duplicated under each condition and repeated independently three times.
To evaluate the tumorgenicity of our four cell lines in vivo, we injected cells (5 × 10⁵) from later passages of each cell line subcutaneously into the right flanks of 3 athymic nude mice per cell line. Cells were resuspended separately in sterile 50% growth factor-reduced matrigel (BD Biosciences, Bedford, MA) in PBS. The mice were monitored daily. Tumors were measured externally with calipers twice a week, and tumor volume was calculated using the following equation: volume ½ D × d2, where D is the long side and d is the short side of the tumor. All groups of mice were euthanized at the 50th day, and their tumors were excised and weighed. Tumor tissues were processed for routine histologic and immunohistochemical analysis. The tumor volume grown curve and tumor weight comparison at day 50 were plotted by GraphPad Prism, respectively.
Animal studies were performed in accordance with the animal protocol procedures approved by the MD Anderson Cancer Center Institutional Review Board and Institutional Animal Care and Use Committee and were conducted in accordance with institutional and national regulations (protocol # 01-11-00131).
Immunohistochemical staining
Tissues from patients' primary tumors, PATX-tumors, and subcutaneous cell line xenograft tumors were embedded in paraffin and then cut into 4 μm thick sections for immunohistochemical analysis at the clinical core laboratory at MD Anderson. All sections were evaluated and scored by pathologists blinded to both clinical and pathologic data. Table 2 shows the details of the antibodies used. Immunohistochemical staining for E-cadherin, N-cadherin, vimentin, CK19, β-catenin, and Smad4 was done using a Lab-Vision 480-2D immunostainer (ThermoFisher, Fremont, CA). All reactions were visualized with diaminobenzidine as a chromogen. Positive and negative controls were included in each run for all the antibodies used. Isotype controls for all antibodies were negative. Two pathologists reviewed the IHC staining separately and scored each antibody expression by its percentage of area. The percentage scores were plotted by bar graph by Microsoft Excel. All images were captured via an Olympus DP72 camera attached to an Olympus BX51 microscope and processed via cellSens software.
Table 2. List of proteins in newly established cell lines expressed over two-fold compared to the xenograft tumors from which they were derived.
| Ratio | Proteins expressed over twofold | % of total |
|---|---|---|
| MDA-PATC43/PATX43 | Caveolin1; Cyclin B1; FoxM1; Myosin-IIa-pS1943; N-Cadherin; NF2; PEA15-pS116; PKC-alpha-pS657; RBM15; TFRC; VEGFR2; XRCC1; YAP | 9.6 |
| MDA-PATC50/PATX50 | Caveolin1; Cyclin-B1; eEF2; NF2; p53; TFRC; TTF1 | 5.9 |
| MDA-PATC53/PATX53 | Caveolin1; FoxM1; NFkB.p65-pS536; p70S6K-pT389; Rb-pS807; Src-pY527; TFRC | 5.1 |
| MDA-PATC66/PATX66 | ACC1; Caveolin1; Chk2; Cyclin B1; FoxM1; NF2; Notch1; p53; p70S6K; Src; TFRC | 9.6 |
Statistical analysis
Statistical analyses were performed using GraphPad Prism 6.0. The two-tailed t test was used for comparisons between earlier and later passages of the four new PDAC cell lines. A p-value of <0.05 was considered statistically significant.
Results
Establishment, characterization, and validation of early passage human PDAC cell lines
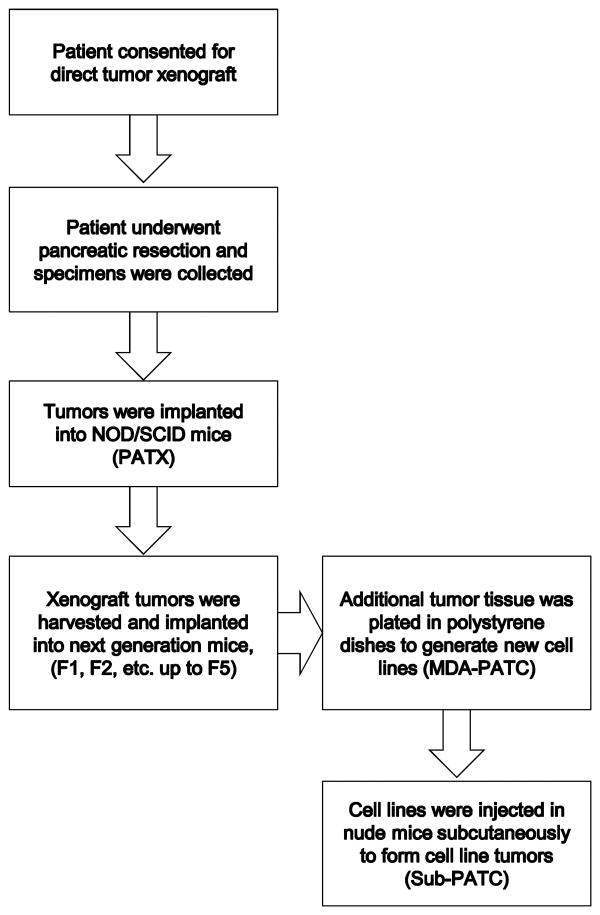
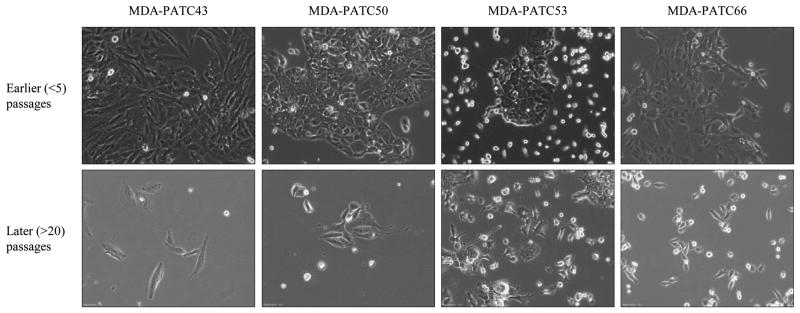
Four PDAC cell lines (MDA-PATC43, MDA-PATC50, MDA-PATC53, and MDA-PATC66) were established from murine xenograft tumors of four pancreatic cancer patients. As detailed in the methods section, the cell lines were verified by our core facility to be human and unique. Figure 1 summarizes the graphic approaches in detail. Figure 2 contains representative photos of the morphology of the final established cell lines between earlier and later passages. These PDAC cells—especially MDA-PATC53—grew as separated clumpy colonies in dishes in their early passages and as adherent monolayers with characteristic epithelial morphological features after 20 passages.
Figure 1. Summary of the methodological approach used for generating PDAC cell lines.
Figure 2.
Morphology of new PDAC lines growing in culture. Top panel represents cells in earlier passages (<5 passages), bottom panel shows cells grow pattern in later passages (>20 passages). Magnification 10×.
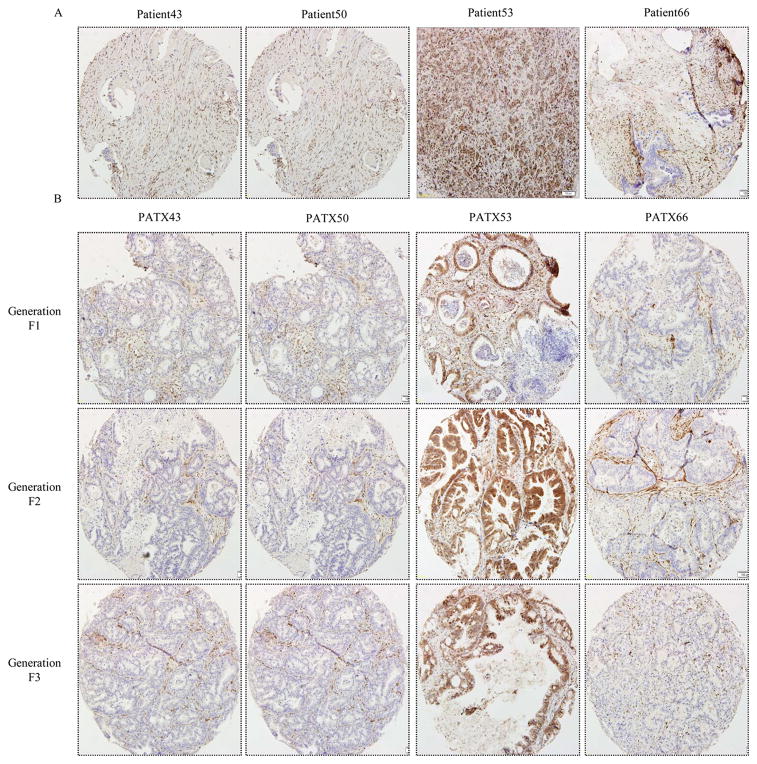
The statuses of K-ras, SMAD4, and TP53, all genes that are commonly mutated or deleted in PDAC, were evaluated via DNA or PCR exon product sequencing (Table 1). Analysis of the derived cell lines determined that SMAD4 was deleted in all cell lines except for MDA-PATC53. This was confirmed with immunohistochemical staining of SMAD4 in patients' primary tumors and corresponding PATX F1, F2, and F3 generation tumors on a tissue microarray slide (Figure 3). SMAD4 staining was strongly present in the ductal cells of Patient 53's tumor, as well as in the ductal cells in subsequent murine xenografts. SMAD4 was not present in the ductal cells of the other primary tumors or their corresponding xenografts, with the only positive staining occurring in tumor stroma.
Table 1. Summary of the Clinicopathological Features of Patients and Gene Statuses of Derived Cell Lines1.
| Cell lines | Sex | Age | Stage (TNM) | Tumor Site | K-ras | SMAD43 | TP53 |
|---|---|---|---|---|---|---|---|
| MDA-PATC43 | F | 71 | 3.0.0 | Pancreas | Cod 12: GGT;CGT | Delete | WT |
| MDA-PATC50 | F | 60 | 3.1.0 | Pancreas | Cod 12: GGT;CGT | Delete | C(945,1061)>T |
| MDA-PATC532 | M | 65 | X.X.1 | Liver | Cod 12: GGT;GAT | WT4 | WT4 |
| MDA-PATC66 | F | 63 | 3.1.0 | Pancreas | Cod 12: GGT; GAT | Delete | T(909,591)>A |
All of these patients had no pre-operative treatment, and tumor tissue was confirmed pancreatic adenocarcinoma.
Tumor from liver metastasis site.
Expression of SMAD4 protein was also demonstrated by immunohistochemistry in both patient specimens and murine xenograft tissue (Figure 3.).
Wild Type.
Figure 3.
Immunohistochemical staining for SMAD4 was performed in (A) primary patient tumor tissue and (B) corresponding PATX tumors from generations F1, F2, and F3 in NOD/SCID mice. These were all stained concurrently in one tissue microarray slide. Staining was evaluated on ductal tumor cells. Patient 43, 50, and 66 had a deletion of SMAD4 which is supported by negative staining of tumor cells in the original tumor and all three generations of murine xenografts. Patient 53 was wild type for SMAD4, represented by positive staining of ductal cells in the original tumor and all three generations of murine xenografts. See Table 1 for corresponding sequencing results. Magnification 10×.
Doubling time, colony formation, and cytotoxicity assays
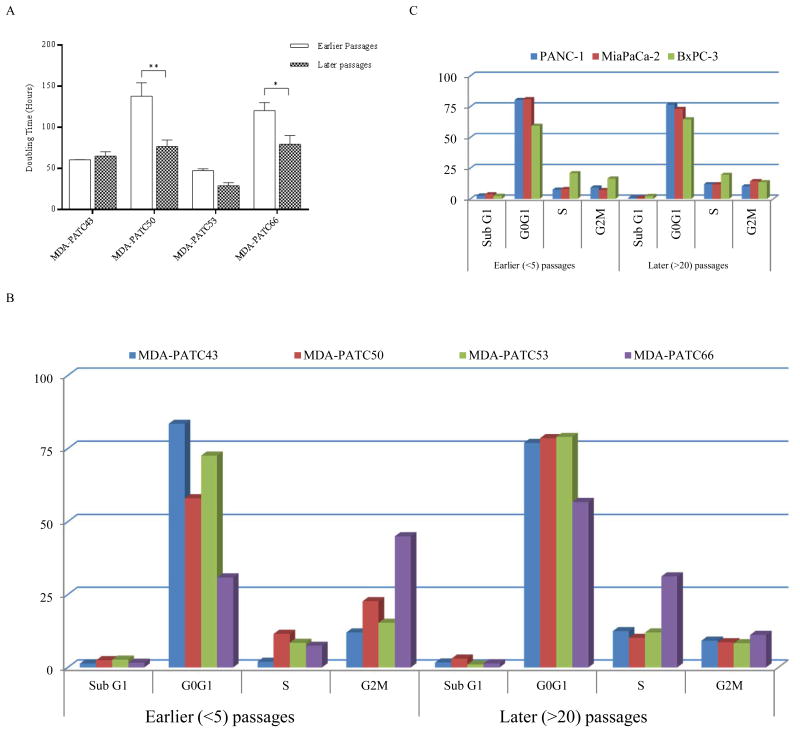
Proliferation of these cell lines was assessed using MTT assays and their doubling times were calculated with GraphPad Prism. The doubling times of MDA-PATC43 and MDA-PATC53 did not significantly change between earlier and later passages. In the MDA-PATC50 and MDA-PATC66 cell lines, the doubling times were significantly reduced in later passages (Figure 4A, p<0.01 and p<0.05, respectively). Cell cycle analysis confirmed this observation. In the MDA-PATC50 and MDA-PATC66 cell lines, the proportion of cells in the G0G1 phases increased between earlier and later passages, and the proportion of cells in the G2M checkpoint phase decreased between the earlier and later passages (Figure 4B). Cell cycle analysis of ATCC cell lines showed no significant variations in cycle phases between earlier and later passages (Figure 4C).
Figure 4.
Comparison of MDA-PATC43, 50, 53, and 66 cell line proliferation between earlier and later passages. (A) Doubling time changes between earlier (<5) and later (>20) passages were assessed with serial MTT assays. Results are shown as Means ± S.D. and significance assessed via two-tailed t test (*P<0.05 and **P<0.01). (B) Flow cytometric analysis of cell cycle phase distribution comparing earlier and later passages in these four cell lines. (C) Flow cytometric cell cycle analysis of ATCC PDAC cell lines as a control. Cell cycle data collection and analysis was carried out by using CellQuest software. Assays were done thrice and in triplicate wells. The figure is a representative of three experiments with similar results.
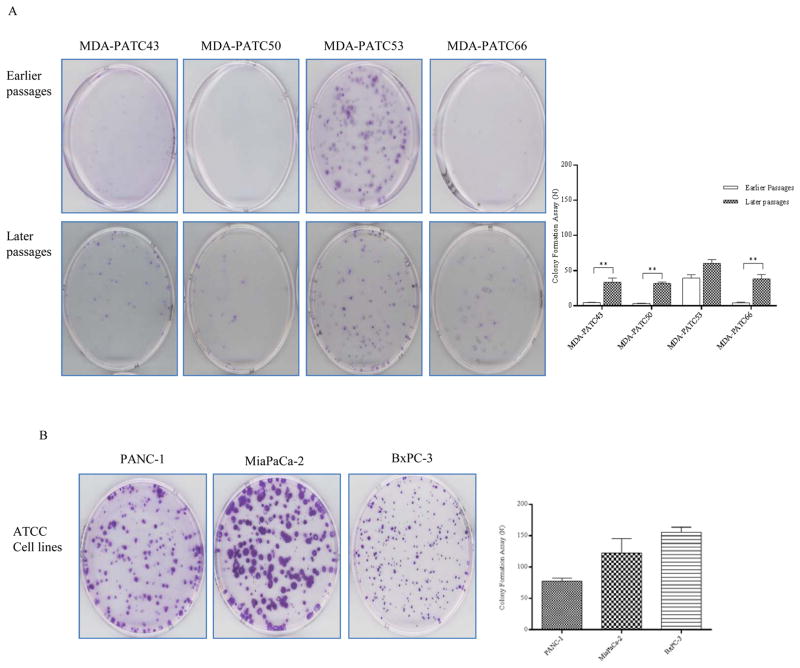
Colony formation was also assessed in these four new cell lines. In the cell lines MDA-PATC43, MDA-PATC50, and MDA-PATC66, colony formation ability was significantly increased after 20 passages. Both colony size and number were significantly augmented (p<0.01). Interestingly, the MDA-PATC53 cell line did not change its powerful colony forming ability between earlier and later passages, and it grew more colonies than the other three cell lines from the start (Figure 5A&C). In ATCC cell lines, the size and number of colonies did not change significantly between subsequent passages in dishes (Figure 5 B&D).
Figure 5.
Colony formation assay of MDA-PATC43, 50, 53, and 66 and control ATCC cell lines. (A) Colony formation ability of new cell lines during earlier and later passages. (B) Colony formation ability of commercial ATCC PDAC cell lines: PANC1, MiaPaCa-2, and BxPC-3. Cells were fixed and stained by crystal violet. Assays were done thrice and in triplicate wells. The figure is a representative of three experiments with similar results. Quantification was performed by manual counting.
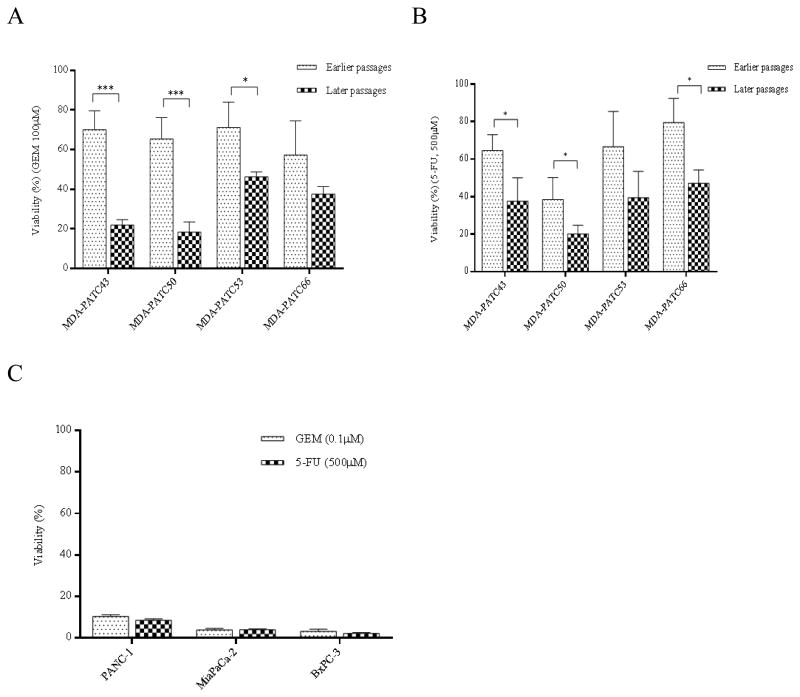
Cytotoxicity assays on the four cell lines at earlier and later passages revealed that they were more sensitive to chemotherapy during later passages. The cells were treated with 100 μM gemcitabine and 500 μM 5-fluorouracil. The results demonstrated MDA-PATC43, MDA-PATC50, MDA-PATC53, and MDA-PATC66 cells were more sensitive to gemcitabine in later passages (p<0.001, p<0.001, p<0.05, and NS, respectively, Figure 6A). Sensitivity to 5-FU also was augmented in later passages of MDA-PATC43, MDA-PATC50, and MDA-PATC66 cells significantly (p<0.05) as well as in MDA-PATC53 (NS, Figure 6B). As a control, cytotoxicity assays with gemcitabine and 5-FU were also performed in PANC-1, MiaPaCa-2, and BxPC-3 cells, and sensitivity to these drugs was not altered by multiple passages in dishes (Figure 6C).
Figure 6.
In vitro cytotoxicity of gemcitabine and 5-FU in newly isolated cell lines. (A) Gemcitabine and (B) 5-fluorouracil was incubated with MDA-PATC43, MDA-PATC50, MDA-PATC53, and MDA-PATC66 cells during earlier and later passages. (C) Commercial PANC-1, MiaPaCa-2, and BxPC-3 cell lines were treated with the same doses of gemcitabine and 5-FU as a control. These cells were treated for 3 days in culture, and their viability was determined with MTT assays. Assays were done thrice and in triplicate wells. Bar graphs are shown as means ± S.D. and statistical analysis was performed by two-tailed t test (*P<0.05 and ***P<0.001).
In Vitro Invasiveness and In vivo Tumorigencity
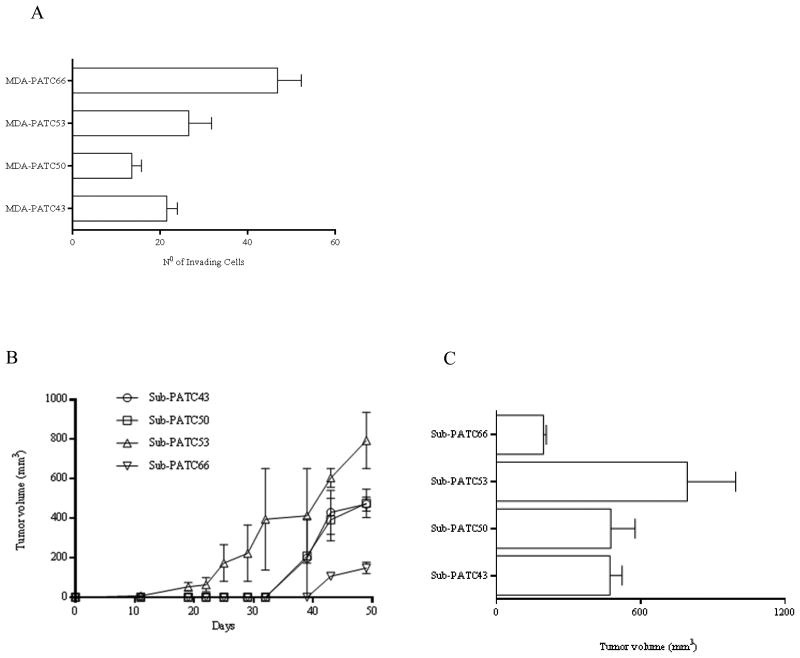
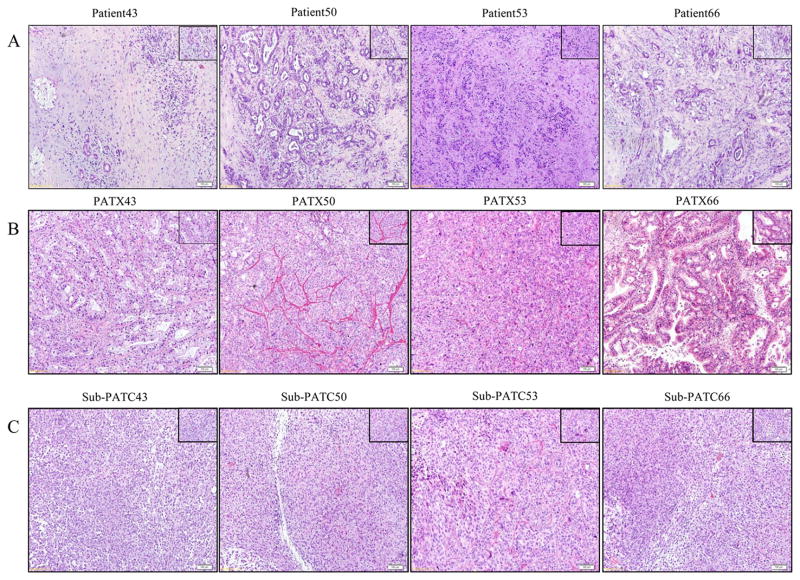
The invasiveness of these cell lines was tested using a boyden chamber assay and the tumorigenicity of all four new PDAC cell lines was assessed by injecting cell suspensions subcutaneously in athymic nude mice. In vitro, all cell lines had invasive capability, and MDA-PATC66 had the highest of the four (Figure 7A). In vivo, all four cell lines grew palpable tumors in two or three weeks. Interestingly, Sub-PATC53 tumors were the fastest to grow and had the largest volumes. Despite having the greatest invasiveness in vitro, MDA-PATC66 tumors were the slowest to grow and had the smallest volumes (Figure 7B and C). Histology of patient tumors with corresponding PATX tumors and Sub-PATC tumors are shown in Figure 8. The histology of PATX tumors tends to more closely resemble that of the original patient tumors, with abundant stroma and duct-like structures. The Sub-PATC tumors, like other cell line-derived tumors, rarely have stromal or ductal architecture resembling that of an original patient tumor, and are usually anaplastic.
Figure 7.
Invasiveness and tumorigenic nature and of new PDAC lines. (A) Cell lines' invasive capacity was determined by a standard BD BioCoat™ Matrigel™ invasion assay. Invading cells of each cell line were counted in 3 different fields at 10× magnification after 22 hours of incubation. (B) All four MDA-PATC cell lines have the ability to form a progressively growing tumor after subcutaneous injection in athymic nude mice. Tumor sizes were monitored and recorded twice a week. Three mice were in each group. (C) Tumor volumes at 50 days growth. Bar graphs are shown Means ± S.D.
Figure 8.
Representative H&E sections of (A) patient tumor, (B) patient xenograft tumor (PATX), and (C) subcutaneous cell line tumor (Sub-PATC). PATX tumors tended to preserve some ductal architecture found in patient tumors, while Sub-PATC tumors tended to be anaplastic. Magnification, 10×.
RPPA on PATX tumors, PDAC cell lines, and Sub-PATC tumors
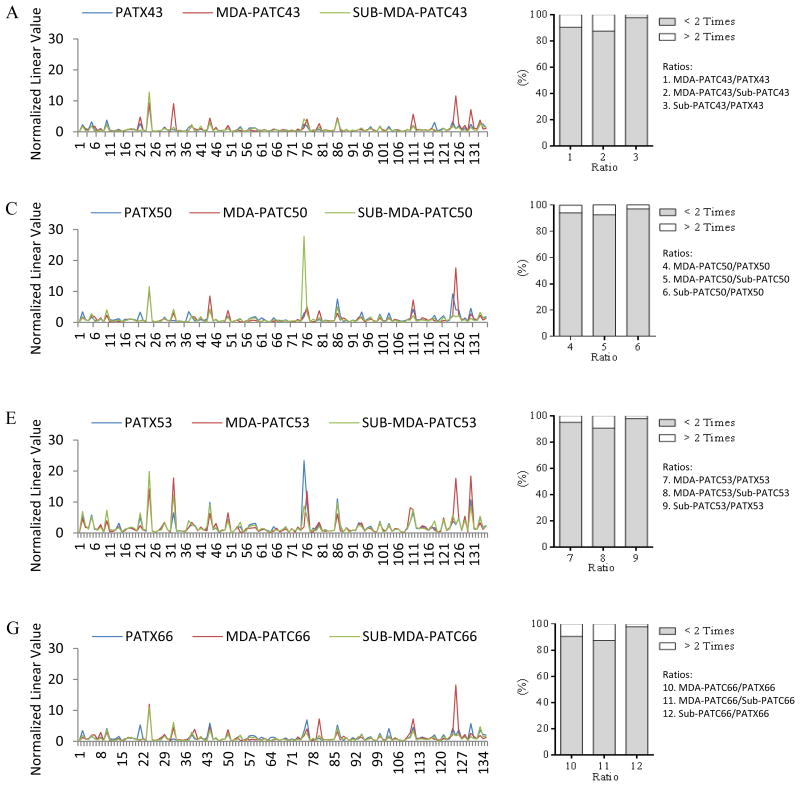
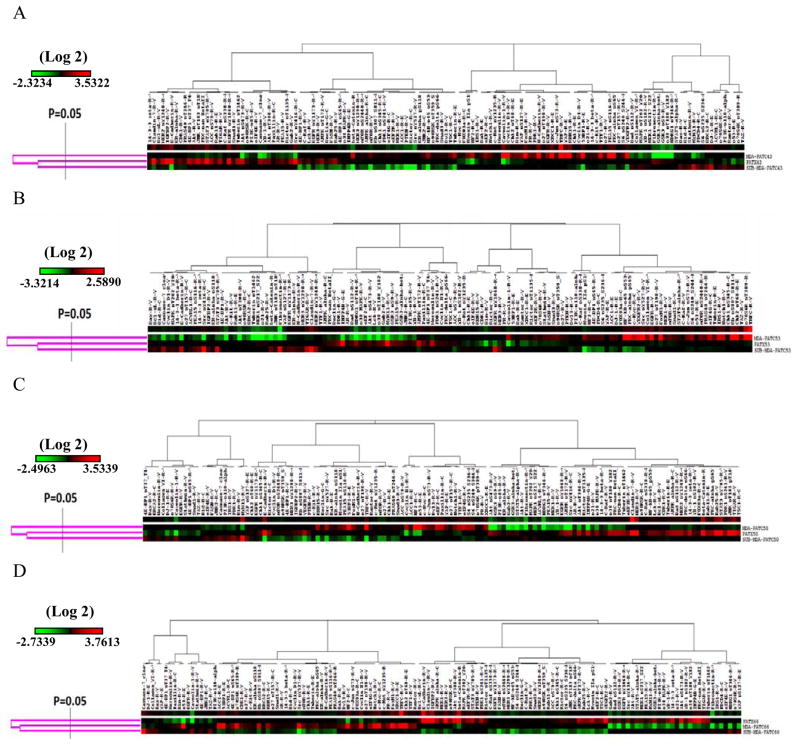
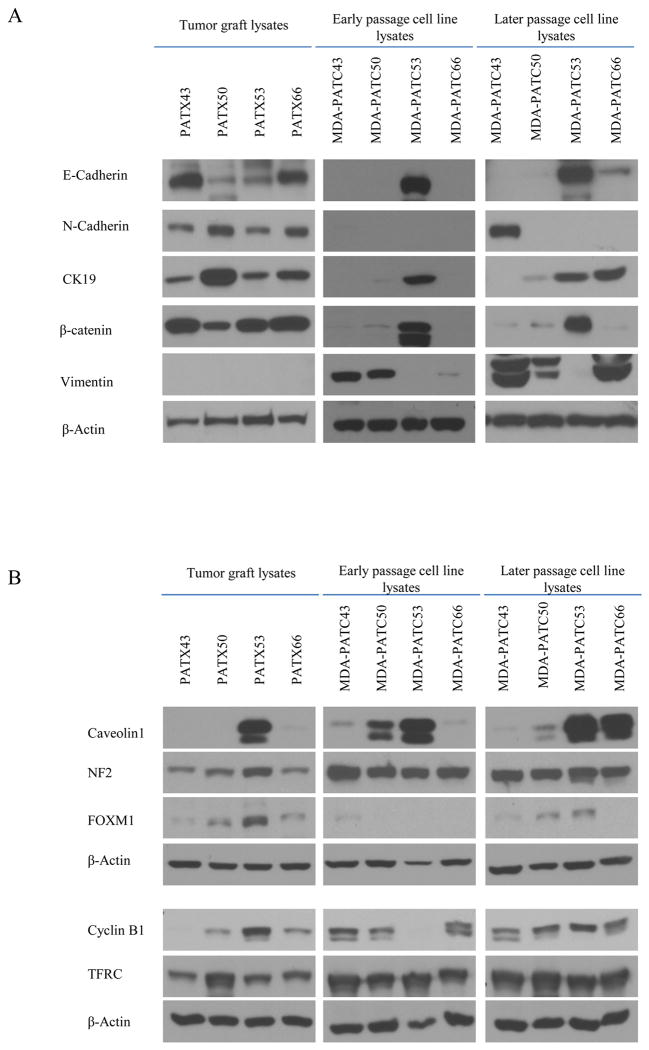
RPPA was performed with a panel of 135 protein antibodies to evaluate differences in protein expression among on PATX tumors, matched PDAC cell lines, and Sub-PATC tumors. The results of each set were normalized for protein loading and transformed to linear values as normalized linear graphs via Microsoft Excel (Figure 9A, C, E, and G). It was evident that the pattern of protein expression among PATX tumors, PATC cell lines, and Sub-PATC tumors was generally conserved. To quantify which proteins had the most significant alterations in expression, we calculated the ratios of protein expression among all three groups and identified the proteins that had a greater than 2-fold change. Figure 9 (B, D, F, H) represents the proportions of proteins that were more or less than twofold in differential expression. Heatmaps of our RPPA data were generated in order to visualize patterns of protein expression among our three groups (Figure 10). These data demonstrate that differences of protein expression levels among MDA-PATC cell lines, PATX tumors, and Sub-PATC tumors was less than two-fold in over 87% of the proteins on the RPPA panel. In Table 2, we listed which proteins in newly established cell lines were expressed over twofold compared to the respective xenografts from which they were derived. The cell lines overexpressed a number of proteins in common, including Caveolin-1, NF2, FoxM1, Cyclin-B1, and the Transferrin receptor (TFRC). The relative expression of these proteins was secondarily evaluated with western blot analysis (Figure 11B). In MDA-PATC43 and 50, Caveolin-1 slightly decreased with passage number. In MDA-PATC66, Caveolin-1 expression continued to increase with passages. MDA-PATC53, which was derived from a liver metastasis of a primary PDAC, retained high Caveolin-1 expression in its xenograft and all throughout in vitro passages. NF2 expression was increased in all cell lines compared to their respective xenografts. FoxM1 decreased in early passage cell lines but then was re-expressed in later cell lines, with the exception of MDA-PATC66. Cyclin-B1 was lost in early passage MDA-PATC53, but was re-expressed in later passages, while the three other cell lines continued to increase expression compared to PATX tumors. TFRC expression was increased in all cell lines compared to PATX tumors.
Figure 9.
Proteomic concordance of patient xenograft tumors (PATX), cell lines (MDA-PATC), and cell line xenografts (Sub-PATC). (A, C, E, G) Lysates of PATX tumors, cell lines, and Sub-PATC tumors analyzed via reverse phase protein array showed close similarities in expression of most proteins. (B, D, F, H) Proportions of proteins expressed over or fewer than two-fold per ratio. See Table 2 for ratio labels.
Figure 10.
Unsupervised clustering heatmaps of protein expression levels in PATX tumors, MDA-PATC cell lines, and Sub-PATC tumors. These reverse phase protein array results were generated in Cluster 3.0 as a hierarchical cluster using Pearson Correlation and a center metric. The resulting heatmap was visualized in Treeview.
Figure 11.
Western blot comparison of PATX tumors with early and later passage cell lines. (A) Relative protein expression levels of the epithelial and mesenchymal markers E-cadherin, N-cadherin, Vimentin, Cytokeratin-19, and β-catenin. β-Actin was used as a loading control. MDA-PATC43 showed increased expression of N-cadherin and Vimentin. MDA-PATC50 showed increased expression of CK19 and Vimentin. MDA-PATC53 maintained high expression of E-cadherin, CK19, and β-catenin. MDA-PATC 66 showed increased expression of E-cadherin, CK19, and Vimentin. (B) The relative protein expression levels of Caveolin-1, NF2, FoxM1, Cyclin B1, and Transferrin Receptor (TFRC). These were proteins found to be upregulated at least twofold on cell lines compared to the PATX tumors they were derived from, based on RPPA data (see Table 2). Caveolin-1, NF2, and TFRC were generally increased in cell lines compared to PATX tumors. FoxM1 decreased in early passage cell lines but then was re-expressed in later cell lines. Cyclin B1 was lost in early passage MDA-PATC53, but was re-expressed in later passages, while the three other cell lines continued to increase expression compared to PATX tumors.
EMT marker variation between in vitro and in vivo tumor cell growth
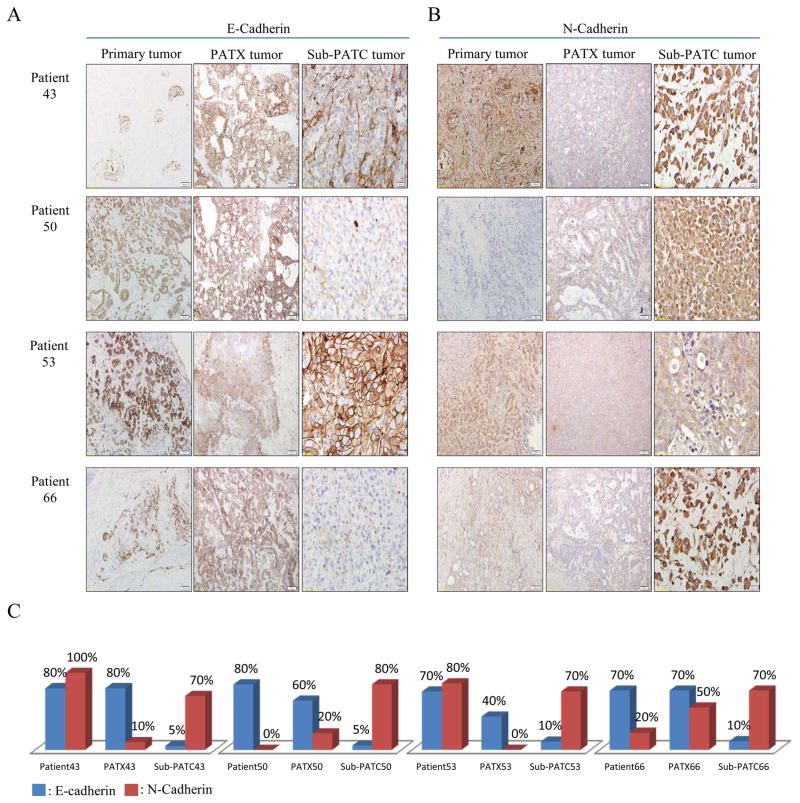
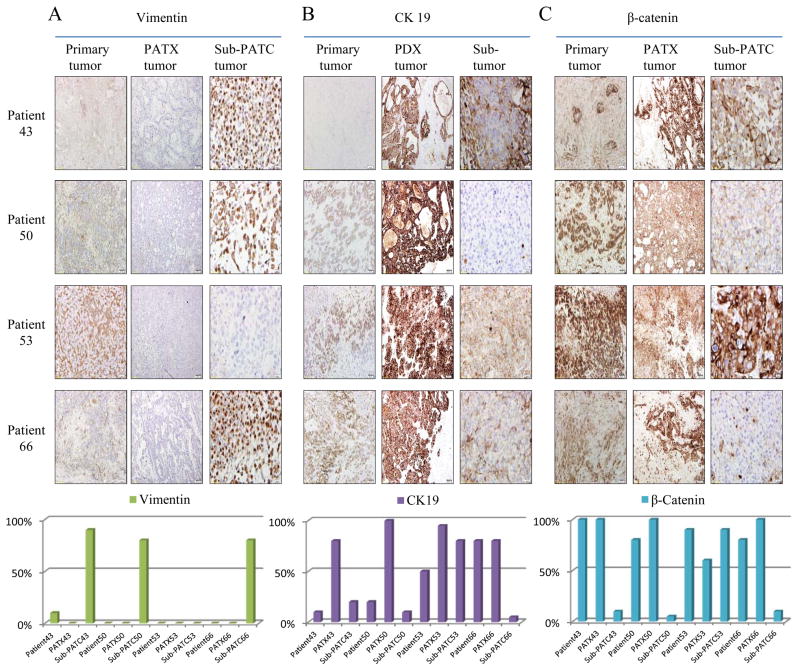
EMT related markers were compared in cell lysates of MDA-PATC during earlier (<5) passages and later (>20) passages via Western blot analysis. N-cadherin expression was increased in later passages of MDA-PATC43. CK19 expression was increased in later passages of MDA-PATC50 and MDA-PATC66. Vimentin expression was substantially escalated in later passages of MDA-PATC43, MDA-PATC50, and MDA-PATC66 (Figure 11A). These Western blot results suggest that MDA-PATC43, MDA-PATC50, and MDA-PATC66 were transformed to the mesenchymal phenotype during cultivation in dishes. Interestingly, MDA-PATC53 sustained its epithelial phenotype throughout earlier and later passages. It consistently maintained high expression of E-cadherin and β-catenin. IHC staining of E-cadherin, N-cadherin, vimentin, CK19, and β-catenin was performed in primary patient tissues with matched PATX and sub-PATC tissues (Figures 12 and 13). Slides were scored based on positive staining of the tumor cells only, not the stromal cells. IHC staining scores showed that the level of E-cadherin expression between primary and PATX tumors was retained on PATX43 and PATX66 xenografts, and decreased in PATX50 and PATX53 (80% to 60%, 70% to 40%, respectively). Staining scores of E-cadherin were decreased dramatically to 10% and 5% on all sub-PATC tumors, suggesting loss of the epithelial cell phenotype when the cell lines were grown in vivo (Figure 12A and C). Staining scores of N-cadherin expression between primary and PATX tumors demonstrated a different pattern. N-cadherin staining decreased from the patient tumor to the PATX tumor in PATX43 and PATX53, while N-cadherin staining increased in PATX50 and PATX66. However, in all four groups, N-cadherin increased substantially in the Sub-PATC tumors, which suggested a transition to the mesenchymal phenotype during in vivo tumorigenesis (Figure 12B and C). Vimentin staining, while weak on patient tumors and PATX tumors, was intense on Sub-PATC43, 50, and 66. However, it remained negligible on all Patient53 samples (Figure 13A). CK19 staining was augmented on PATX43, PATX50, and PATX53 compared to primary tumors, and reduced on sub-PATC43, 50, and 66. It is worth noting that CK19 staining remained relatively high throughout all Patient53 samples (Figure 13B). High β-catenin staining intensity was preserved from all patient tumors to PATX tumors, and was subsequently diminished in Sub-PATC43, 50, and 66, yet remained high in Sub-PATC53 (Figure 13C). These results verified our findings that MDA-PATC43, 50, and 66 cell lines were transformed from epithelial to mesenchymal states during their processing both in vitro and in vivo, and curiously MDA-PATC53, which was derived from a liver metastasis site of primary PDAC, preserved its strongly epithelial phenotype in the process of cultivation and tumorigenicity.
Figure 12.
Immunohistochemical evaluation of EMT related markers in primary patient tumors, PATX tumors, and Sub-PATC tumors. (A) E-cadherin and (B) N-cadherin expression on tumor cells was evaluated. (C) Percentages of positive tumor cells per slide were quantified by pathologists. E-cadherin persisted in patient and PATX tumors, but was weak in Sub-PATC tumors. N-cadherin was variably expressed in patient and PATX tumors, but significantly increased in Sub-PATC tumors. Magnification, 10×.
Figure 13.
Further immunohistochemical evaluation of EMT related markers in primary patient tumors, PATX tumors, and Sub-PATC tumors. Expression of (A) Vimentin, (B) Cytokeratin-19, and (C) β-catenin was evaluated. The lowest panel displays percentages of positive tumor cells per slide as determined by pathologists. For Patients 43, 50, and 66, vimentin was negligible in patient and PATX tumors, but became strongly expressed in Sub-PATC tumors. CK19 was highly expressed in PATX tumors, but substantially decreased in Sub-PATC tumors. β-catenin staining was also intense in PATX tumors, and significantly weaker in Sub-PATC tumors. For Patient 53, all three tumor types showed little Vimentin and strong expression of CK19 and β-catenin. Magnification 10×.
Discussion
We report the establishment and characterization of four new PDAC cell lines: MDA-PATC43, MDA-PATC50, MDA-PATC53, and MDA-PATC66, which were derived from patient tumor murine xenografts. Early passage and well-characterized human PDAC cell lines are important resources for studying cancer cell biology, as well as for developing new strategies against cancer cell growth and new drug therapy validation in vivo and in vitro (19). The first report on successful cultivation of a human PDAC was in 1963 (20), and since then, numerous PDAC cell lines have been reported and characterized (21), but little is known about how these cell lines change over time in culture. Most of the previously established PDAC cell lines used in research were derived from primary pancreatic tumors, tumor metastases, or ascitic effusions, whereas all of our new cell lines were derived from murine patient tumor xenografts. We have found this approach to be beneficial due to the relatively larger amounts of tumor tissue from which to culture cells, as primary patient tumor specimens are usually more limited in volume. Also, murine xenografts are potentially endlessly expandable, so it is possible to isolate new cell lines long after the original tumor resection has taken place. The four PDAC cell lines we established have demonstrated efficient tumorigenicity when injected subcutaneously into nude mice, with a success rate of 100% (data not shown). Therefore, this approach can be used to produce durable cell lines that are able to be experimented with both in vitro and in vivo. This model enables concurrent study of patient tumor xenografts and their derived cell lines, which creates a robust platform to compare the biology of cancer cells living confined in mouse stromal tissues to cancer cells living as pure populations.
In this study, we have also shown that PDAC cells from a primary pancreatic tumor site take on a predominately mesenchymal phenotype when isolated from murine xenograft tumors, and this mesenchymal phenotype is further augmented when these cell lines are grown as subcutaneous tumors in immunocompromised mice. On the other hand, one cell line, MDA-PATC53, isolated from a liver metastasis of a pancreatic primary adenocarcinoma, maintained a predominately epithelial phenotype. Also, MDA-PATC53 maintained a wild-type SMAD4 gene from the initial surgical resection, to xenograft establishment, and finally to cell line isolation. This suggests that epithelial or mesenchymal phenotypic changes in culture may depend on the tissue of origin and whether the cells came from a primary tumor versus a metastasis. Future studies will be required to further delineate the changes in cancer cell biology that occur upon establishment of cell lines from patient or xenograft tissues, and how their tumor environments of origin affect these changes. This information can potentially be used to help reconcile experimental findings in vitro and in vivo, in order to overcome limitations often seen when therapies are translated from the petri dish to animal models and finally to human patients.
Acknowledgments
This work was funded by Viragh Family Foundation and Various Donors in Pancreatic Cancer Research, and was supported by Cancer Center Support Grant (CCSG) core resources of Flow Cytometry and Cellular Imaging Facility, Functional Proteomics Reverse Phase Protein Array (RPPA) Core, and Research Animal Support Facility – Houston under NIH/NCI award (P30CA016672). STR DNA fingerprinting was done by the Cancer Center Support Grant-funded Characterized Cell Line core is funded by NCI #CA016672.
Footnotes
Conflict of interest: The authors declare no conflict of interest
References
- 1.Howlader N, Noone AM, Krapcho M, Garshell J, Neyman N, Altekruse SF, Kosary CL, Yu M, Ruhl J, Tatalovich Z, Cho H, Mariotto A, Lewis DR, Chen HS, Feuer EJ, Cronin KA, editors. SEER Cancer Statistics Review, 1975-2010. National Cancer Institute; Bethesda, MD: Apr, 2013. http://seer.cancer.gov/csr/1975_2010/, based on November 2012 SEER data submission, posted to the SEER web site. [Google Scholar]
- 2.Jemal A, Siegel R, Ward E, Hao Y, Xu J, Murray T, et al. Cancer statistics, 2008. CA: a cancer journal for clinicians. 2008;58(2):71–96. doi: 10.3322/CA.2007.0010. Epub 2008/02/22. [DOI] [PubMed] [Google Scholar]
- 3.Douglas EJ, Fiegler H, Rowan A, Halford S, Bicknell DC, Bodmer W, et al. Array comparative genomic hybridization analysis of colorectal cancer cell lines and primary carcinomas. Cancer research. 2004;64(14):4817–25. doi: 10.1158/0008-5472.CAN-04-0328. Epub 2004/07/17. [DOI] [PubMed] [Google Scholar]
- 4.Larramendy ML, Lushnikova T, Bjorkqvist AM, Wistuba, II, Virmani AK, Shivapurkar N, et al. Comparative genomic hybridization reveals complex genetic changes in primary breast cancer tumors and their cell lines. Cancer genetics and cytogenetics. 2000;119(2):132–8. doi: 10.1016/s0165-4608(99)00226-5. Epub 2000/06/27. [DOI] [PubMed] [Google Scholar]
- 5.Chaffer CL, Weinberg RA. A perspective on cancer cell metastasis. Science. 2011;331(6024):1559–64. doi: 10.1126/science.1203543. Epub 2011/03/26. [DOI] [PubMed] [Google Scholar]
- 6.Huntsman DG, Caldas C. Assignment1 of the E-cadherin gene (CDH1) to chromosome 16q22.1 by radiation hybrid mapping. Cytogenetics and cell genetics. 1998;83(1-2):82–3. doi: 10.1159/000015134. Epub 1999/02/02. [DOI] [PubMed] [Google Scholar]
- 7.Besco JA, Hooft van Huijsduijnen R, Frostholm A, Rotter A. Intracellular substrates of brain-enriched receptor protein tyrosine phosphatase rho (RPTPrho/PTPRT) Brain research. 2006;1116(1):50–7. doi: 10.1016/j.brainres.2006.07.122. Epub 2006/09/16. [DOI] [PubMed] [Google Scholar]
- 8.Thiery JP, Acloque H, Huang RY, Nieto MA. Epithelial-mesenchymal transitions in development and disease. Cell. 2009;139(5):871–90. doi: 10.1016/j.cell.2009.11.007. Epub 2009/12/01. [DOI] [PubMed] [Google Scholar]
- 9.Yachida S, Zhong Y, Patrascu R, Davis MB, Morsberger LA, Griffin CA, et al. Establishment and characterization of a new cell line, A99, from a primary small cell carcinoma of the pancreas. Pancreas. 2011;40(6):905–10. doi: 10.1097/MPA.0b013e3182207a58. Epub 2011/07/20. [DOI] [PMC free article] [PubMed] [Google Scholar]
- 10.Hotz HG, Hines OJ, Foitzik T, Reber HA. Animal models of exocrine pancreatic cancer. International journal of colorectal disease. 2000;15(3):136–43. doi: 10.1007/s003840000229. Epub 2000/08/23. [DOI] [PubMed] [Google Scholar]
- 11.Metildi CA, Kaushal S, Hoffman RM, Bouvet M. In vivo serial selection of human pancreatic cancer cells in orthotopic mouse models produces high metastatic variants irrespective of Kras status. J Surg Res. 2013;184(1):290–8. doi: 10.1016/j.jss.2013.03.049. Epub 2013/04/18. [DOI] [PMC free article] [PubMed] [Google Scholar]
- 12.Kim MP, Evans DB, Wang H, Abbruzzese JL, Fleming JB, Gallick GE. Generation of orthotopic and heterotopic human pancreatic cancer xenografts in immunodeficient mice. Nature protocols. 2009;4(11):1670–80. doi: 10.1038/nprot.2009.171. Epub 2009/10/31. [DOI] [PMC free article] [PubMed] [Google Scholar]
- 13.Ding Z, Wu CJ, Chu GC, Xiao Y, Ho D, Zhang J, et al. SMAD4-dependent barrier constrains prostate cancer growth and metastatic progression. Nature. 2011;470(7333):269–73. doi: 10.1038/nature09677. Epub 2011/02/04. [DOI] [PMC free article] [PubMed] [Google Scholar]
- 14.Liu Y, Bodmer WF. Analysis of P53 mutations and their expression in 56 colorectal cancer cell lines. Proceedings of the National Academy of Sciences of the United States of America. 2006;103(4):976–81. doi: 10.1073/pnas.0510146103. Epub 2006/01/19. [DOI] [PMC free article] [PubMed] [Google Scholar]
- 15.Chang Z, Li Z, Wang X, Kang Y, Yuan Y, Niu J, et al. Deciphering the mechanisms of tumorigenesis in human pancreatic ductal epithelial cells. Clinical cancer research : an official journal of the American Association for Cancer Research. 2013;19(3):549–59. doi: 10.1158/1078-0432.CCR-12-0032. Epub 2013/01/24. [DOI] [PMC free article] [PubMed] [Google Scholar]
- 16.Sheehan KM, Calvert VS, Kay EW, Lu Y, Fishman D, Espina V, et al. Use of reverse phase protein microarrays and reference standard development for molecular network analysis of metastatic ovarian carcinoma. Molecular & cellular proteomics : MCP. 2005;4(4):346–55. doi: 10.1074/mcp.T500003-MCP200. Epub 2005/01/27. [DOI] [PubMed] [Google Scholar]
- 17.Paweletz CP, Charboneau L, Bichsel VE, Simone NL, Chen T, Gillespie JW, et al. Reverse phase protein microarrays which capture disease progression show activation of pro-survival pathways at the cancer invasion front. Oncogene. 2001;20(16):1981–9. doi: 10.1038/sj.onc.1204265. Epub 2001/05/22. [DOI] [PubMed] [Google Scholar]
- 18.Li Z, Chang Z, Chiao LJ, Kang Y, Xia Q, Zhu C, et al. TrkBT1 induces liver metastasis of pancreatic cancer cells by sequestering Rho GDP dissociation inhibitor and promoting RhoA activation. Cancer research. 2009;69(19):7851–9. doi: 10.1158/0008-5472.CAN-08-4002. Epub 2009/09/24. [DOI] [PMC free article] [PubMed] [Google Scholar]
- 19.Philip PA, Mooney M, Jaffe D, Eckhardt G, Moore M, Meropol N, et al. Consensus report of the national cancer institute clinical trials planning meeting on pancreas cancer treatment. Journal of clinical oncology : official journal of the American Society of Clinical Oncology. 2009;27(33):5660–9. doi: 10.1200/JCO.2009.21.9022. Epub 2009/10/28. [DOI] [PMC free article] [PubMed] [Google Scholar]
- 20.Dobrynin YV. Establishment and Characteristics of Cell Strains from Some Epithelial Tumors of Human Origin. Journal of the National Cancer Institute. 1963;31:1173–95. Epub 1963/11/01. [PubMed] [Google Scholar]
- 21.Deer EL, Gonzalez-Hernandez J, Coursen JD, Shea JE, Ngatia J, Scaife CL, et al. Phenotype and genotype of pancreatic cancer cell lines. Pancreas. 2010;39(4):425–35. doi: 10.1097/MPA.0b013e3181c15963. Epub 2010/04/27. [DOI] [PMC free article] [PubMed] [Google Scholar]


