

Abstract
Relapse is the leading cause of mortality in children with acute lymphoblastic leukemia (ALL). Among chemotherapeutics, thiopurines are key drugs in the backbone of ALL combination therapy. Using whole-exome sequencing, we identified relapse-specific mutations in phosphoribosyl pyrophosphate synthetase 1 (PRPS1), a rate-limiting purine biosynthesis enzyme, in 24/358 (6.7%) relapse B-ALL cases. All individuals who harbored PRPS1 mutations relapsed early on-treatment, and mutated ALL clones expanded exponentially prior to clinical relapse. Our functional analyses of PRPS1 mutants uncovered a new chemotherapy resistance mechanism involving reduced feedback inhibition of de novo purine biosynthesis and competitive inhibition of thiopurine activation. Notably, the de novo purine synthesis inhibitor lometrexol can effectively abrogate PRPS1 mutant-driven drug resistance. Overall these results highlight the importance of constitutive activation of de novo purine pathway in thiopurine resistance, and offer therapeutic strategies for the treatment of relapsed and resistant ALL.
Introduction
Relapsed acute lymphoblastic leukemia (ALL) remains a leading cause of mortality among all childhood malignancies, in spite of risk-stratified combination therapy and improved supportive care1. The thiopurines 6-mercaptopurine (6-MP) and 6-thioguanine (6-TG) are key drugs in the backbone of ALL combination chemotherapy2; both of them are prodrugs converted by the purine salvage pathway to cytotoxic thioguanine nucleotides, so alterations in purine homeostasis could impact the therapeutic efficacy3–5.
To investigate how genetic lesions contribute to the relapse in childhood ALL, we performed whole-exome sequencing of 16 matched triad diagnosis-remission-relapse samples followed by targeted sequencing in two independent large B-ALL validation cohorts and identified recurrent relapse-specific mutations in phosphoribosyl pyrophosphate synthetase 1 (PRPS1), which encodes the first rate-limiting and allosteric enzyme in purine biosynthesis pathway. In normal cells, PRPS activity is kept low by end-product feedback inhibition of PRPS1 and low expression of feedback-insensitive PRPS26. By integrating clinical data with functional findings, we elucidated a novel drug resistance mechanism in which deregulated feedback modulation of purine biosynthesis reduces thiopurine prodrug activation and impairs therapeutic efficacy. These results also provide a rationale for therapeutic strategies to overcome thiopurine resistance in the clinic.
Results
Identification of relapse-specific mutations
We performed whole-exome sequencing of triad samples obtained at diagnosis, remission and relapse from 16 individuals at Shanghai Children’s Medical Center (SCMC) (Supplementary Table 1). We excluded one set of T-ALL sample (ALL-060) with excessive mutations (540 non-silent variants in 526 genes) due to concern of unrepresentative hypermutation caused by DNA repair defects. The remaining 15 triad samples contained 373 non-silent variants in 356 genes, of which 27 single nucleotide variants (SNVs) and 4 indels were identified as diagnosis-specific, 199 SNVs and 18 indels were relapse-specific, and 116 SNVs and 9 indels were shared between diagnosis and relapse samples (Supplementary Fig. 1, Supplementary Table 2, 3). C/G>T/A changes were most frequent (52.5%, Supplementary Fig. 2), as reported in recent ALL studies7,8. Our genomic analysis identified 164 somatic copy number alterations (CNAs), including 125 deletions, 39 amplifications (Supplementary Table 4, 5), of which 46 CNAs were identified as diagnosis-specific, 26 were relapse-specific and 92 were shared (Supplementary Fig. 2 and Supplementary Table 6). Notably, 9p21.3 was the most frequent CNA, with 10 deletions of CDKN2A/CDKN2B, consistent with previous reports9.
We observed somatic mutations known to be associated with ALL, including those in NRAS, KRAS, JAK1, PAX5, IKZF1, ARID1A, NOTCH1 and FBXW7 in both diagnostic and relapse samples. In the 15 triad samples, two genes, PRPS1 and C1orf173, showed multiple relapse-specific mutations (Supplementary Fig. 3). Further sequencing in an independent Chinese cohort of 144 relapsed ALL cases and a German cohort of 220 relapsed B-ALL cases identified relapse-specific mutations in 24 individuals at 14 sites in PRPS1 (Table 1 and Supplementary Table 7). All individuals in the Chinese cohort were enrolled in XH-ALL-99 (n=56) or SCMC-ALL-2005 (n=88) protocols10,11. More than 95% of the 220 German individuals had received frontline treatment according to German ALL-BFM (n=154) or COALL protocols (n=56) and all individuals had received relapse treatment according to ALL-REZ BFM 2002 protocol12–14. In combining data from the discovery and validation cohorts, we observed 17 distinct PRPS1 mutations affecting 14 evolutionarily conserved amino acid residues (Fig. 1a). Among them, A190V was an activating mutation previously described in inherited gout15. The most common PRPS1 mutation was A190T at the same codon, present in 10 of the 24 individuals at relapse. Because no PRPS1 mutation was found in the Chinese T-ALL subcohort (n=22), we focused PRPS1 study on B-ALL unless specified. So far, we found no relapse-specific NT5C2 mutation7,8 in the Chinese B-ALL cohort (n=45), while 7 individuals in the German cohort (n=115; 7/115, 6.1%) had NT5C2 mutations that were mutually exclusive with PRPS1 mutations (Table 2)16.
Table 1.
Summary of relapse-specific PRPS1 mutations in Chinese (n=18) and German (n=6) B-ALL cohorts
| Annotated gene | Sample ID | Immunophenotype | Mutation type | Position | Allele change | Amino acid change | Case number with mutation | Frequency (%) |
|---|---|---|---|---|---|---|---|---|
| Chinese | ALL-122 | B | Nonsyn. | ChrX: 106,882,560 | T>C | V53A | 1 | 13.0 (18/138) |
| ALL-102 | B | Nonsyn. | ChrX: 106,882,616 | A>G | I72V | 1 | ||
| ALL-157 | B | Nonsyn. | ChrX: 106,882,632 | G>C | C77S | 1 | ||
| ALL-058 | B | Nonsyn. | ChrX: 106,884,133 | G>C | S103T | 1 | ||
| ALL-088 | B | Nonsyn. | ChrX: 106,884,133 | G>A | S103N | 2 | ||
| ALL-151 | B | Nonsyn. | ChrX: 106,884,133 | G>A | S103N | |||
| ALL-128 | B | Nonsyn. | ChrX: 106,885,606 | A>G | D139G | 1 | ||
| ALL-076 | B | Nonsyn. | ChrX: 106,885,621 | A>G | N144S | 1 | ||
| ALL-005 | B | Nonsyn. | ChrX: 106,885,718 | G>C | K176N | 1 | ||
| ALL-005 | B | Nonsyn. | ChrX: 106,888,425 | C>G | D183E | 1 | ||
| ALL-011 | B | Nonsyn. | ChrX: 106,888,444 | G>A | A190T | 8 | ||
| ALL-121 | B | Nonsyn. | ChrX: 106,888,444 | G>A | A190T | |||
| ALL-122 | B | Nonsyn. | ChrX: 106,888,444 | G>A | A190T | |||
| ALL-145 | B | Nonsyn. | ChrX: 106,888,444 | G>A | A190T | |||
| ALL-146 | B | Nonsyn. | ChrX: 106,888,444 | G>A | A190T | |||
| ALL-128 | B | Nonsyn. | ChrX: 106,888,444 | G>A | A190T | |||
| ALL-137 | B | Nonsyn. | ChrX: 106,888,444 | G>A | A190T | |||
| ALL-143 | B | Nonsyn. | ChrX: 106,888,444 | G>A | A190T | |||
| ALL-148 | B | Nonsyn. | ChrX: 106,888,449 | G>C | L191F | 1 | ||
| ALL-141 | B | Nonsyn. | ChrX: 106,893,213 | C>G | T303S | 1 | ||
| ALL-026 | B | Nonsyn. | ChrX: 106,893,237 | A>G | Y311C | 1 | ||
|
| ||||||||
| German | ALL-374 | B | Nonsyn. | ChrX: 106,884,133 | G>T | S103I | 1 | 2.7 (6/220) |
| ALL-386 | B | Nonsyn. | chrX:106,884,165 | A>G | N114D | 1 | ||
| ALL-335 | B | Nonsyn. | ChrX: 106,885,621 | A>G | N144S | 2 | ||
| ALL-381 | B | Nonsyn. | ChrX: 106,885,621 | A>G | N144S | |||
| ALL-335 | B | Nonsyn. | chrX:106,885,711 | G>A | G174E | 1 | ||
| ALL-248 | B | Nonsyn. | ChrX: 106,888,445 | C>T | A190V | 1 | ||
| ALL-253 | B | Nonsyn. | ChrX: 106,888,444 | G>A | A190T | 2 | ||
| ALL-374 | B | Nonsyn. | ChrX: 106,888,444 | G>A | A190T | |||
Figure 1.
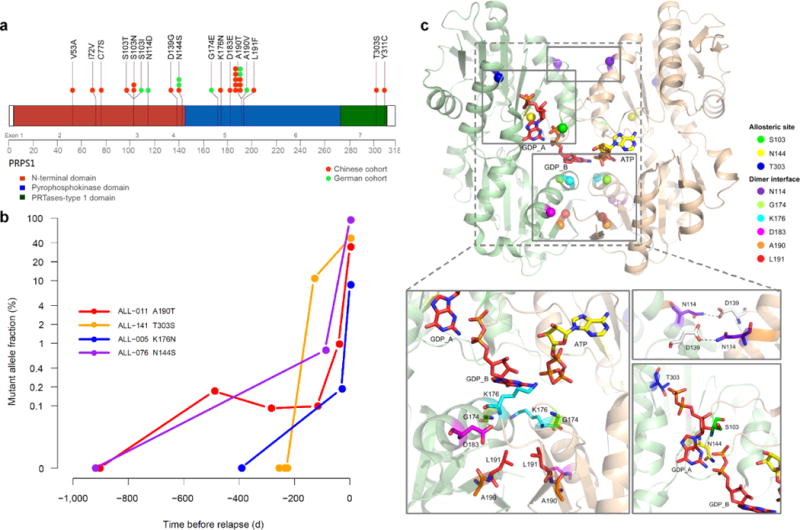
Identification and characterization of relapse-specific somatic mutations. (a) Schematic diagram showing relapse-specific PRPS1 missense mutations and affected protein domains. (b) Emergence of relapse-specific PRPS1 mutations during remission, as detected by ultra-deep sequencing (mean, 250,000 reads). The y-axis represents mutant allele fraction (%) and x-axis represents time before relapse. (c) Relapse-associated mutant PRPS1 residues mapped on the crystal structure of human PRPS1 dimer showing one subunit in beige and the other in tan. Docked ATP (active site) and GDP (allosteric site) are shown as yellow and red stick models, respectively. Cα atoms of mutant residues are shown as spheres. The mutant residues are shown with sticks.
Table 2.
Clinical characteristics of childhood B-ALL patients with or without PRPS1 mutation.
| Characteristic | Chinese cohort (n=138)
|
German cohort (n=220)
|
||||
|---|---|---|---|---|---|---|
| PRPS1 Wild-type (%) n=120 |
PRPS1 Mutated (%) n=18 |
P | PRPS1 Wild-type(%) n=214 |
PRPS1 Mutated (%) n=6 |
P | |
| Age (years) | 0.3651 | 0.2761 | ||||
| <1 year | 6 (5.0) | 0 (0.0) | 5 (2.3) | 0 (0.0) | ||
| 1–9 years | 90 (75.0) | 12 (66.7) | 158 (73.8) | 3 (50.0) | ||
| >10 years | 24 (20.0) | 6 (33.3) | 51 (23.8) | 3 (50.0) | ||
| Sex | 0.3002 | 0.6841 | ||||
| Female | 43 (35.8) | 9 (50.0) | 104 (48.6) | 2 (33.3) | ||
| Male | 77 (64.2) | 9 (50.0) | 110 (51.4) | 4 (66.7) | ||
| WBC count (×109/L) | 0.1011 | 0.4411 | ||||
| <50 | 91 (75.8) | 10 (55.6) | 194 (91.1) | 5 (83.3) | ||
| 50–100 | 12 (10.0) | 2 (11.1) | 12 (5.6) | 1 (16.7) | ||
| >100 | 17 (14.2) | 6 (33.3) | 7 (3.3) | 0 (0.0) | ||
| No data | 1 | 0 | ||||
| Cytogenetics | 0.3241 | 0.7501 | ||||
| E2A-PBX1 | 4 (4.7) | 0 (0.0) | 3 (1.4) | 0 (0.0) | ||
| TEL-AML1 | 9 (10.4) | 0 (0.0) | 34 (16.3) | 0 (0.0) | ||
| BCR-ABL1 | 17 (19.7) | 4 (44.4) | 4 (1.9) | 0 (0.0) | ||
| MLL-AF4 | 1 (1.2) | 0 (0.0) | 4 (1.9) | 0 (0.0) | ||
| Normal | 55 (64.0) | 5 (55.6) | 163 (78.4) | 6 (100.0) | ||
| No data | 34 | 9 | 6 | 0 | ||
| Risk group at relapse | 0.2032 | 0.0101 | ||||
| low and intermediate | 76(63.3) | 8(44.4) | 153 (71.5) | 1 (16.7) | ||
| high | 44(36.7) | 10(55.6) | 61 (28.5) | 5 (83.3) | ||
| Immunophenotype | 0.4561 | 1.0001 | ||||
| pro-B | 5 (4.9) | 0 (0.0) | 11 (5.6) | 0(0.0) | ||
| common B | 83 (81.4) | 13 (76.5) | 154 (78.6) | 6(100.0) | ||
| pre-B | 14 (13.7) | 4 (23.5) | 25 (12.8) | 0(0.0) | ||
| biphenotypic | 0 (0.0) | 0 (0.0) | 6 (3.1) | 0(0.0) | ||
| No data | 18 | 1 | 18 | 0 | ||
| Time of relapse¶ | 0.0021 | <0.0011 | ||||
| very early | 51(42.5) | 11(61.1) | 28 (13.1) | 4 (66.7) | ||
| early | 26(21.7) | 7(38.9) | 51 (23.8) | 2 (33.3) | ||
| late | 43(35.8) | 0(0.0) | 135 (63.1) | 0 (0.0) | ||
| Time of relapse | <0.0011 | <0.0011 | ||||
| on treatment | 77(64.2) | 18 (100.0) | 51(23.8) | 6 (100.0) | ||
| off treatment | 43(35.8) | 0 (0.0) | 163 (76.2) | 0 (0.0) | ||
| Duration of 1st relapse | ||||||
| Median (years) | 1.65 | 1.36 | 2.93 | 1.17 | ||
| NT5C2 mutation | ||||||
| no | 43 | 2 | 105(49.1) | 3(50.0) | ||
| yes | 0 | 0 | 7(3.3) | 0(0.0) | ||
| no data | 77 | 16 | 102(47.6) | 3(50.0) | ||
The P value was calculated with the use of Fisher’s exact test.
The P value was calculated with the use of Chi-square test.
Time of relapse: very early, <18 months after initial diagnosis of ALL; early, ≥18 and <36 months after initial diagnosis of ALL; late, ≥36 months after completion of primary treatment.
PRPS1 is a crucial purine biosynthesis component; therefore, we sequenced the genes ATIC (encoding 5-aminoimidazole-4-carboxamide ribonucleotide formyltransferase/IMP cyclohydrolase), ADSL (encoding adenylosuccinate lyase), PPAT (encoding phosphoribosyl pyrophosphate amidotransferase), GART (encoding phosphoribosylglycinamide formyltransferase), PAICS (encoding phosphoribosylaminoimidazole carboxylase, phosphoribosylaminoimidazole succinocarboxamide synthetase) and PFAS (encoding phosphoribosylformylglycinamidine synthase) in the de novo purine synthesis pathway, the thiopurine metabolism-related genes TPMT (encoding thiopurine S-methyltransferace) and NT5C2, and the HPRT1 (encoding hypoxanthine-guanine phosphoribosyltransferase) gene in the purine salvage pathway in the Chinese cohort (validation cohort, n=160). Sequencing and validation in 160 ALL matched diagnosis-relapse bone marrow samples in the Chinese cohort (138 B-ALLs, 22 T-ALLs) revealed 8 different mutations in the de novo purine pathway in 8 individuals aside from the PRPS1 mutations (Supplementary Table 8), implying the importance of de novo purine pathway in relapse.
Clinical and structural features of PRPS1 mutations
The SCMC and BFM/COALL protocols for the treatment of childhood ALL employed risk-adapted multi-agent chemotherapy, including maintenance therapy consisted of daily 6-MP or 6-TG and weekly methotrexate10–14. The overall frequency of PRPS1 mutation at relapse was 6.7% (24/358); it was significantly higher in the Chinese cohort (13.0%, 18/138) than in the German cohort (2.7%, 6/220) (Table 1). Possible explanations include the observation that the Chinese cohort has more BCR/ABL1 positive individuals, less TEL/AML1 positives and higher percentage of on-treatment relapse (P<0.001). Even though there were differences on therapeutic protocols and mutation frequencies, all 24 individuals with PRPS1 mutation experienced early relapse during the treatment, within 36 months of initial diagnosis (Chinese cohort, P=0.002; German cohort, P<0.001) (Table 2).
To assess whether PRPS1 mutations were present at diagnosis as a rare subclone and could play a causative role in relapse, we retraced four major PRPS1 mutations (including the most frequent A190T and N144S) by ultra-deep sequencing of serial bone marrow samples. Within the resolution of ultra-deep sequencing, none of these individuals had PRPS1 mutations at diagnosis; furthermore, the proportion of mutated PRPS1 increased exponentially prior to clinical relapse, suggesting that drug resistant clones with at least these four major PRPS1 mutations (62.5%, 15/24 cases) could drive relapse (Fig. 1b).
We mapped PRPS1 mutations to the reported crystal structure of human PRPS117,18 to delineate their potential functional effects. Human PRPS1 exists as a hexamer comprising of three homodimers18,19; among relapse-specific PRPS1 mutation sites, residues G174, K176, D183, A190 and L191 form part of the dimer interface and are positioned in proximity to allosteric site B; residues N114 and D139 lie within the dimer interface but farther from the allosteric sites (Fig. 1c). These mutations would destabilize the dimer interface by disrupting favorable interactions thus affecting the binding of GDP or ADP at allosteric site B, as previously described for activating mutants A190V and D183H15,20. S103 and N144 appear to function in GDP or ADP binding at allosteric sites A and B, while T303 is near allosteric site A (Fig. 1c). These mutations could affect the binding of nucleotide inhibitors at the allosteric sites, as previously described for the activating mutants L129I and V142L15,21.
Relapse-specific PRPS1 mutations confer drug resistance
Based on PRPS1’s role in purine biosynthesis and its mutations’ association with on-treatment relapse, we hypothesized that mutations in PRPS1 allow for resistance to nucleoside analogs during the maintenance phase of ALL treatment protocol. We analyzed the effect of wild-type and mutant PRPS1 on response to 6-MP and 6-TG in Reh cell line. Cell viability was dramatically increased after treatment with 6-MP (mean fold increase over vector control, 29; range, 12–54) and 6-TG (mean fold increase over vector control, 34; range, 28–41) in cells expressing 12 of the 17 respective mutants (S103T, S103N, S103I, N114D, N144S, G174E, K176N, D183E, A190T, A190V, L191F and T303S) (Fig. 2a and Supplementary Fig. 4, 5), while wild-type PRPS1 conferred slight resistance, consistent with a gain of function mechanism in drug resistance. Overall, these effects were similar to those of the previously characterized R238W relapse-specific mutation in NT5C2 (Supplementary Fig. 6)7,8. Five PRPS1 mutants, V53A, D139G, I72V, C77S and Y311C, did not dramatically increase drug resistance (Supplementary Fig. 7), were only found in single cases (Fig. 1a) and did not structurally map to the clustered regions (Supplementary Fig. 8; D139G in separate dimer interface), therefore were not pursued further in this work.
Figure 2.
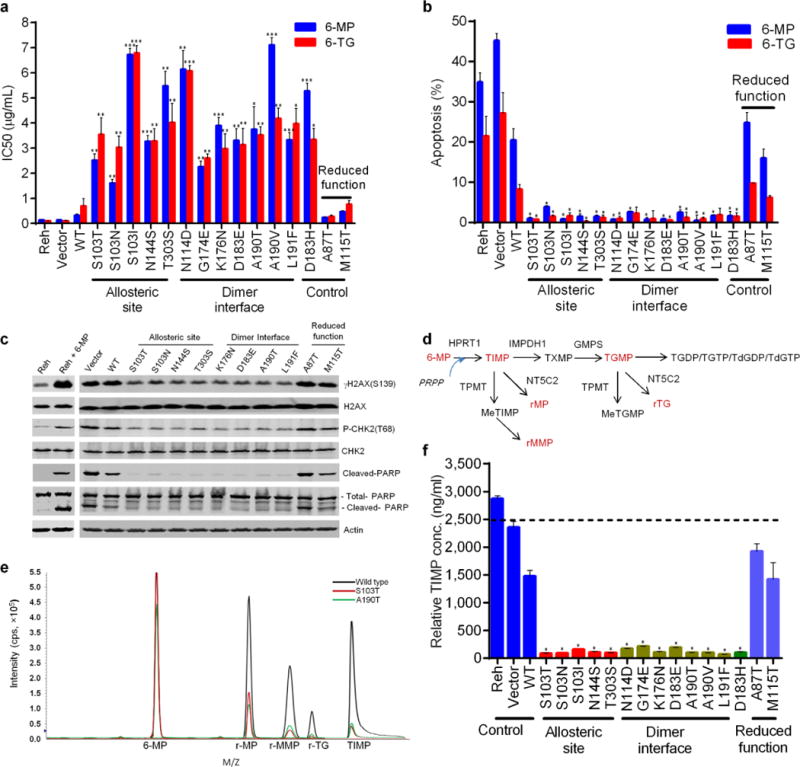
Relapse-specific PRPS1 mutations confer thiopurine resistance. (a) Viability of cells including those with previously characterized activating mutant (D183H) and reduced-function mutants (M115T and A87T) as controls. Values are in IC50. P values were calculated using two-tailed Student’s t tests (*P ≤ 0.01, **P ≤ 0.001, ***P ≤ 0.0001). (b) Apoptosis of cells expressing wild-type PRPS1 or drug resistant mutants after treatment for 72 hr with 10 μg/ml 6-MP or 6-TG. P values were calculated using two-tailed Student’s t tests (*P ≤ 0.05). (c) DNA damage response and apoptosis biomarkers in western blot analysis of Reh cells with the indicated PRPS1 mutations (controls in red) and treated with 10 μg/ml 6-MP. (d) Diagram of purine salvage pathway converting 6-MP into cytotoxic thioguanine nucleotides. NT5C2 clears TIMP and TGMP by hydrolyzing them into r-MP and r-TG, while TPMP methylates TIMP into inactive r-MMP. (e) Identification of 6-MP metabolites TIMP and their derivatives by liquid chromatography and mass spectrometry (LC-MS). Upon sample de-phosphorylation treatment with phosphatase, r-MP and r-MMP are surrogates for TIMP, r-TG is a surrogate for TGMP, respectively. (f) Intracellular TIMP measured by LC-MS in Reh cells expressing various PRPS1 mutants treated with 10 μM 6-MP for 4 hr. Values are relative concentrations estimated based on standard curves of pure compounds without correcting for the cell matrix’s effect. Data are shown as the means ± s.d. P values were calculated using two-tailed Student’s t tests (*P ≤ 0.005).
We also characterized activating mutant D183H with the reduced-function mutants M115T from Charcol-Marie-Tooth disease-5 (CMTX5) and A87T from Deafness-2 (DFN2)20 as controls in our viability assay. D183H mutant conferred resistance similar to drug-resistant mutants, while the reduced-function mutants and PRPS1-knockdown had little effect (Fig. 2c and Supplementary Fig. 7, 9). We observed similar results in Jurkat T-ALL cell line (Supplementary Fig. 10). Interestingly, these relapse-specific PRPS1 mutants had little effects in sensitivities to other chemotherapies that are used in ALL treatment, such as methotrexate, cytosine arabinoside, daunorubicin and L-asparaginase (Supplementary Fig. 11). Our results suggest these PRPS1 mutants behave like a gain-of-function mutant and are resistant to a specific class of drugs used in ALL treatment, purine analogs as opposed to defects in pathways (e.g. apoptosis) shared across classes of cytotoxic agents.
Thiopurines are believed to exert their cytotoxicity primarily by incorporating thioguanine into DNA; post-replicative mismatch repair of aberrant base pairs containing thioguanine then generates potentially lethal DNA lesions, leading to DNA damage response (DDR) and apoptosis22. We found that cells expressing drug-resistant PRPS1 mutants were significantly more resistant to apoptosis after thiopurine treatment than vector control (Fig. 2b, P < 0.05). In addition, the DDR biomarkers γH2AX and Chk2-T68 phosphorylation, and the apoptosis biomarker PARP cleavage were observed less in cells with drug-resistant PRPS1 mutants than in those with wild-type PRPS1 or negative controls (Fig. 2c and Supplementary Fig. 12), consistent with reduced DNA damage.
To provide insight into how PRPS1 mutants influence thiopurine-induced DNA damage, we examined the effects of the PRPS1 mutations on thiopurine prodrug conversion (Fig. 2d). After treatment with 6-MP, Reh cells expressing drug-resistant PRPS1 mutants contained dramatically less thioinosine monophosphate (TIMP, the initial 6-MP conversion product), downstream metabolite thioguanine monophosphate (TGMP) and their derivatives than did controls (Fig. 2d–f and Supplementary Fig. 13, 14). PRPS1 produces PRPP that is used by salvage enzyme HPRT1 to convert 6-MP into TIMP (Fig. 2d); the observed inhibition of TIMP production by PRPS1 mutants could involve either RPPP reduction through a loss-of-function mechanism or inhibition of TIMP production independent of PRPP.
Activating PRPS1 mutants reduce nucleotide feedback inhibition
As PRPS1 activity was best characterized in cellular assays23, we measured the activity of different PRPS1 mutants in Reh cells by following the generation of [13C5]-PRPP from [13C6]-glucose through the pentose phosphate pathway (Fig. 3a,b). As shown in Supplementary Fig. 15, all twelve drug-resistant PRPS1 mutants increased production of PRPP (fold increase over vector control, 3–8). Furthermore, drug-resistant PRPS1 mutants caused a 4 to 12-fold increase in nucleotide IMP incorporation of [13C2, 15N]-glycine (Supplementary Fig. 16), suggesting activation of the de novo purine synthesis pathway. Results were similar when we measured total IMP and the IMP metabolite hypoxanthine (HX) in Reh cells (Supplementary Fig. 16,17). We also noted an increase (although smaller) in the purine salvage pathway activity, as shown by IMP incorporation of [13C5, 15N4]-hypoxanthine (Fig. 3b,c). Of all the nucleotides measured, HX was most dramatically increased: from approximately 1 μM in vector control to approximately 40–60 μM in cells expressing drug-resistant PRPS1 mutant.
Figure 3.
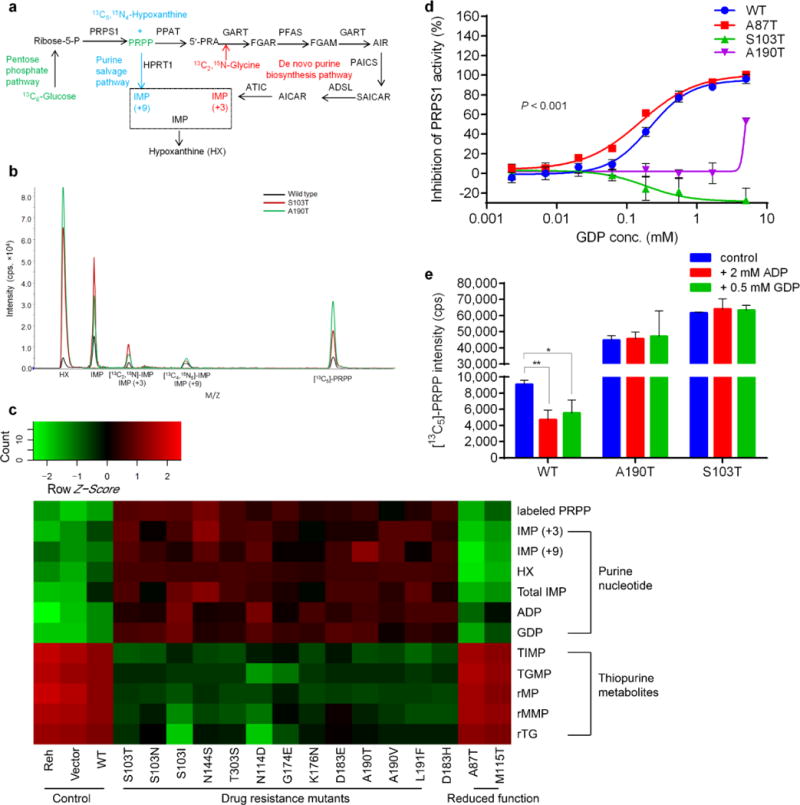
Activating PRPS1 mutations reduce nucleotide feedback inhibition. (a) Diagram illustrating incorporation of [13C2,15N]-glycine into the de novo purine biosynthesis, [13C5,15N4]-hypoxanthine (HX) into the purine salvage and [13C6]-glucose into PRPP leading to both de novo and salvage pathway. (b) Identification of PRPS1 downstream metabolites specific for itself, de novo and salvage purine pathways by LC-MS with isotope-labeled substrates. (c) Heatmap showing metabolomics analysis of nucleotides, de novo purine flux, purine salvage flux and PRPS1 activity in Reh cells expressing different PRPS1 variants. In cells expressing drug-resistant PRPS1 mutant, thiopurine prodrug conversion is inhibited while purine biosynthesis is generally increased. Heatmap was generated by R language (v3.0.2). (d) Feedback inhibition of wild-type and mutant PRPS1 enzyme activities by GDP showing titration curves for wild-type PRPS1, two representative drug resistant mutants and one reduced-function mutant. (e) Nucleotide feedback inhibition of PRPS1 activity measured by [13C5]-PRPP in cells expressing wild-type PRPS1 and representative drug resistant mutants. Data are shown as the means ± s.d. P values were calculated using two-tailed Student’s t tests (*P ≤ 0.05, **P ≤ 0.01).
Kinetic defects underlying PRPS1 superactivity include either regulatory defects (reduced feedback inhibition of purine biosynthesis) or catalytic defects (increased maximal velocity of catalysis)15. To study the mutations’ effect on specific enzyme activities, we purified and assayed wild-type PRPS1, nine drug-resistant and two previously characterized reduced-function mutants (Supplementary Fig. 18), and found none of the drug-resistant mutants to have increased maximal velocity (Supplementary Table 9). We then measured nucleotide feedback inhibition of PRPS1 activity in an enzymatic activity assay with increasing quantities of ADP or GDP. As summarized in Fig. 3d and Supplementary Table 10, all drug resistant PRPS1 mutants showed dramatic shifts in ADP and GDP inhibition of PRPS1 activity (increase in IC50), implicating reduced feedback inhibition as the mechanism of gain-of-function phenotype. Although the drug-resistant mutations form two structural groups (dimer interface vs. allosteric site), they showed similar negative feedback defects, consistent with the previous observation that mutations in either protein-protein interfaces or nucleotide binding sites can affect allosteric enzyme regulation24. A190T and S103T were often used as representatives of the two structural groups for our detailed mechanistic studies, as they are at the most frequently mutated sites of PRPS1 (62.5% of all cases) (Fig. 1a).
PRPS1 feedback inhibition was better characterized in cell-based assays23. As shown in Fig. 3e, ADP or GDP addition reduced PRPS1 cellular activity by approximately 50%, as measured by metabolite flux in the control wild-type cells, but had no effect in cells expressing representative A190T and S103T mutants, further supporting the hypothesis that PRPS1 mutants cause defects in nucleotide feedback inhibition of their activities. Together, our results suggest that negative feedback-defective PRPS1 mutants allow cells to continue the biosynthesis of nucleotides even when their intracellular concentrations are elevated.
Elevated HX inhibits HPRT1-mediated 6-MP conversion
The gain-of-function nature of PRPS1 drug resistant mutants suggested two possible mechanisms of inhibiting TIMP production. One is that HPRT1 is feedback-inhibited by increased IMP25, which is not supported by the fact that cellular HPRT1 activity is not reduced (Fig. 3b,c). Alternative is that because 6-MP is an analog of the IMP catabolic metabolite HX, elevated HX could competitively inhibit 6-MP conversion, leading to reduced DNA damage.
Both purine synthesis end-product IMP and its metabolite HX could mediate the drug resistance and the thiopurine-conversion inhibition (Fig. 4a,b and Supplementary Fig. 19–22). Inside the cell, IMP slightly inhibited HPRT1-dependent salvage pathway activity but suppressed thiopurine conversion to a much greater extent, likely through its catabolic metabolite HX (Supplementary Fig. 23). Consistent with the cellular data, increased IMP can only partially inhibit HPRT1 enzymatic activity at the relevant concentration (5–50 μM) with an IC50 of 310 μM (Supplementary Fig. 24), while increased HX can effectively inhibit HPRT1-catalyzed 6-MP conversion at the relevant concentrations (1–100 μM) with an IC50 of 7.7 μM in enzyme assays (Fig. 4c,d). HX was preferred over 6-MP as a substrate for HPRT1 with a catalytic efficiency of 43.9 fold higher (6-fold lower Km, 7.2-fold higher Vm; Vm/Km ratio, 43.9) (Fig. 4c,d). These data suggest that HX competitive inhibition of 6-MP conversion instead of IMP feedback inhibition of HPRT1 activity was the main mechanism by which enhanced de novo purine biosynthesis caused thiopurine resistance.
Figure 4.
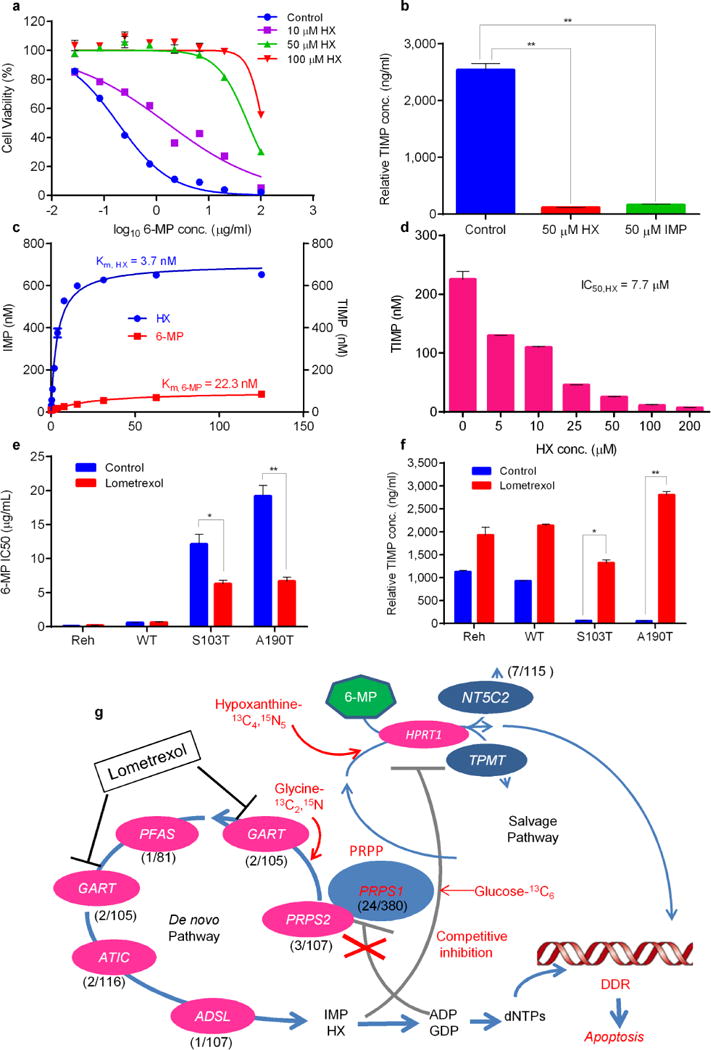
Elevated hypoxanthine (HX) directly inhibits 6-MP conversion which can be reversed by GART inhibitor lometrexol. (a) Viability of Reh cells at increasing concentrations of 6-MP in the presence of HX. (b) Reh cells were treated with 10 μM 6-MP in the presence of different nucleotides, then intracellular TIMP was measured by LC-MS. P values were calculated using two-tailed Student’s t tests (*P ≤ 0.05, **P ≤ 0.005) (c, d) HX is a preferred to 6-MP as an HPRT1 substrate and can suppress 6-MP prodrug conversion. HPRT1 enzyme assays are described in online methods, the concentration of reaction product (IMP, TIMP) was measured by LC-MS. (e, f) Viability of Reh cells with or without 5 ng/ml GART inhibitor lometrexol. TIMP was measured in the same sample set by LC-MS. P values were calculated using two-tailed Student’s t tests (*P ≤ 0.01, **P ≤ 0.001) (g) Genomics, metabolomics and enzyme data were integrated in an indirect metabolic model of thiopurine resistance in ALL involving reduced feedback inhibition, enhanced de novo biosynthesis and competitive inhibition of prodrug conversion. Resistance is reversed by GART inhibitor lometrexol, which can block de novo purine synthesis. The key genes of the de novo purine biosynthesis pathway are shown, with their mutation frequency in relapsed ALL. The mutation frequency of PRPS1, PRPS2, GART, PFAS, ATIC and ADSL was estimated by targeted sequencing of available samples (range, 81–160) from Chinese individuals with relapsed B-ALL or T-ALL. Data are shown as the means ± s.d.
Therapeutic strategy targeting de novo purine biosynthesis
To test whether enhanced de novo purine synthesis is necessary for the drug resistance phenotype, we knocked down de novo pathway-specific ATIC and GART by using CRISPR-CAS9 technology. ATIC or GART knockdown effectively reversed the 6-MP resistance phenotype and HX increase caused by A190T and S103T PRPS1 mutants but had little effect in Reh cells transfected by vector alone or wild-type PRPS1 (Supplementary Fig. 25). Together with results discussed earlier, our data suggest that an enhanced de novo pathway is not only sufficient but also necessary for the PRPS1 mutant-driven drug resistance.
Small molecule inhibitors of de novo purine biosynthesis have been tested as drugs against cancer26, and GART inhibitors are already in clinical development. Among them, lometrexol (also called DDATHF) exhibits antitumor activity (several partial responses and one complete response in Phase I clinical trials)27. Lometrexol treatment of PRPS1 A190T- and S103T-expressing cells inhibited de novo purine synthesis and reversed PRPS1 mutant-driven thiopurine drug resistance (Fig. 4e,f and Supplementary Fig. 26). This striking result suggests that pharmacological inhibition of GART may serve as a therapeutic strategy to overcome PRPS1 mutation-driven thiopurine resistance in relapsed ALL.
Discussion
Two direct mechanisms of modulating thiopurine activities have been identified: either inactivation through methylation by TPMT22 or clearance of cytotoxic nucleotides by relapse-specific NT5C2 mutants7,8. Here we identified an indirect metabolic mechanism involving negative feedback-defective PRPS1 mutants and competitive inhibition of thiopurine activation in about 6.7% of relapsed childhood B-ALL (13.0% in Chinese cohort, 2.7% in German cohort). These distinguishing PRPS1 mutations are relapse-specific that could be acquired during the latent phase of the disease during remission (ultra-deep sequencing at the resolution of 250,000 reads). All individuals with PRPS1 mutations relapsed early on-treatment, having an inferior prognosis28. We noticed that PRPS1 mutant allele fraction increased drastically prior to clinical relapse, suggesting clonal expansion after the acquisition of PRPS1 mutation (Fig. 1b). De novo nucleotide biosynthesis is often upregulated in cancer cells29, as sufficient nucleotides pools are required to maintain DNA fidelity during replication30 and to bypass oncogene-induced senescence31. Multiple levels of interaction between purine biosynthesis and DNA damage response have been discovered32–34, and PRPS1 mutations may play other roles in tumor relapse.
PRPS1 is feedback regulated by allosteric interaction, a key means of metabolic regulation in vivo by which pathway production is adjusted to the level of end-product usage24,36. To our knowledge, this is the first report of a deregulated metabolic feedback mechanism in cancer drug resistance, presenting an intriguing process that couples thiopurine resistance with de novo purine pathway activation to accommodate different needs of tumor cells during relapse. The biochemical “gain of function” mechanism is also supported by the genetic finding of mutations distal to PRPS1 in the de novo purine biosynthesis pathway (Fig. 4g). These findings also suggest therapeutic strategies for overcoming such drug resistance as small molecule inhibitors of de novo purine biosynthesis have been developed against cancer27. GART inhibitor lometrexol can sensitize tumor cells to thiopurines and overcome the drug resistance mechanism caused by PRPS1 activating mutations.
Tumor cells show abnormal nucleotide metabolism, as manifested by a larger nucleotide pool and a more active nucleotide anabolic pathway29,36. Identification of the mechanism by which transformed cells achieve enhanced nucleotide biosynthesis may point the way to clinical anticancer strategies. It was shown recently that c-Myc driven translational up-regulation of the otherwise lowly expressed PRPS2 could enhance nucleotide biosynthesis in Myc-transformed cells37. Here we demonstrated that negative feedback-defective PRPS1 mutants can also drive nucleotide biosynthesis, offering a novel mechanism by which nucleotide pools are enlarged during tumor relapse. We believe that disruption of purine feedback inhibition mechanism, as identified here in relapsed childhood ALL, could have broad implications for many additional cancer types and warrants renewed interest in targeting the de novo purine synthesis pathway in the treatment of human cancers.
METHODS
Methods and any associated references are available in the online version of the paper.
ONLINE METHODS
Patients and samples
Bone marrow samples at the time of diagnosis, relapse, and clinical remission were available from 16 individuals with childhood ALL (12 boys and 4 girls) treated at Shanghai Children’s Medical Center (SCMC) from November 2002 through December 2010. For validation studies, we used bone marrow frozen samples and slides obtained at the time of relapse from an independent cohort of 144 Chinese individuals with relapsed ALL at the same center from January 1998 through August 2011 (Supplementary Table 7a). German individuals in this study were enrolled in the German ALL-REZ BFM 2002 clinical trial for relapsed childhood ALL. The cohort (n = 220) included 114 (52.8%) male and 106 (48.2%) female individuals. Age range was 0.19 – 22.05 years (median 4.96) at initial diagnosis, and 1.34 – 23.82 years (median 9.24) at relapse (Supplementary Table 7b). Individuals were selected from the trial to have a first isolated or combined bone marrow relapse of precursor B ALL. Bone marrow and peripheral blood samples were obtained at the time of relapse, between January 2002 and July 2012. Genomic DNA was extracted from bone marrow leukemic cells after leukemia cell recovery (for whole-exome sequencing) or shaving of bone marrow slides (for the validation study in part of Chinese cohort) by using QIAamp DNA blood mini kit (Qiagen) or Nucleo-Spin Tissue kit (Macherey-Nagel, Germany). The Chinese study was approved and supervised by the SCMC Ethics Committee, which serves the function of an institutional review board ensuring human subject protections, and the clinical trial number of SCMC-ALL-2005 Protocol is ChiCTR-ONC-14005003 (Chinese Clinical Trial Registry). Use of the samples from the German multi-center randomized phase III trial ALL-REZ BFM 2002 (NCT00114348, ClinicalTrials.gov) was approved by the medical faculty ethics committee of the Humboldt University Berlin, Germany. Written informed consent was obtained from patients or their guardians in both centers.
Whole-exome sequencing and analysis
Whole-exome capture libraries were prepared using the SureSelect Human All Exon 50 Mb or 38 Mb kit (Agilent Technologies). We performed paired-end (2 × 100 bp) sequencing by using the Illumina HiSeq2000 instrument, imaging analysis and base calls by using the Illumina Real Time Analysis (RTA) Pipeline software, version 1.9. After removing reads whose sequence matched the sequencing adaptors and low-quality reads (in which more than 50% of bases had a Phred quality score < 5), the remaining reads were aligned to the reference human genome (hg19, http://genome.ucsc.edu/) by using Burrows-Wheeler analysis with default parameters. We identified sites that differed from the reference independently in each sample. SNVs/indels were detected as previously described38,39. The reference human genome assembly GRCh37-lite was used to map all samples. SNVs were identified by using GATK (https://www.broadinstitute.org/gatk/) and filtered using the recommended threshold (SNV Phred quality score ≥ 20, more than 3 reads covered, depth ≥ 8×). After removing germline variants known to have a mutation rate ≥ 5% in normal bone marrow samples, the remainders were potential somatic variants in all diagnosis and relapse samples. We used the Affymetrix Genome-Wide Human SNP 6.0 Array to compare sequencing reads with genotypes and found a high concordance (>97% in all cases except one) (Supplementary Table 4). The translocation data were identified by RT-PCR and customer ordered target-sequencing panel followed by verification with Sanger sequencing. Predicted protein function changes caused by amino acid substitutions in Supplementary Table 2 were examined using PolyPhen (http://genetics.bwh.harvard.edu/pph/) and SIFT (http://sift.jcvi.org/).
Validation and recurrence of PRPS1 mutations
We resequenced all exons of PRPS1 in an independent Chinese cohort of 144 relapse cases. On the basis of preliminary data from this cohort, we analyzed PRPS1 hot-spot mutations in exons 3–5 in the German cohort by Sanger sequencing. PCR amplification used TaKaRa Ex Taq DNA Polymerase (Hot start version) with DNA-specific primers (Supplementary Table 11). Genomic re-sequencing was performed on an ABI 3730xl Genetic analyzer according to the manufacturer’s protocol, and the resulting data were screened for mutations by automated and manual methods. We sequenced the related pathway genes including PRPS2, PPAT, ATIC, GART, PAICS and PFAS (de novo purine biosynthesis), TPMT and NT5C2 (thiopurine metabolism), and HPRT1 (purine salvage pathway).
Cell culture
The leukemia cell lines Reh and Jurkat were cultured in RPMI-1640 medium supplemented with 10% FBS, 100 U/ml penicillin G and 100 μg/ml streptomycin. HEK-293T cells were cultured in DMEM supplemented with 10% FBS, 100 U/ml penicillin G and 100 μg/ml streptomycin. All cells were incubated at 37°C in 5% CO2 unless otherwise specified.
Lentivirus production and infection
The human PRPS1 coding region was cloned into pGV303 GFP Vector (Shanghai GeneChem), and different mutations were constructed by site-directed mutagenesis and confirmed by DNA sequencing. The lentiviral constructs were packaged in plasmids PSPAX2 and PMD2G, and transfected into HEK293T cells using the calcium phosphate method to produce replication-defective virus. Supernatant was harvested after 48 hr, concentrated in a 100-kd column (Amicon purification system, MILLIPORE), and transfected into Reh cells (in which wild-type PRPS1 sequence was verified) supplemented with 8 μg/ml polybrene (Sigma). The medium was changed 24 hr after infection, and GFP-positive cells were sorted in a Moflo XDP (Beckman Coulter).
Cell viability and apoptosis
Cell viability was determined by using the CellTiter-Glo Luminescent kit (Promega) according to the manufacturer’s instructions. Cells were seeded in 96-well plates (10,000 cells per well) and treated for 72 hr with serially diluted drugs. CellTiter-Glo reagents (50 μl) was added to each well and mixed for 10 min before the luminescence was measured on a microplate reader (Biotek, USA). Apoptosis was measured by staining with Annexin V-PE and 7-AAD (AnnexinV-PE Apoptosis Detection kit, BD Pharmingen) followed by flow cytometry on a FACS (BD, Canto II). All experiments were performed in triplicate, and results were calculated as the mean and standard deviation.
Western blot analysis
Treated cells were harvested in lysis buffer and analyzed by SDS-PAGE with the following antibodies: γH2AX (S139) (cat. 9718; 1:1,000 dilution, CST, USA), H2AX (cat. 7631; 1:1,000 dilution, CST, USA), phospho-CHK2 (T68) (cat. 1538-1; 1:1,000 dilution, CST, USA), CHK2 (cat. 3428-1; 1:50,000 dilution, Epitomics, USA), PARP (cat. 9542; 1:1,000 dilution, CST, USA), Cleaved-PARP (cat. 5625; 1:1,000 dilution, CST, USA), His-tag (cat. sc-8036; 1:1,000 dilution, Santa Cruz, USA), and actin (cat. sc-8432, 1:5,000 dilution, Santa Cruz, USA). Immunoblots were analyzed by using the Odyssey system (LI-COR Biosciences, USA).
Protein purification
We cloned wild-type and mutated PRPS1 and HPRT1 genes with an N-terminal hexahistidine (6×His) tag into the pET-28a expression vector. The Escherichia coli BL21 (DE3) strain (Tiangen) was transfected with the plasmids for over-expression. The harvested cell pellets were suspended in buffer A [50 mM NaH2PO4 (pH 8.0), 1 M NaCl, 15 % (w/v) glycerol, 5 mM 2-mercaptoethanol and 1 mM PMSF] and lysed on ice by sonication disruption. The supernatants were collected by centrifugation and loaded on a pre-balanced 2 ml Ni Sepharose FF column (GE Healthcare) in the AKTA purifier system. The column was washed with buffer A and eluted with buffer B (Buffer A+500 mM imidazole). We removed imidazole by buffer exchange in G25 desalting columns (GE Healthcare), and assessed protein expression and purity by SDS-PAGE with Commassie blue staining.
Enzymatic activity
ADP and GDP feedback inhibition of PRPS1 were assayed by using the Kinase-Glo Kit (Promega) according to the manufacturer’s instructions. ADP or GDP was diluted with assay buffer (50 mM Tris, pH 7.5, 10 mM MgCl2, 1 mM DTT) from 5 mM to 0.25 μM. 10 μl enzyme mixture (500 μM ATP, 500 μM PRPP, 2 mM phosphate and 1–5 μg/ml PRPS1) was incubated at 37°C for 1 hr. The reaction was terminated by adding 10 μl kinase-Glo reagent. For the PRPS1 kinetics study, the quantity of AMP produced was measured indirectly by monitoring the decrease in absorbance of NADH at 340 nm by the enzyme coupling assay as previously described40.
HPRT1 activity was assayed in a 60 μl mixture containing 200 μM PRPP plus various concentrations of HX or 6-MP. After addition of 2 nM HPRT1 and incubation at 37°C for 10 min, the reaction was quenched by adding 180 μl of cold 80% methanol. Concentration of reaction products IMP and TIMP was measured by LC-MS (ABI 5500 Qtrap coupled with Waters Acquity UPLC).
Structural analysis
Structural analysis of various PRPS1 mutants was based on the crystal structure of human PRPS1 (PDB code, 2HCR)41. ATP was docked to the active site on the basis of the position of bound AMP. The nucleotide inhibitor GDP was docked to allosteric site A on the basis of the position of bound ADP analog in the structure of Bacillus subtilis PRPS42, and to allosteric site B on the basis of the position of bound SO42− ion in the structure of human PRPS1. The structural figures were prepared using Pymol software (www.pymol.org).
Stable gene knockdown
Lentiviral shRNAs were used to knockdown PRPS1 expression in Reh cells. pLKO.1 shRNA vector and scrambled control pLKO.1 shRNA were purchased from Thermo Fisher Scientific. The knockdown efficiency of each shRNA was tested by RT-PCR. CRISPRs (clustered regularly interspaced short palindromic repeats) designed at http://crispr.mit.edu were provided by the Zhang laboratory and were cloned into the lentiCRISPR/Cas9 vector (Addgene, cat.49535) by following the Zhang laboratory’s protocol. The sequence targeted by ATIC CRISPR is TGAATCTGGTCGCTTCCGGA and the sequence targeted by GART CRISPR is GCAGCCCGAGTACTTATAAT.
Metabolite flux
Cells were cultured in RPMI 1640 at a density of 5×10⁵/ml. After addition of [13C2 15N]-glycine (Sigma, cat.489522) or [13C5, 15N4]-hypoxanthine (Cambridge isotope laboratories, cat.CNLM-7894-PK), cells were cultured for an additional 2 hr, then harvested and pelleted. The reaction was quenched in cold 80% methanol, cells were centrifuged at 12,000 rpm for 10 min, and metabolites in the supernatant were analyzed by LC-MS. IMP synthesis (or flux) through the de novo purine synthesis pathway was measured by [13C2, 15N] incorporation into cells (molecular weight peak IMP+3); IMP synthesis (flux) through the purine salvage pathway was measured by [13C5, 15N4] incorporation (molecular weight peak IMP+9). The relative concentrations were defined according to the standard curve of compounds dissolved in 80% methanol without correcting for cell matrix effect.
For PRPP measurement, cells were cultured in RPMI 1640 and incubated with [U-13C6]-D-glucose (Cambridge isotope laboratories, cat.CLM-1396-1) for 5 min. Cells were then harvested and pelleted, and the reaction was quenched in cold 80% methanol. The newly synthesized PRPP in cells was measured by [13C5] incorporation (molecular weight peak PRPP+5).
Thiopurine conversion and thiopurine metabolites
Cells were cultured for 4 hr in RPMI 1640 containing 10 μM 6-MP, then harvested and assayed by a modified method based on what previously described43. Intracellular accumulation of TIMP, TGMP, other 6-MP metabolites and their derivatives were determined by LC-MS. The relative concentration was defined according to the standard curve of compound dissolved in 80% methanol.
Statistical analysis
Age, sex, WBC count, risk group, fusion genes, immunophenotype, clinical and cytogenetic parameters were compared in individuals with vs. without PRPS1 mutations by Fisher’s exact test or Pearson chi-squared test. Mean enzymatic activity and cytotoxic assay values were compared between wild-type and different mutant PRPS1s by two-sided student T-tests. Statistical analyses used the PASW statistical software package (version 18.0, SPSS Institute, Chicago, IL, USA).
Supplementary Material
Acknowledgments
We thank the BioBank staff at SCMC for the clinical sample collection, W.L. Carroll (New York University) for providing NT5C2 R238 plasmid, Z. Carpenter (Columbia University) for suggesting PRPS1 superactivity references, and G. Wu and X. Chen (St. Jude Children’s Research Hospital) for assisting in genomics data analysis. We are grateful to W.E. Evans (St. Jude Children’s Research Hospital), C.H. Pui (St. Jude Children’s Research Hospital), X.M. Tong (Shanghai Jiao Tong University School of Medicine), and G.L. Waldrop (Louisiana State University) for critical comments and constructive suggestions on the manuscript. This work is supported by grants from the National Basic Research Program of China (973 program 2015CB553904 to B.B.Z.), the National Natural Science Foundation of China (81372349 to B.B.Z., 81470313 to J.C.), the Science and Technology Commission of Shanghai Municipality (13431900502 to B.B.Z., 14411950600 to J.C., 10411965100 to B.S.L., 11JC1408100 to J.Y.T., 13431902000, 13DZ2291800 and 11DZ2292600 to S.Y.W.), Science and Technology Commission of Pudong New Area Foundation (PKJ2014-Y02 to B.S.L.), the Project HOPE-Hospital Foundation Supporting Children with Cancer Program (B.S.L.), the Programs of Shanghai Municipal Education Commission (12ZZ111 to B.S.L.), NIH CA21765 and ALSAC (American Lebanese Syria Associated Charities to C.H.P.), the German Foundation for Childhood Cancer (DKS 2003.08, 2007.02 to R.K.-S.), the Charité–Universitätsmedizin Berlin (Rahel Hirsch fellowship to R.K.-S.), the Innovative Research Award by the Alex Lemonade Stand Foundation (A.F.), Quest for Cures grant by the Leukemia and Lymphoma Society (A.F.), China Postdoctoral Science Foundation (2014M561484 to H.L.), and a HHMI International Student Research Fellowship (G.Z.).
Footnotes
Note: Any Supplementary Information is available in the online version of the paper.
AUTHOR CONTRIBUTIONS
B.S.L., B.B.Z., H.L., S.Y.W., Y.B., A.F., R.K.S., J.Y.T., J.H.Z. L.J.G. and J.P.D. designed research strategy and wrote the manuscript. B.S.L., S.Y.W. and J.Y.T. designed genomic study. B.B.Z. and H.L. designed functional study, analyzed the functional data, coordinated and managed overall project. H.H.L., L.X.D., X.H.H., L.J., H.K. and S.T.C. performed Chinese cohort sample collection, DNA preparation, exome capture, and exome sequencing. J.H.Z., Y.B., G.L., S.Y.W., X.T.M. and M.J.Y. analyzed exome sequencing data. A.F. and G.T. performed German cohort DNA sequencing and analyzed the data. L.J.G., J.Y.T., B.S.L., S.H.S. and J.C. analyzed Chinese cohort clinical data. R.K.S. and A.V.S. analyzed German cohort clinical data, prepared DNA sample. H.L. and Y.C. performed cell biology experiments. W.J.L. and J.P.D. analyzed PRPS1 structure. H.S.L. and H.L. performed enzyme experiments. T.M.W. and Y.C. performed DDR assay and western blots. H.L., Y.C., H.S.L. and A.D. performed metabolite flux and thiopurine conversion experiments.
COMPETING FINANCIAL INTERESTS
The authors declare no competing financial interests.
References
- 1.Pui CH, Carroll WL, Meshinchi S, Arceci RJ. Biology, risk stratification, and therapy of pediatric acute leukemias: an update. J Clin Oncol. 2011;29:551–565. doi: 10.1200/JCO.2010.30.7405. [DOI] [PMC free article] [PubMed] [Google Scholar]
- 2.Pui CH. Recent advances in the biology and treatment of childhood acute lymphoblastic leukemia. Curr Opin Hematol. 1998;5:292–301. doi: 10.1097/00062752-199807000-00009. [DOI] [PubMed] [Google Scholar]
- 3.Aarbakke J, Janka-Schaub G, Elion GB. Thiopurine biology and pharmacology. Trends Pharmacol Sci. 1997;18:3–7. doi: 10.1016/s0165-6147(96)01007-3. [DOI] [PubMed] [Google Scholar]
- 4.Wyngaarden JB. Regulation of purine biosynthesis and turnover. Adv Enzyme Regul. 1976;14:25–42. doi: 10.1016/0065-2571(76)90006-6. [DOI] [PubMed] [Google Scholar]
- 5.Becker MA, Kim M. Regulation of purine synthesis de novo in human fibroblasts by purine nucleotides and phosphoribosylpyrophosphate. J Biol Chem. 1987;262:14531–14537. [PubMed] [Google Scholar]
- 6.Nosal JM, Switzer RL, Becker MA. Overexpression, purification, and characterization of recombinant human 5-phosphoribosyl-1-pyrophosphate synthetase isozymes I and II. J Biol Chem. 1993;268:10168–10175. [PubMed] [Google Scholar]
- 7.Meyer JA, et al. Relapse-specific mutations in NT5C2 in childhood acute lymphoblastic leukemia. Nat Genet. 2013;45:290–294. doi: 10.1038/ng.2558. [DOI] [PMC free article] [PubMed] [Google Scholar]
- 8.Tzoneva G, et al. Activating mutations in the NT5C2 nucleotidase gene drive chemotherapy resistance in relapsed ALL. Nat Med. 2013;19:368–371. doi: 10.1038/nm.3078. [DOI] [PMC free article] [PubMed] [Google Scholar]
- 9.Mullighan CG, et al. Genomic analysis of the clonal origins of relapsed acute lymphoblastic leukemia. Science. 2008;322:1377–1380. doi: 10.1126/science.1164266. [DOI] [PMC free article] [PubMed] [Google Scholar]
- 10.Gu LJ, et al. Clinical outcome of children with newly diagnosed acute lymphoblastic leukemia treated in a single center in Shanghai, China. Leuk Lymphoma. 2008;49:488–494. doi: 10.1080/10428190701784730. [DOI] [PubMed] [Google Scholar]
- 11.Tang JY, et al. Evaluation on protocol SCMS-ALL-2005 for childhood B lineage acute lymphoblastic leukemia. J Chin Med Assoc. 2012;92:546–550. [PubMed] [Google Scholar]
- 12.Conter V, et al. Molecular response to treatment redefines all prognostic factors in children and adolescents with B-cell precursor acute lymphoblastic leukemia: results in 3184 patients of the AIEOP-BFM ALL 2000 study. Blood. 2010;115:3206–3214. doi: 10.1182/blood-2009-10-248146. [DOI] [PubMed] [Google Scholar]
- 13.Escherich G, Zimmermann M, Janka-Schaub G. Doxorubicin or daunorubicin given upfront in a therapeutic window are equally effective in children with newly diagnosed acute lymphoblastic leukemia. A randomized comparison in trial CoALL 07-03. Pediatr Blood Cancer. 2013;60:254–257. doi: 10.1002/pbc.24273. [DOI] [PubMed] [Google Scholar]
- 14.Henze G, v Stackelberg A, Eckert C. ALL-REZ BFM–the consecutive trials for children with relapsed acute lymphoblastic leukemia. Klin Padiatr. 2013;225(Suppl 1):S73–78. doi: 10.1055/s-0033-1337967. [DOI] [PubMed] [Google Scholar]
- 15.Becker MA, Smith PR, Taylor W, Mustafi R, Switzer RL. The genetic and functional basis of purine nucleotide feedback-resistant phosphoribosylpyrophosphate synthetase superactivity. J Clin Invest. 1995;96:2133–2141. doi: 10.1172/JCI118267. [DOI] [PMC free article] [PubMed] [Google Scholar]
- 16.Hof J, Szymansky A, Stackelberg A, Eckert C, Kirschner-Schwabe R. Clinical Significance of NT5C2 Mutations in Children with First Relapse of B-Cell Precursor Acute Lymphoblastic Leukemia. ASH Annu Meet. 2014 Abstr#3789. [Google Scholar]
- 17.Tang W, et al. Expression, purification, crystallization and preliminary X-ray diffraction analysis of human phosphoribosyl pyrophosphate synthetase 1 (PRS1) Acta Crystallogr Sect F Struct Biol Cryst Commun. 2006;62:432–434. doi: 10.1107/S1744309106009067. [DOI] [PMC free article] [PubMed] [Google Scholar]
- 18.Li S, Lu Y, Peng B, Ding J. Crystal structure of human phosphoribosylpyrophosphate synthetase 1 reveals a novel allosteric site. Biochem J. 2007;401:39–47. doi: 10.1042/BJ20061066. [DOI] [PMC free article] [PubMed] [Google Scholar]
- 19.Fox IH, Kelley WN. Human phosphoribosylpyrophosphate synthetase. Distribution, purification, and properties. J Biol Chem. 1971;246:5739–5748. [PubMed] [Google Scholar]
- 20.de Brouwer AP, et al. PRPS1 mutations: four distinct syndromes and potential treatment. Am J Hum Genet. 2010;86:506–518. doi: 10.1016/j.ajhg.2010.02.024. [DOI] [PMC free article] [PubMed] [Google Scholar]
- 21.Moran R, et al. Phosphoribosylpyrophosphate synthetase superactivity and recurrent infections is caused by a p.Val142Leu mutation in PRS-I. Am J Med Genet A. 2012;158A:455–460. doi: 10.1002/ajmg.a.34428. [DOI] [PubMed] [Google Scholar]
- 22.Karran P, Attard N. Thiopurines in current medical practice: molecular mechanisms and contributions to therapy-related cancer. Nat Rev Cancer. 2008;8:24–36. doi: 10.1038/nrc2292. [DOI] [PubMed] [Google Scholar]
- 23.Zoref E, De Vries A, Sperling O. Mutant feedback-resistant phosphoribosylpyrophosphate synthetase associated with purine overproduction and gout. Phosphoribosylpyrophosphate and purine metabolism in cultured fibroblasts. J Clin Invest. 1975;56:1093–1099. doi: 10.1172/JCI108183. [DOI] [PMC free article] [PubMed] [Google Scholar]
- 24.Gerhart J. From feedback inhibition to allostery: the enduring example of aspartate transcarbamoylase. FEBS J. 2014;281:612–620. doi: 10.1111/febs.12483. [DOI] [PubMed] [Google Scholar]
- 25.Breton A, et al. Lethal accumulation of guanylic nucleotides in Saccharomyces cerevisiae HPT1-deregulated mutants. Genetics. 2008;178:815–824. doi: 10.1534/genetics.107.083295. [DOI] [PMC free article] [PubMed] [Google Scholar]
- 26.Christopherson RI, Lyons SD, Wilson PK. Inhibitors of de novo nucleotide biosynthesis as drugs. Acc Chem Res. 2002;35:961–971. doi: 10.1021/ar0000509. [DOI] [PubMed] [Google Scholar]
- 27.Adams J, Elliott PJ. New agents in cancer clinical trials. Oncogene. 2000;19:6687–6692. doi: 10.1038/sj.onc.1204088. [DOI] [PubMed] [Google Scholar]
- 28.Tallen G, et al. Long-term outcome in children with relapsed acute lymphoblastic leukemia after time-point and site-of-relapse stratification and intensified short-course multidrug chemotherapy: results of trial ALL-REZ BFM 90. J Clin Oncol. 2010;28:2339–2347. doi: 10.1200/JCO.2009.25.1983. [DOI] [PubMed] [Google Scholar]
- 29.Tong X, Zhao F, Thompson CB. The molecular determinants of de novo nucleotide biosynthesis in cancer cells. Curr Opin Genet Dev. 2009;19:32–37. doi: 10.1016/j.gde.2009.01.002. [DOI] [PMC free article] [PubMed] [Google Scholar]
- 30.Bester AC, et al. Nucleotide deficiency promotes genomic instability in early stages of cancer development. Cell. 2011;145:435–446. doi: 10.1016/j.cell.2011.03.044. [DOI] [PMC free article] [PubMed] [Google Scholar]
- 31.Aird KM, et al. Suppression of nucleotide metabolism underlies the establishment and maintenance of oncogene-induced senescence. Cell Rep. 2013;3:1252–1265. doi: 10.1016/j.celrep.2013.03.004. [DOI] [PMC free article] [PubMed] [Google Scholar]
- 32.Zhou BB, Elledge SJ. The DNA damage response: putting checkpoints in perspective. Nature. 2000;408:433–439. doi: 10.1038/35044005. [DOI] [PubMed] [Google Scholar]
- 33.Kozhevnikova EN, et al. Metabolic enzyme IMPDH is also a transcription factor regulated by cellular state. Mol Cell. 2012;47:133–139. doi: 10.1016/j.molcel.2012.04.030. [DOI] [PubMed] [Google Scholar]
- 34.Reddy BA, et al. Nucleotide biosynthetic enzyme GMP synthase is a TRIM21-controlled relay of p53 stabilization. Mol Cell. 2014;53:458–470. doi: 10.1016/j.molcel.2013.12.017. [DOI] [PubMed] [Google Scholar]
- 35.Changeux JP. 50th anniversary of the word “allosteric”. Protein Sci. 2011;20:1119–1124. doi: 10.1002/pro.658. [DOI] [PMC free article] [PubMed] [Google Scholar]
- 36.Wintzerith M, Ciesielski-Treska J, Dierich A, Mandel P. Comparative investigation of free nucleotides in two neuroblastoma clonal cell lines. J Neurochem. 1976;26:205–207. [PubMed] [Google Scholar]
- 37.Cunningham JT, Moreno MV, Lodi A, Ronen SM, Ruggero D. Protein and nucleotide biosynthesis are coupled by a single rate-limiting enzyme, PRPS2, to drive cancer. Cell. 2014;157:1088–1103. doi: 10.1016/j.cell.2014.03.052. [DOI] [PMC free article] [PubMed] [Google Scholar]
- 38.Zhang J, et al. A novel retinoblastoma therapy from genomic and epigenetic analyses. Nature. 2012;481:329–334. doi: 10.1038/nature10733. [DOI] [PMC free article] [PubMed] [Google Scholar]
- 39.Zhang J, et al. The genetic basis of early T-cell precursor acute lymphoblastic leukaemia. Nature. 2012;481:157–163. doi: 10.1038/nature10725. [DOI] [PMC free article] [PubMed] [Google Scholar]
- 40.Alderwick LJ, et al. Biochemical characterization of the Mycobacterium tuberculosis phosphoribosyl-1-pyrophosphate synthetase. Glycobiology. 2011;21:410–425. doi: 10.1093/glycob/cwq173. [DOI] [PMC free article] [PubMed] [Google Scholar]
- 41.Li S, Lu Y, Peng B, Ding J. Crystal structure of human phosphoribosylpyrophosphate synthetase 1 reveals a novel allosteric site. Biochem J. 2007;401:39–47. doi: 10.1042/BJ20061066. [DOI] [PMC free article] [PubMed] [Google Scholar]
- 42.Eriksen TA, Kadziola A, Bentsen AK, Harlow KW, Larsen S. Structural basis for the function of Bacillus subtilis phosphoribosyl-pyrophosphate synthetase. Nat Struct Biol. 2000;7:303–308. doi: 10.1038/74069. [DOI] [PubMed] [Google Scholar]
- 43.Dervieux T, et al. HPLC determination of thiopurine nucleosides and nucleotides in vivo in lymphoblasts following mercaptopurine therapy. Clin Chem. 2002;48:61–68. [PubMed] [Google Scholar]
Associated Data
This section collects any data citations, data availability statements, or supplementary materials included in this article.