Abstract
Age-associated insulin resistance (IR) and obesity-associated IR are two physiologically distinct forms of adult onset diabetes. While macrophage-driven inflammation is a core driver of obesity-associated IR1–6, the underlying mechanisms of the obesity-independent yet highly prevalent age-associated IR7 are largely unexplored. Comparative adipo-immune profiling (AIP) reveals that fat-resident regulatory T cells, termed fTregs, accumulate in adipose tissue as a function of age, but not obesity. Supporting the existence of two distinct mechanisms underlying IR, mice deficient in fTregs are protected against age-associated IR, yet remain susceptible to obesity-associated IR and metabolic disease. In contrast, selective depletion of fTregs via anti-ST2 antibody treatment increases adipose tissue insulin sensitivity. These findings establish that distinct immune cell populations within adipose tissue underlie aging- and obesity-associated IR and implicate fTregs as adipo-immune drivers and potential therapeutic targets in the treatment of age-associated IR.
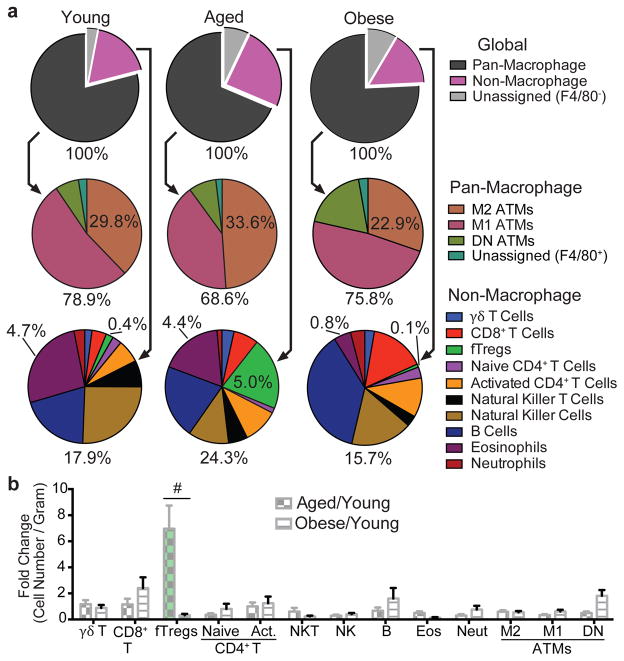
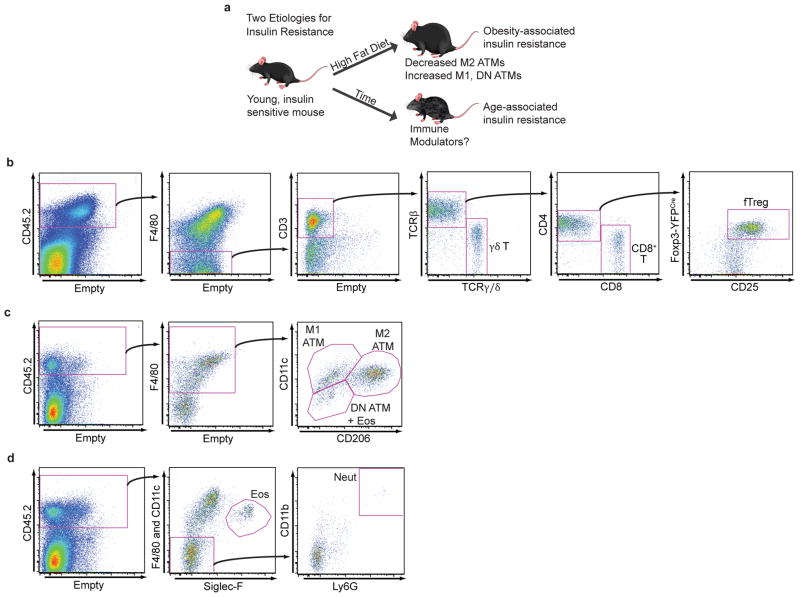
The young, lean state is associated with insulin sensitivity, while both aging and obesity can lead to the development of insulin resistance (IR, Extended Data Fig. 1a). To explore key immune cell types that drive age- versus obesity-associated IR, we quantitatively profiled the immune cell components of adipose depots using a flow cytometry approach termed adipo-immune profiling (AIP) (Extended Data Fig. 1b–d, Extended Data Table 1). In contrast to the decrease in anti-inflammatory M2 adipose tissue macrophages (ATMs) and eosinophils observed in obesity-driven IR, AIP revealed that these cell populations are largely unperturbed in visceral adipose tissue (VAT) from aged mice (M2 ATMs – aged: 33.6 ± 3.8%, young: 29.8 ± 4.1%, obese: 22.9 ± 6.3%; eosinophils – aged: 4.4% ± 1.6%, young: 4.7% ± 0.7%, obese: 0.8% ± 1.0%, Fig. 1a)8–12. Rather, the relative portion of the non-macrophage compartment is significantly increased in aged compared to young or obese mice (aged: 24.3 ± 4.6%, young: 17.9 ± 2.8%, obese 15.7 ± 3.8%, Fig. 1a), which is largely attributable to a ~12 fold expansion in the fat-resident regulatory T cell (fTreg) population (aged: 5.0 ± 1.2%, young: 0.4 ± 0.1%, obese: 0.1 ±0.1%, Fig. 1a,b)13,14. These condition-dependent AIP signatures of adipose tissue suggest that distinct pathophysiologic processes drive age- and obesity-associated IR and specifically implicate fTregs in age-associated IR.
Figure 1. fTregs are selectively enriched in aged mice.
(a) Visceral adipose tissue (VAT) adipo-immune profiles (AIP) from mice at 12 weeks (young, n=10), 44 weeks (aged, n=10), and in diet-induced obese (DIO) mice (n=10). Immune cells abundance, expressed as percentage of CD45.2+ cells. (b) Changes in immune cell abundance between indicated groups, expressed as fold change in cell number per gram of VAT. Obese mice were fed a high fat diet for 12 weeks from 12 weeks of age. Data represents mean ± s.e.m. #, false discovery rate < 2%.
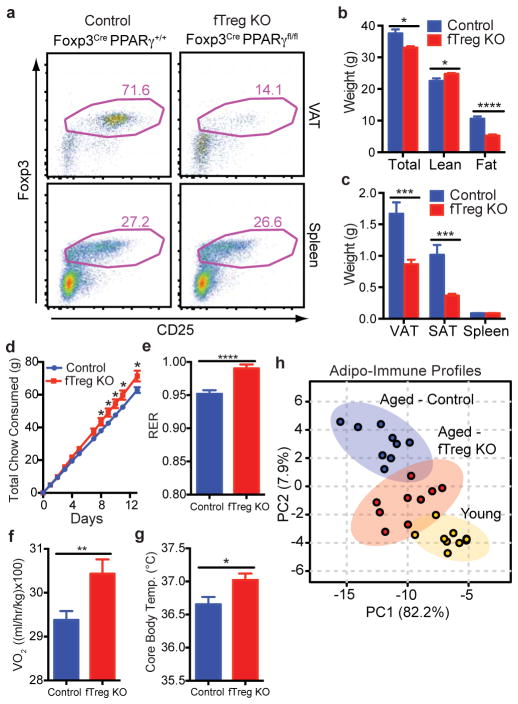
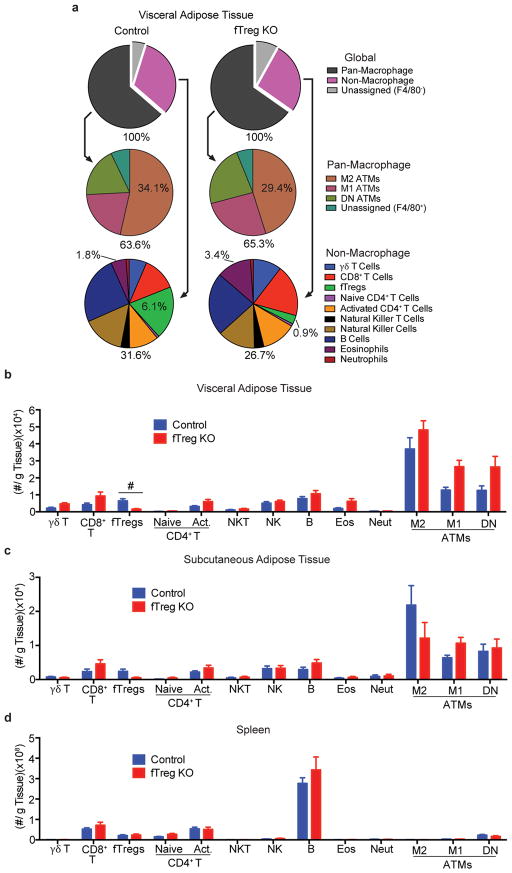
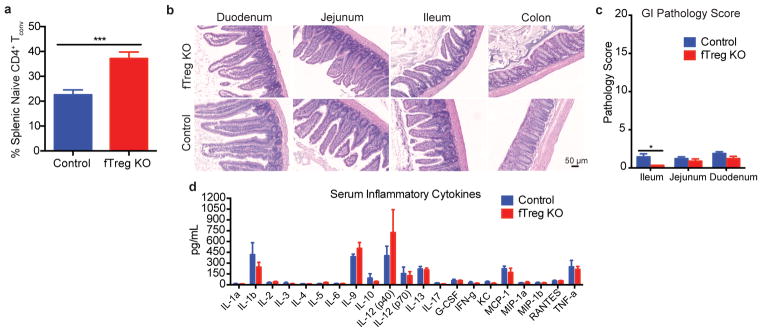
Tregs in the fat express Pparγ at a high level, which allows them to expand their relative numbers approximately 6–7 fold15. Knockout of Pparγ in Tregs blocks this accumulation. Accordingly, we exploit this observation by creating Foxp3Cre Pparγfl/fl mice in which Tregs are selectively depleted (6.1%→0.9%) from VAT (fTreg KO mice, Fig. 2a, Extended Data Fig. 2a,b)15, although depletion of PPARγ-positive Tregs in tissues such as muscle and liver cannot be ruled out. This depletion is achieved without significantly altering the immune profiles of subcutaneous adipose tissue (SAT) or spleen (Extended Data Fig. 2c,d). Importantly, the 6.8 fold VAT-specific loss of fTregs does not elicit any overt signs of systemic inflammation generally associated with Treg dysfunction. Aged fTreg KO mice have normal-sized spleens and increased CD62Lhi CD44lo naive CD4+ T cell populations compared to WT controls (Fig. 2c, Extended Data Fig. 3a). The normal intestinal histology provides additional evidence that the Treg population is not perturbed (Extended Data Fig. 3b,c). Furthermore, no differences are observed in the levels of inflammatory cytokines, including TNFα, IL1β, IL6, IFNγ, and IL17, in the serum of aged fTreg KO compared to control mice (Extended Data Fig. 3d).
Figure 2. fTreg KO mice are protected from general hallmarks of metabolic aging.
(a) Representative FACS plots of fTreg KO (Foxp3Cre PPARγfl/fl) and control (Foxp3Cre PPARγ+/+) mice depicting Treg enrichment in VAT and spleen (~15 months, CD45.2+ CD4+ gating). (b) Total body weight (n=15 per group), and lean and fat mass of control and fTreg KO mice (~12 months, n=8 per group). (c) Mass of VAT, SAT, and spleen in aged control and fTreg KO mice (~15 months, n=9 per group). (d) Cumulative food consumption of control and fTreg KO mice (~8–9 months old, n=8 per group). (e–f) Average 24 hour respiratory exchange ratio (RER) of (e) and average VO2 consumed by (f) aged control and fTreg KO mice (~11 months, n=6 per group) (g) Core body temperature of control and fTreg mice (~13 months old, n=9 per group). (h) Principal component analysis of non-macrophage AIPs of young (12 weeks), aged (~15 months) and aged-fTreg KO (~15 months) mice. Data represents mean ± s.e.m. *p<0.05, **p<0.01, ***p<0.001, ****p<0.0001.
Intriguingly, the selective loss of fTregs attenuates many of the hallmarks of age-associated metabolic dysregulation16. They weigh less than control mice and are leaner (decreased VAT and SAT adiposity) despite increased food consumption (Fig. 2b–d). In addition, the respiratory exchange ratio (RER, Fig. 2e), oxygen consumption (Fig. 2f), and core body temperature (Fig. 2g) are increased in aged fTreg KO mice relative to control mice. These marked improvements suggest that the age-associated metabolic phenotype is closely linked with VAT immune responses, and that in the aged setting, a reduction in fTreg numbers may be protective. Indeed, the AIPs of aged fTreg KO mice are shifted towards those of young mice, as visualized by principal component analysis (Fig. 2h).
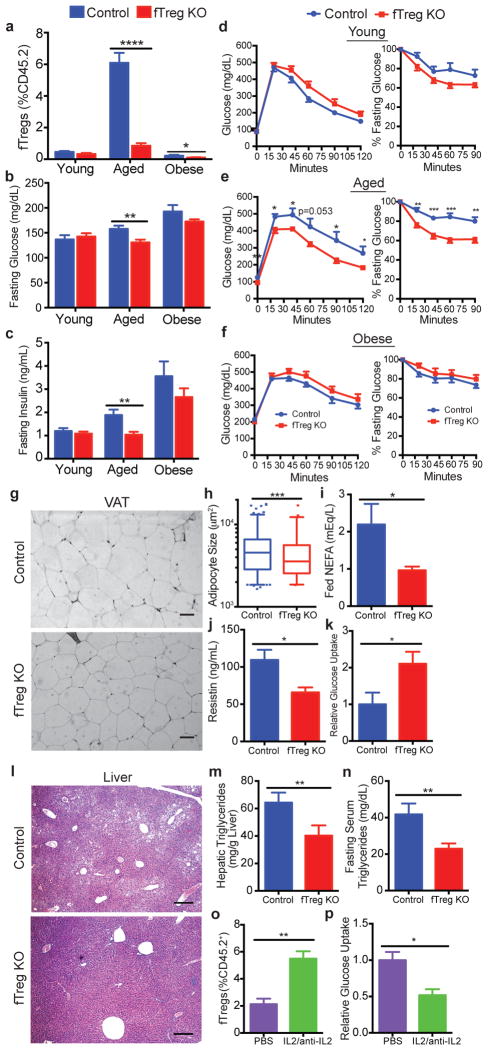
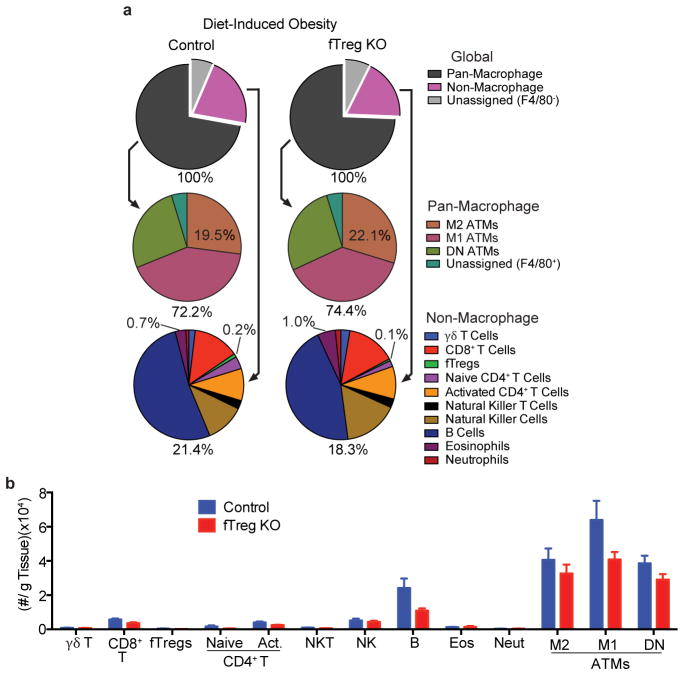
Although the fTreg KO phenotype is most pronounced in aged mice, a reduction in fTreg levels can also be found in obese fTreg KO mice (Fig. 3a). However, the beneficial metabolic effects of fTreg ablation are only significant in age-associated metabolic dysregulation where fasting serum glucose and insulin levels are significantly reduced (Fig. 3b,c, Extended Data Fig. 4a). Furthermore, aged fTreg KO mice display smaller glucose excursions during glucose tolerance tests (GTTs) and increased sensitivity during insulin tolerance tests (ITTs) compared to weight-matched control mice (Fig. 3e). Again, these improvements in glucose homeostasis are observed only in aged mice; no significant differences are seen in young or obese fTreg KO mice (Fig. 3d,f), which is consistent with the largely unchanged AIP of obese fTreg KO mice (Extended Data Fig. 5a,b).
Figure 3. Loss of fTregs protects against the clinical hallmarks of age-associated insulin resistance.
(a) fTreg levels in VAT from control and fTreg KO (Foxp3Cre PPARγfl/fl) mice in young (control n=6; fTreg KO n=6), aged (~15 months old; control n=10; fTreg KO n=10), and obese (control n=6; fTreg KO n=8) cohorts. (b) Fasting serum glucose and (c) insulin levels in control and fTreg KO mice in young (control n=9; fTreg KO n=9), aged (36 weeks old, control n=9; fTreg KO n=11), and obese (control n=10; fTreg KO n=10) cohorts. (d–f) Glucose tolerance (left) and insulin tolerance tests (right) of control and fTreg KO mice in (d) young (12 weeks, control n=8; fTreg KO n=8), (e) aged (36–37 weeks, control n=8; fTreg KO n=9), and (f) obese (control n=9; fTreg KO n=10) cohorts. (g) Representative H&E staining of visceral adipose tissue (VAT, epididymal) from ~14 month old control (n=3) and fTreg KO mice (n=5) (scale bar, 50 μm). (h) Box and whisker plot of adipocyte size distribution in visceral adipose tissue from control (n=3) and fTreg KO mice (n=3) (~14 months old). (i) Ad libitum fed serum non-esterified fatty acid (NEFA) levels in ~14 months old control (n=9) and fTreg KO mice (n=10). (j) Serum resistin levels in ~14 month old fasted control and fTreg KO mice (n=4 pooled samples (2 mice per sample) per group). (k) Post-prandial glucose uptake in visceral adipose tissue of aged control (n=5) and fTreg KO mice (n=4). (l) Representative H&E staining of liver from ~14 month old control (n=3) and fTreg KO mice (n=5) (scale bar, 200 μm). (m) Hepatic triglyceride levels in ~14 month old control (n=5) and fTreg KO mice (n=3). (n) Fasting serum triglycerides in ~14 month old control (n=9) and fTreg KO mice (n=10). (o) fTregs, expressed as percentage of total CD45.2+ cells, in control (PBS) and IL2/anti-IL2 treated mice (n=3 mice per group). (p) Relative glucose uptake in VAT of 16 week old control and IL2/anti-IL2 treated mice (n=4 mice per group). Data represents mean ± s.e.m. *p<0.05, **p<0.01, ***p<0.001, ****p<0.0001.
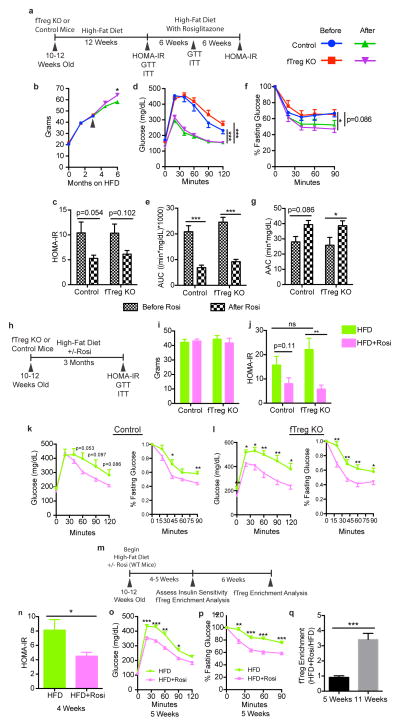
While fTregs were previously implicated in the insulin-sensitizing function of the PPARγ agonists thiazolidinediones (TZDs)15, in our studies fTreg KO mice display similar metabolic improvements to the TZD rosiglitazone (Rosi) as control mice. These beneficial effects of TZDs are evident with either direct treatment of obese mice (therapeutic intervention; Extended Data Fig. 6a–g) or prophylactic treatment (drug intervention coincident with HFD-feeding, Extended Data Fig. 6h–l). Additionally, we find that the insulin-sensitizing effects of Rosi precede the TZD-induced expansion of fTregs in HFD-fed mice (Extended Data Fig. 6m–q). While intercolony variation cannot be ruled out, our findings do not support a significant role for fTregs in the therapeutic mechanism of action of TZDs.
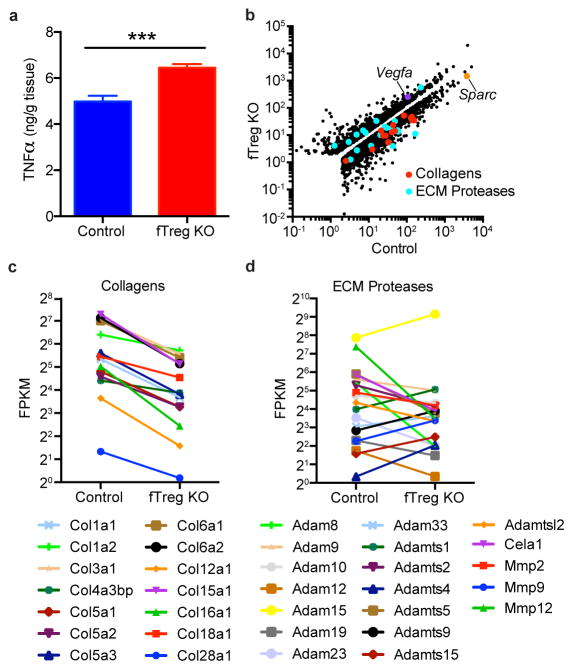
Histologically, aged fTreg KO VAT depots appear similar to control mice, and inflammatory processes such as macrophage crowning are observed at comparable frequencies (Fig. 3g, data not shown). However, aged fTreg KO VAT has increased levels of TNFα (Extended Data Fig. 7a), increased expression of Vegfa (implicated in adipose remodeling and insulin sensitivity17, Extended Data Fig. 7b), and decreased expression of extracellular matrix genes (including collagen VI implicated in adipose tissue rigidity18, and the wound response gene Sparc, Extended Data Fig. 7b,c) compared to control tissue. Accompanying these changes, multiple proteases involved in ECM remodeling and angiogenesis (members of the ADAM, ADAMTS, MMP, and CELA families) are differentially expressed (Extended Data Fig. 7b,d). Of note, adipocytes from aged fTreg KO mice are smaller than those in control mice (fTreg KO: ~70% <5,000 μm2, control: ~41% <5,000 μm2, Fig. 3h, Extended Data Fig. 4b), and serum non-esterified free fatty acid (NEFA) levels are reduced to almost half those of control mice; both indicators of improved insulin sensitivity (Fig. 3i). In addition, circulating levels of the adipokine resistin, which positively correlates with murine insulin resistance, are reduced in the aged fTreg KO mice (Fig. 3j)19, 20. Furthermore, aged fTreg KO mice present with decreased hepatic steatosis, as determined histologically and by decreased fasting hepatic and serum triglyceride content (Fig. 3l–n). In combination, these findings suggest that the loss of fTregs in adipose tissue alleviates many of the indications of age-associated IR in mice, a primary clinical manifestation of metabolic aging.
To more directly associate fTregs with age-associated IR, we measured basal glucose uptake in adipose tissue ex vivo. Notably, VAT from fTreg KO mice took up almost twice the amount of glucose as control tissue (Fig. 3k). Conversely, expansion of fTregs in WT mice via treatment with IL-2/IL-2 mAb complex treatment21 abrogates basal glucose uptake in VAT by ~50% (Fig. 3o,p). This inverse correlation between fTreg numbers and glucose uptake in adipose tissue supports a causal association between fTregs and IR during aging.
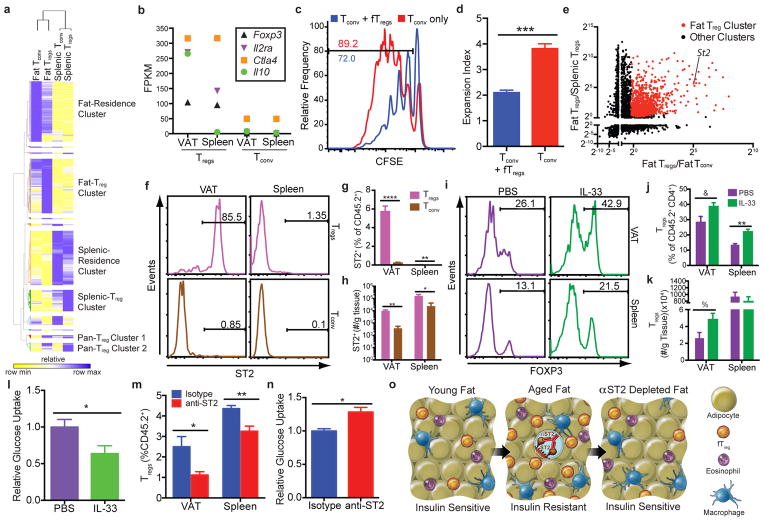
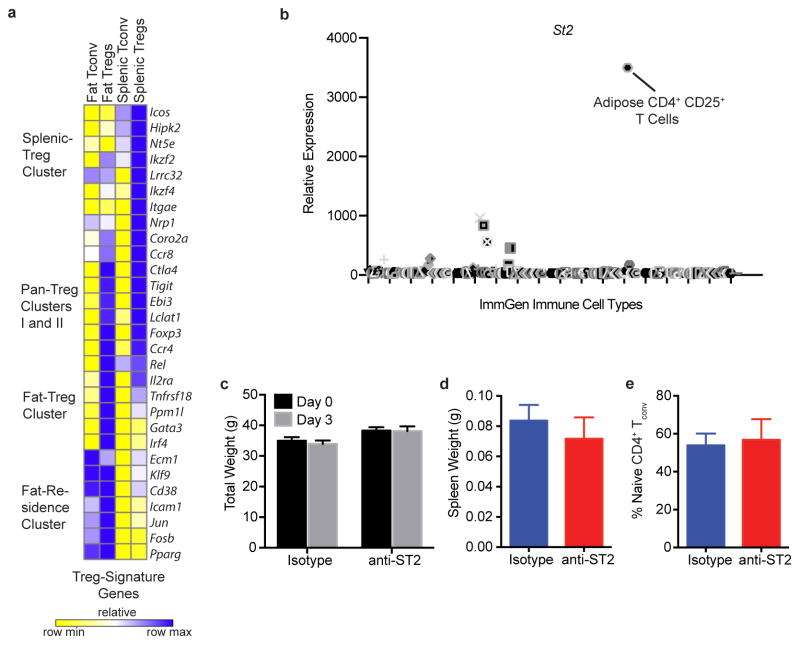
Our findings of an association between fTregs and age-associated IR and metabolic aging suggest that these cells are functionally distinct from splenic Tregs. To investigate this notion, we compared the transcriptomes of Tregs, as well as conventional CD4+ T (Tconv) cells, isolated from VAT and spleen. Comparative analyses revealed that while certain canonical genes are similarly expressed (e.g. Foxp3, Ctla4, and Tigit), VAT and splenic Tregs have discrete expression signatures, consistent with the suggested functional distinction. In particular, Pparγ, Gata3, and Irf4 are selectively enriched in VAT but not splenic Tregs22 (Extended Data Fig. 8a). Furthermore, unbiased comparative gene expression analyses combined with hierarchical clustering defined extensive Fat- and Splenic-Residence Clusters (1142 genes and 1431 genes, respectively) relative to much smaller Pan-Treg Clusters 1 and 2 (56 and 162 genes, respectively). Transcriptionally, fTregs cluster more closely with fat Tconv cells than splenic Tregs (Fig. 4a), suggesting that the functional specification of fTregs is informed by their anatomical location within adipose tissue, as well as the expression of the Treg lineage-specifying transcription factor Foxp323,24 (Fig. 4b). Importantly, aged fTregs maintain their suppressive functionality as measured by in vitro suppression assays (Fig. 4c,d), and indicated by the high expression levels of Ctla425, Il2ra26, and the anti-inflammatory cytokine Il10 (Fig. 4b). We posit that the transcriptional differences between fTregs and splenic Tregs (found in the fTreg cluster of 1049 genes) may provide a therapeutic avenue to selectively manipulate fTreg populations. The IL-33 receptor ST2, which lies within the fTreg cluster, has been recently implicated in effector Treg and in particular fTreg development27,28. Indeed, ST2 was ~60 and ~30 times more highly expressed in fTregs compared to splenic Tregs and fat Tconv cells, respectively, consistent with the ImmGen database (http://www.immgen.org), (Fig. 4e, Extended Data Fig. 8b). Flow cytometry confirmed that ST2 is expressed on the cell surface of the majority of fTregs, but on relatively few fat Tconv, or splenic Treg or Tconv cells (Fig. 4f,g). Furthermore, VAT has ~25x more ST2+ fTregs than ST2+ fat Tconv; a similarly trending ~10x difference is observed in the spleen (Fig. 4h).
Figure 4. fTreg depletion improves adipose glucose uptake.
(a) Hierarchical clustering of differentially expressed genes between fat Tregs and Tconv and splenic Tregs and Tconv cells from Foxp3-Thy1.1 mice (47 weeks, cells pooled from 3 to 4 mice, same data set used in b,e). (b) FPKM values of selected genes important for Treg identity and canonical suppressive function. (c–d) In vitro suppression assay of fTregs (fTregs pooled from retired breeders, added at 1:1 ratio with splenic conventional T cells, conducted in triplicates). (c) Representative CFSE tracings of conventional T cells with or without fTregs. Gating indicates percentage of dividing cells. (d) Expansion index of Tconv cells. (e) Fold change in expression levels of differentially expressed genes across fat Tregs and Tconv and splenic Tregs and Tconv cells. Fat Treg cluster genes are labeled in red. Position of ST2 is marked. (f) Representative FACS analysis and (g) quantification of ST2 expression in CD4+ T cells from aged mice (45 weeks, n=5 mice). (h) Total number of ST2+ Tregs and Tconv cells per gram of tissue in VAT and spleen (n=5 mice). (i) FACS histograms and (j) quantification of Tregs (%Foxp3+ of CD45+ CD4+ population) and (k) cells per gram of tissue in VAT and spleen after IL-33 or PBS treatment (16 weeks, n=5 mice per group). (l) Ex vivo glucose uptake in VAT from wild type mice after control or IL-33 treatment (16 week old, n=5 mice per group). (m) Quantification of fTregs and splenic Tregs (%Foxp3+ of CD45+ population) and (n) ex vivo insulin-stimulated glucose uptake in VAT from wild type mice after anti-ST2 depleting antibody or isotype control treatment (~45 weeks old, n=4 mice per group). (o) Adipo-immune model of metabolic aging. Data represents mean ± s.e.m. *p<0.05, **p<0.01, &p=0.053, %p=0.056.
To explore the therapeutic potential of the IL-33/ST2 signaling pathway, aged mice were initially injected with IL-33 (0.5 μg i.p. on days 0, 2, 4, analysis on day 6) to expand the fTreg population (Fig. 4i–k). In agreement with fTreg expansion driven by IL2/anti-IL2 treatment, mice injected with IL-33 display signs of IR (basal glucose uptake in VAT reduced to ~60% of control mice, Fig. 4l). In the converse approach, acute treatment with an anti-ST2 antibody (200 μg/mouse i.p. on days 0 and 2, analysis on day 3) is able to significantly deplete fTregs (~50% reduction), with a smaller percentage reduction of splenic Tregs (Fig. 4m). Importantly, the partial depletion of fTregs achieved with acute anti-ST2 treatment coincides with an increase in insulin-stimulated glucose uptake in VAT (~25% increase in glucose uptake compared to control treated mice, Fig. 4n), suggesting a link between fTreg depletion and increased adipose insulin sensitivity. Furthermore, this increase in insulin sensitivity is achieved without any signs of Tconv cell activation associated with systemic Treg dysfunction (Extended Data Fig. 8c–e).
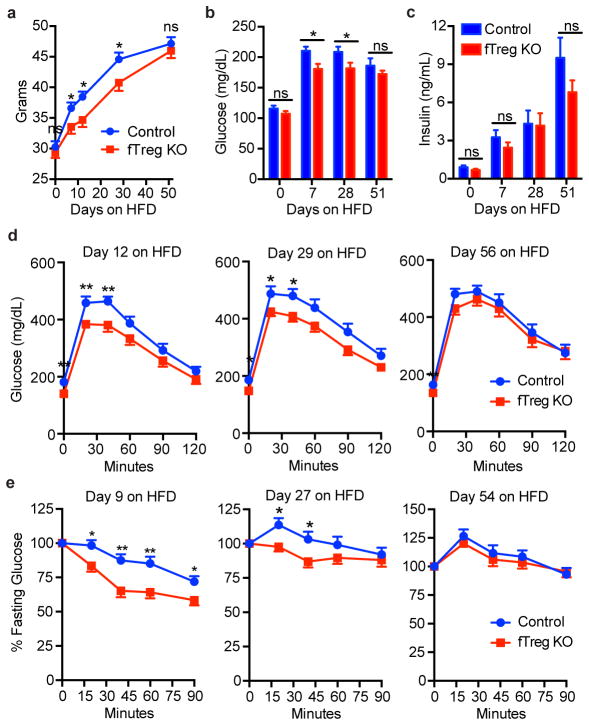
As obesity and aging often associate in man, we challenged aged fTreg KO and control mice with HFD. While initially protected against HFD-induced weight gain and associated metabolic dysregulation, the metabolic benefits attributed to the loss of fTregs were progressively lost over 8 weeks (Extended Data Fig. 9a–e), further suggesting distinct pathophysiologies drive obesity- versus age-associated IR.
Taken together, our data provide evidence that distinct adipo-immune populations orchestrate unique features of age- and obesity-associated IR. We show in the non-obese setting that Pparγ-positive fTregs accumulate to unusually high levels (6.7%) as a function of age, exacerbating both the decline of adipose metabolic function as well as the rise in insulin resistance (Fig. 4o). These results are in marked contrast to the increased role of M1 ATMs in metabolic dysfunction linked to obesity, coupled with a suppression of fTreg levels to 0.9%. Thus, these studies highlight contrasting roles of the immune compartment in contributing to key aspects of adipose health and disease.
Given the classical immune suppressive and anti-inflammatory nature of Tregs, we speculate that the chronic inflammatory processes that drive obesity-associated IR seem unlikely to be driving age-associated IR. Indeed, there is increasing appreciation that maintaining a certain degree of inflammation is beneficial for adipose tissue remodeling and its metabolic function29. Failure to preserve an optimal immune state in the aged adipose tissue may directly contribute to metabolic disorders such as insulin resistance and age-associated diabetes. We suggest Type IV diabetes as a designation for non-obese dependent fTreg driven metabolic disease of the elderly.
In this context, it is of particular significance that fTregs in aged adipose tissue express the cytokine receptor ST2 at ~30–60 fold higher levels than in other sites such as spleen, making the fTreg population sensitive to depletion via anti-ST2 treatment. While ST2 has been implicated in other physiological processes and immune cell types that may also impact glucose homeostasis, this simple fTreg depletion approach increases adipose tissue insulin sensitivity suggesting the potential of selective fTreg depletion therapy in the prevention of age-related insulin resistance.
Methods
Full Methods and associated references are available in the online version of the paper at www.nature.com/nature.
Online Methods
Mice
All mice were housed in the specific pathogen-free facilities at The Salk Institute for Biological Studies or purchased from Taconic Biosciences. C57BL/6NTac mice were purchased from Taconic Biosciences for comparative adipo-immune profiling (AIP). Age-matched retired breeders were purchased for AIP of aged adipose tissue, and diet-induced obese C57BL/6NTac mice were purchased for profiling of obese adipose tissue. fTreg KO mice were generated by crossing Foxp3 YFP/cre (30) and Pparg floxed (31) mice. We utilized the Foxp3Thy1.1 (32) reporter mice when isolating Tregs and conventional CD4+ T cells from spleen and fat for subsequent RNA-Seq analysis. Mice within The Salk Institute for Biological Studies received autoclaved normal chow (MI laboratory rodent diet 5001, Harlan Teklad), irradiated HFD (60 kcal% fat, Research Diets), or irradiated HFD with Rosi (30mg/kg of food, Research Diets). All mice used for studies were male. All procedures involving animals were performed in accordance with protocols approved by the IACUC and Animal Resources Department (ARD) of the Salk Institute for Biological Studies.
Adipo-immune profiling (AIP)
Visceral (epididymal) and subcutaneous (inguinal) adipose depots were dissected from mice after 10mL PBS perfusion through the left ventricle. Inguinal lymph nodes resident in inguinal adipose tissue were removed. Adipose tissue was minced into fine pieces (2–5mm3) and digested in stromal vascular isolation buffer (100mM HEPES pH7.4, 120mM NaCl, 50mM KCl, 5mM glucose, 1mM CaCl2, 1.5% BSA) containing 1mg/ml collagenase at 37°C with intermittent shaking for 1.5 hours. The suspension was then passed through a 100 μm mesh to remove undigested clumps and debris. The flowthrough was allowed to stand for 10 min to separate the floating adipocyte fraction and infranatant containing the stromal vascular fraction. The infranatant was removed while minimally disturbing the floating adipocyte fraction and centrifuged at 400g for 10 minutes. The pellet containing the stromal vascular fraction was washed once in 10mL RPMI. The resultant isolated cells were subjected to FACS analysis. The following antibodies were used to assemble the adipo-immune profile: BioLegend - CD45.2 (104), CD44 (IM7), CD62L (MEL-14), TCRg/d (GL3), CD19 (6D5), CD25 (PC61), CD206 (C068C2), CD301 (LOM-14); eBioscience - CD3 (145-2C11), CD25 (PC61), CD4 (RM4-5), TCRb (H57-597), B220 (RA3-6B2), NK1.1 (PK136), CD49b (DX5), Foxp3 (FJK-16s), F4/80 (BM8), CD11c (N418), CD11b (M1/70); Tonbo biosciences - F4/80 (BM8.1), CD4 (RM4-5), CD44 (IM7), CD62L (MEL-14), Ly6G (RB6-8C5); BD Pharmingen - Siglec-F (E50-2440); BD Biosciences - CD8a (53–6.7). Cells were analyzed using the BD FACSAria instrument (Becton Dickinson) and FlowJo software (tree Star).
Body composition and adipocyte size analyses
Body composition was measured with an Echo MRI-100 body composition analyzer (Echo Medical Systems). VAT (epididymal) was dissected, and the wet weight was determined. Adipose tissues were fixed in 10% formalin, sectioned, and stained in hematoxylin and eosin. An adipocyte cross-sectional area was determined from photomicrographs of VAT using ImageJ.
In vivo metabolic phenotype analysis
Real-time metabolic analyses were conducted in a Comprehensive Lab Animal Monitoring System (Columbus Instruments). CO2 production, O2 consumption, and ambulatory counts were determined for at least three consecutive days and nights after at least 24 h for adaptation before data recording.
Principal component analysis (PCA) of AIP
Non-macrophage immune cell populations, described as percentage of the total CD45.2+ immune compartment, were inputted into MetaboAnalyst 3.0 (http://www.metaboanalyst.ca/MetaboAnalyst/) for PCA. No normalizations, transformations, or scalings were implemented.
Glucose homeostasis studies
Fasting was induced for 6 h, except for GTTs, which were conducted after overnight fasting. Glucose (1–2 g/kg, i.p.) and insulin (0.5–1.0 U/kg, i.p.) was injected for GTTs and ITTs, respectively. Blood glucose was monitored using a Nova Max Plus glucometer.
Histological analyses
Sections (4 μm) of fixed tissues were stained with haematoxylin and eosin according to standard procedures. Histopathological scores were graded on blinded samples for severity and extent of inflammation and morphological changes by a pathologist.
Serum analyses
Blood was collected by tail bleeding or right atrial puncture. Non-esterified fatty acids (Wako) and triglycerides (Thermo) were measured using colorimetric methods. Serum insulin levels (Ultra Sensitive Insulin, Crystal Chem) were measured by ELISAs. Serum cytokine and metabolic hormone levels were analyzed by the Luminex Bio-Plex system using the Mouse Cytokine 23-Plex Panel and Diabetes Panel, respectively, as according to the manufacturer’s instructions (Bio-Rad).
Core body temperature
Mice were single housed, and core body temperature was measured with a clinical rectal thermometer (Thermalert model TH-5; Physitemp) during the middle of the light cycle. The probe was dipped in a room temperature lubricating glycerol before insertion.
Ex vivo 2-DG uptake assays
Adipose tissue was dissected from mouse, cut into small pieces with scissors, washed and incubated for 30 min with Krebs-Ringer Bicarbonate HEPES buffer (KRBH, 120 mM NaCl, 4 mM KH2PO4, 1 mM MgSO4, 0.75 mM CaCl2, 30 mM Hepes, 10 mM NaHCO3, pH 7.4, supplemented with 1% fatty-acid free BSA). For determination of exogenous insulin-stimulated 2-deoxy-D-glucose (2-DG) uptake, adipose was incubated in KRBH with 100–200nM insulin for 20 mins in 37 °C. Cold 2-DG and hot 2-DG-1,2-3H(N) was added to incubated adipose tissue such that the final concentration of cold 2-DG was 0.1 mM and final quantity of hot 2-DG-1,2-3H(N) was 0.1 μCi (assuming total reaction volume ~400 uL). Adipose was further incubated 20 mins in 37 °C, then washed three times with PBS before being lysed by scintillation fluid. 2-DG uptake was determined by measuring scintillation counts normalized to adipose tissue mass utilized for assay. Non-specific 2-DG uptake levels were determined by co-treating adipose tissue with cytochalasin B (0.1 μM final concentration) with the addition of cold and hot 2-DG.
IL-2-anti-IL-2 complex and IL-33 injections
IL-2-anti-IL-2 complexes were prepared by incubating 2 μg of murine IL-2 (Biolegend) with 10 μg of anti-IL-2 antibody (JES6.1, Bioxcell) in a total volume of 200 μL of PBS for 30 min at 37°C (amounts given per injection). Mice were injected i.p. three times (days 0,1, 2) and analyzed on day 8. For IL-33 expansion assays, mice were injected i.p. with 0.5 μg of recombinant murine IL-33 in PBS (R&D systems) three times (days 0, 2, 4) and analyzed on day 6. PBS was used for control injections.
RNA-Seq library generation
Total RNA was isolated from sorted cells or whole tissues using TRIzol reagent (Invitrogen) as per the manufacturer’s instructions and treated with DNaseI (Qiagen) for 30 min at 22 °C. Sequencing libraries were prepared from 10–100 ng of total RNA using the TruSeq RNA sample preparation kit v2 (Illumina) according to the manufacturer’s protocol. Briefly, mRNA was purified, fragmented and used for first- and second-strand cDNA synthesis followed by adenylation of 3′ ends. Samples were ligated to unique adaptors and subjected to PCR amplification. Libraries were then validated using the 2100 BioAnalyzer (Agilent), normalized and pooled for sequencing. RNA-Seq libraries prepared from two biological replicates for each experimental condition were sequenced on the Illumina HiSeq 2500 using barcoded multiplexing and a 100-bp read length.
High-throughput sequencing and analysis
Image analysis and base calling were done with Illumina CASAVA-1.8.2. This yielded a median of 29.9M usable reads per sample. Short read sequences were mapped to a UCSC mm9 reference sequence using the RNA-Seq aligner STAR33. Known splice junctions from mm9 were supplied to the aligner and de novo junction discovery was also permitted. Differential gene expression analysis, statistical testing and annotation were performed using Cuffdiff 234. Transcript expression was calculated as gene-level relative abundance in fragments per kilobase of exon model per million mapped fragments and employed correction for transcript abundance bias35. RNA-Seq results for genes of interest were also explored visually using the UCSC Genome Browser.
Hierarchical clustering
Differentially expressed gene names and corresponding FPKM values across samples were inputted into GENE-E (Broad Institute) for hierarchical clustering analysis (implemented one minus pearson correlation for sample and gene distance metrics and the average linkage method) and visualization. Gene cluster names were created to describe the gene expression characteristics within each cluster (i.e. Fat-Residence Cluster refers to the gene cluster whose genes are expressed at greater levels in T cells residing in fat. Fat-Treg Cluster refers to the gene cluster whose genes are expressed highest in only the fTregs).
In vitro suppression assay
fTregs were isolated from aged wt mice treated with IL-2/anti-IL-2 complexes to expand fTreg numbers, as described above with isolation conducted on day 6. Stromal vascular fractions (SVFs) were isolated from visceral adipose tissues as described above, and fTregs were sorted from SVFs using the BD FACSAria instrument (Becton Dickinson), gating on CD45.2+ CD4+ CD25+ cells. CD45.1+ mice were sacrificed to isolate splenic responder T cells, which were purified by positive selection using CD4-specific Dynabeads (Invitrogen), followed by sorting on a BD FACSAria cell sorter, gating on CD45.1+ CD4+ CD25− CD62Lhi CD44lo cells. Antigen-presenting cells were prepared from wild-type B6 splenocytes by T-cell depletion using Thy1-specific MACS beads. CFSE labeled effector T cells (5 ×10⁴ cells well−1) were co-cultured with fTregs at the indicated ratio in the presence of irradiated (30 Gy) antigen-presenting cells (1 × 10⁵ cells well−1) in 96-well plates in complete RPMI1640 medium supplemented with 10% FBS and CD3 antibody (1 μg ml−1). Cell proliferation and expansion index were determined 96h later using the BD FACSAria instrument and analyzed with the FlowJo software package (Tree Star).
ST2 studies and anti-ST2 depleting antibody treatment
Antibody for ST2 FACS analysis was purchased from MD Bioproducts, clone DJ8. For fTreg depletion, mice were injected i.p. with 200 μg anti-ST2 antibodies36 (R&D systems, clone 245707) or isotype control (Bioxcell) twice (days 0, 2) and sacrificed for analysis on day 3.
Statistical analyses
Statistical analyses were performed with Prism 6.0 (GraphPad). p values were calculated using two-tailed unpaired or paired Student’s t test. When analyzing adipo-immune profiles, we utilized a false discovery rate approach to avoid the problem of an inflated false-positive rate due to the substantial number of hypothesis tests. Mice cohort size was designed to be sufficient to enable statistical significance to be accurately determined. When applicable, mice were randomly assigned to treatment or control groups. No animals were excluded from the statistical analysis, with the exception of exclusions due to technical errors, and the investigators were not blinded in the studies. Appropriate statistical analyses were applied, assuming a normal sample distribution, as specified in the figure legends. No estimate of variance was made between each group. All in vivo metabolic and glucose homeostasis experiments, ex vivo glucose uptake experiments, and adipo-immune profiling experiments were conducted with at least two independent cohorts. RNA-Seq experiments, Luminex profiling, and histological analyses were conducted using multiple biological samples (as indicated in figure legends) from indicated cohorts.
Extended Data
Extended Data Figure 1.
Schematic outlining study premise and selected gating strategies used to generate adipo-immune profiles. (a) Schematic outlining study premise. (b–d) Adipo-immune profiles were generated through the use of several distinct antibody cocktails. Here using Foxp3YFP-Cre reporter mice we show how the stromal vascular fraction of VAT was analyzed by flow cytometry to identify several T cell subtypes (b), macrophage subsets (c), and eosinophils and neutrophils (d).
Extended Data Figure 2.
Adipo-immune profiles of aged fTreg KO and control mice in VAT, SAT, and spleen. (a) Adipo-immune profiles of aged (~14 months old) fTreg KO and control male mice depicting immune cell abundance, expressed as percentage of CD45.2+ cells. Entirety of immune compartment (top) is further divided into pan-macrophage (middle) and non-macrophage (bottom) pie charts (n=9 mice per group). (b–d) Immune cell abundance between fTreg KO and control mice, expressed as cells per gram of VAT (b), SAT (c), and spleen (d) (n=9 mice per group). Data represents mean ± s.e.m. #, false discovery rate < 2%.
Extended Data Figure 3.
Aged fTreg KO mice do not show signs of systemic autoimmunity or breakdown in peripheral tolerance. (a) Percentage of splenic naive CD4+ T cells as defined by CD62hi CD44lo relative to total CD4+ Foxp3YFP-Cre− CD25− population (n=9 mice per group). (b) Representative histology of gastrointestinal tract — duodenum, jejunum, ileum, colon (left to right). (n=3 mice per group). There were no significant lesions observed or differences in inflammation, epithelial changes, or mucosal architecture between the two groups (H&E, x100, scale bar 50 μm). (c) Histopathology score in the small intestine and colon of fTreg KO and control mice. The severity and extent of inflammation and epithelial changes as well as mucosal architecture were each graded on a score of 1 (minimal) to 5 (severe) and added to obtain an overall score over 20. There were minimal inflammatory changes with no significant differences between groups. (d) Multiplex inflammation panel of serum from fTreg KO and control mice (n=4 pooled samples (3 mice per sample) per group). Data represents mean ± s.e.m. *p<0.05, ***p<0.001.
Extended Data Figure 4.
Weight-matched cohorts’ body weights and adipocyte size frequency in VAT of aged control and fTreg KO mice. (a) Body weights of fTreg KO and control male mice used in weight-matched metabolic studies in young (12 week old; control n=9; fTreg KO n=9), aged (36 week old; control, n=9 mice; fTreg KO, n=11 mice), and obese (DIO, 12 weeks of HFD starting at 12 weeks old; control n=10; fTreg KO n=10) settings. (b) Frequency of small (0–5,000 μm2), medium (5,000–10,000 μm2), and large (>10,000 μm2) adipocytes in VAT of aged control and fTreg KO mice (n=3 mice per group, 850 adipocytes counted from control mice, 269 adipocytes counted from fTreg KO adipose). Data represents mean ± s.e.m.
Extended Data Figure 5.
VAT adipo-immune profiles of obese fTreg KO and control mice. (a) Adipo-immune profiles of diet-induced obese (16 weeks high fat diet started at 12 weeks of age) control (n=6 mice) and fTreg KO (n=8 mice) male mice depicting immune cell abundance, expressed as percentage of CD45.2+ cells. Entirety of immune compartment (top) is further divided into pan-macrophage (middle) and non-macrophage (bottom) pie charts. (b) Immune cell abundance between fTreg KO and control mice, expressed as cells per gram of VAT (n=9 mice per group). Data represents mean ± s.e.m.
Extended Data Figure 6.
fTregs are dispensable for TZDs to exert their therapeutic insulin-sensitizing effect. (a) Scheme used for longitudinal interventional study of control and fTreg KO mice which indicates when particular assays were conducted and whose results are described in panels (b–g) where rosiglitazone (Rosi) was introduced in diet after firmly establishing obesity with high-fat diet (HFD) alone for 3 months (n=8 mice per group). (b) Cohort weights during course of study. Black arrow indicates time when Rosi was introduced into diet. (c) Homeostatic model assessment of insulin resistance (HOMA-IR). (d–e) GTT (d) and glucose excursions of GTT (e) described as Area Under Curve (AUC). (f–g) ITT (f) and bar-graph quantitation of relative serum glucose decrease during ITT (g) described as Area Above Curve (AAC). (h) Scheme used for parallel prophylactic study of control and fTreg KO mice whose results are described in panels (i–l) where mice were placed on HFD for 3 months or HFD with Rosi for 3 months (n=8 mice per group). (i) Cohort weights at end of study. (j) HOMA-IR. (k–l) GTT and ITT of control (k) or fTreg KO (l) mice fed HFD or HFD with Rosi. (m) Scheme used to determine temporal relationship of TZD-induced fTreg expansion and TZD-induced insulin-sensitization in wild-type mice whose results are described in panels (n–q) where mice were fed HFD or HFD with Rosi for up to 11 weeks (n=10 mice per group, 5 mice of each group were sacrificed at 5 weeks after diet introduction and remaining 5 mice were sacrificed at 11 weeks). (n) HOMA-IR at 4 weeks. (o) GTT at 5 weeks. (p) ITT at 5 weeks. (q) Relative fTreg enrichment of mice fed HFD with Rosi versus mice fed HFD alone at 5 weeks and 11 weeks. Data represents mean ± s.e.m. *p<0.05, **p<0.01, ***p<0.001.
Extended Data Figure 7.
Increased TNFα levels and gene expression pattern of aged fTreg KO adipose tissue is consistent with an improved adipose remodeling capacity. (a) TNFα levels quantified by enzyme linked immunosorbent assay (ELISA) of whole adipose lysate (~40 weeks old, n=6 per group). (b–d) FPKM values of all differentially expressed genes (b), differentially expressed collagens (c), and differentially expressed ECM proteases (d) in VAT from aged fTreg KO and control mice (~40 weeks old, n=3 mice per group). Data represents mean ± s.e.m. ***p<0.001.
Extended Data Figure 8.
fTreg gene expression and depletion with anti-ST2 antibody treatment. (a) Expression of several canonical Treg genes across fat and splenic Tregs and fat and splenic Tconv cells. Cells were pooled from 3 and 4 mice before isolating RNA for subsequent RNA-Seq analysis. (b) Expression of ST2 across all hematopoietic cells catalogued in the ImmGen database. Position of adipose CD4+ CD25+ T cells is marked. (c) Total weight before beginning course of anti-ST2 or isotype control antibodies (Day 0) and upon terminal analysis (Day 3). Spleen weight (d) and percentage of splenic naive CD4+ T cells as defined by CD62hi CD44lo relative to total splenic CD45+ CD4+ CD25− T cell population (e) of mice upon terminal analysis (Day 3, n=4 mice per group). Data represents mean ± s.e.m.
Extended Data Figure 9.
Aged fTreg KO mice are resistant to short-term, but not persistent, HFD-induced weight gain and insulin resistance. (a–e) Aged control and fTreg KO mice were placed on HFD and monitored throughout course of diet for weight (a), fasting glucose levels (b), fasting serum insulin levels (c), performance on GTT (d), and ITT (e). (Control, n=10; fTreg KO, n=11; Mice were aged 27–29 weeks and weight-matched before HFD was introduced.) Data represents mean ± s.e.m. ns – non-significant, *p<0.05, **p<0.01.
Extended Data Table 1.
Table outlining the antibodies used to molecularly identify the given immune cell type.
| Immune Cell Type | Molecular Identification Scheme |
|---|---|
| TCRγδ | CD45.2+ F4/80− CD3+ TCRb− TCRγ+ |
| CD8+ | CD45.2+ F4/80− CD3+ TCRb+ CD4− CD8+ |
| Treg CD4+ | CD45.2+ CD4+ CD25+ Foxp3+ |
| Naive CD4+ | CD45.2+ CD4+ CD25− Foxp3− CD62Lhi CD44lo |
| Activated CD4+ | CD45.2+ CD4+ CD25− Foxp3− CD62Llo CD44hi |
| NKT | CD45.2+NK1.1+TCRb+ |
| NK | CD45.2+NK1.1+TCRb− |
| B | CD45.2+NK1.1− CD19+ |
| Eosinophil | CD45.2+ F4/80+ Siglec-F+ |
| Neutrophil | CD45.2+ F4/80− CD11c− CD11b+ Ly6G+ |
| M2 ATM | CD45.2+ F4/80+ CD11cmed CD206+ |
| M1 ATM | CD45.2+ F4/80− CD11chi CD206− |
| DN (Double-negative) ATM | CD45.2+ F4/80+ CD11C− CD206− |
Acknowledgments
We would like to thank L. Chong, J. Alvarez, Y. Dai, S. Kaufman, and B. Collins for technical assistance, L. Ong and C. Brondos for administrative assistance, and J. Simon for assistance with graphics. S.P.B. is supported by National Institutes of Health (NIH) grants (F30 DK096828 and T32 GM007198). C.L. and M.D. are funded by grants from the National Health and Medical Research Council of Australia Project Grants 512354, 632886 and 1043199. R.M.E. is an Investigator of the Howard Hughes Medical Institute (HHMI) at the Salk Institute and March of Dimes Chair in Molecular and Developmental Biology, and is supported by National Institutes of Health (NIH) grants (DK057978, DK090962, HL088093, HL105278 and ES010337), the Glenn Foundation for Medical Research, the Leona M. and Harry B. Helmsley Charitable Trust, Ipsen/Biomeasure, California Institute for Regenerative Medicine and The Ellison Medical Foundation. Y.Z. is supported by the Nomis Foundation, the Rita Allen Foundation, the Emerald Foundation, the Hearst Foundation, the National Multiple Sclerosis Society, and National Institute of Health (AI099295, AI107027). This work was also supported by National Cancer Institute funded Salk Institute Cancer Center core facilities (CA014195) and the James B. Pendleton Charitable Trust.
Footnotes
Author Contributions S.P.B., J.M.S., M.D., R.M.E. and Y. Zheng designed and supervised the research. S.P.B., J.M.S., S.F., S.L., Y. Zhang, A.C., C.Z., and Y.L. performed research. S.P.B., J.M.S., M.L., C.L., A.R.A., R.T.Y., M.D., R.M.E. and Y. Zheng analysed data. S.P.B., J.M.S., S.L., A.R.A., R.T.Y., M.D., R.M.E. and Y. Zheng wrote the manuscript.
RNA-Seq data can be accessed in the NCBI Sequence Read Archive under the accession SRP053799.
SB, RME, YZ and MD are co-inventors of technologies related to methods of using Fat Tregs to prevent Insulin Resistance.
References
- 1.Ferrante AW., Jr Macrophages fat and the emergence of immunometabolism. J Clin Invest. 2013;123:4992–4993. doi: 10.1172/JCI73658. [DOI] [PMC free article] [PubMed] [Google Scholar]
- 2.Lumeng CN, Saltiel AR. Inflammatory links between obesity and metabolic disease. J Clin Invest. 2011;121:2111–2117. doi: 10.1172/JCI57132. [DOI] [PMC free article] [PubMed] [Google Scholar]
- 3.Mathis D. Immunological Goings-on in Visceral Adipose Tissue. Cell Metab. 2013;17:851–859. doi: 10.1016/j.cmet.2013.05.008. [DOI] [PMC free article] [PubMed] [Google Scholar]
- 4.Osborn O, Olefsky JM. The cellular and signaling networkslinking the immune system andmetabolism in disease. Nat Med. 2012;18:363–374. doi: 10.1038/nm.2627. [DOI] [PubMed] [Google Scholar]
- 5.Weisberg SP, et al. Obesity is associated with macrophage accumulation in adipose tissue. J Clin Invest. 2003;112:1796–1808. doi: 10.1172/JCI19246. [DOI] [PMC free article] [PubMed] [Google Scholar]
- 6.Xu H. Chronic inflammation in fat plays a crucial role in the development of obesity-related insulin resistance. J Clin Invest. 2003;112:1821–1830. doi: 10.1172/JCI19451. [DOI] [PMC free article] [PubMed] [Google Scholar]
- 7.CDC. National Diabetes Statistics Report, 2014. 2015. pp. 1–12. [Google Scholar]
- 8.Wu D, et al. Eosinophils sustain adipose alternatively activated macrophages associated with glucose homeostasis. Science. 2011;332:243–247. doi: 10.1126/science.1201475. [DOI] [PMC free article] [PubMed] [Google Scholar]
- 9.Qiu Y, et al. Eosinophils and Type 2 Cytokine Signaling in Macrophages Orchestrate Development of Functional Beige Fat. Cell. 2014;157:1292–1308. doi: 10.1016/j.cell.2014.03.066. [DOI] [PMC free article] [PubMed] [Google Scholar]
- 10.Rao RR, et al. Meteorin-like Is a Hormone that Regulates Immune-Adipose Interactions to Increase Beige Fat Thermogenesis. Cell. 2014;157:1279–1291. doi: 10.1016/j.cell.2014.03.065. [DOI] [PMC free article] [PubMed] [Google Scholar]
- 11.Odegaard JI, et al. Macrophage-specific PPARgamma controls alternative activation and improves insulin resistance. Nature. 2007;447:1116–1120. doi: 10.1038/nature05894. [DOI] [PMC free article] [PubMed] [Google Scholar]
- 12.Fujisaka S, et al. Regulatory Mechanisms for Adipose Tissue M1 and M2 Macrophages in Diet-Induced Obese Mice. Diabetes. 2009;58:2574–2582. doi: 10.2337/db08-1475. [DOI] [PMC free article] [PubMed] [Google Scholar]
- 13.Feuerer M, et al. Lean, but not obese, fat is enriched for a unique population of regulatory T cells that affect metabolic parameters. Nat Med. 2009;15:930–939. doi: 10.1038/nm.2002. [DOI] [PMC free article] [PubMed] [Google Scholar]
- 14.Lumeng CN, et al. Aging Is Associated with an Increase in T Cells and Inflammatory Macrophages in Visceral Adipose Tissue. The Journal of Immunology. 2011;187:6208–6216. doi: 10.4049/jimmunol.1102188. [DOI] [PMC free article] [PubMed] [Google Scholar]
- 15.Cipolletta D, et al. PPAR-γ is a major driver of the accumulation and phenotype of adipose tissue Treg cells. Nature. 2012;486:549–553. doi: 10.1038/nature11132. [DOI] [PMC free article] [PubMed] [Google Scholar]
- 16.Houtkooper RH, et al. The metabolic footprint of aging in mice. Sci Rep. 2011;1 doi: 10.1038/srep00134. [DOI] [PMC free article] [PubMed] [Google Scholar]
- 17.Sun K, et al. Dichotomous effects of VEGF-A on adipose tissue dysfunction. PNAS. 2012;109:5874–5879. doi: 10.1073/pnas.1200447109. [DOI] [PMC free article] [PubMed] [Google Scholar]
- 18.Khan T, et al. Metabolic dysregulation and adipose tissue fibrosis: role of collagen VI. Mol Cell Biol. 2009;29:1575–1591. doi: 10.1128/MCB.01300-08. [DOI] [PMC free article] [PubMed] [Google Scholar]
- 19.Steppan CM, et al. The hormone resistin links obesity to diabetes. Nature. 2001;409:307–312. doi: 10.1038/35053000. [DOI] [PubMed] [Google Scholar]
- 20.Schwartz DR, Lazar MA. Human resistin: found in translation from mouse to man. Trends Endocrinol Metab. 2011;22:259–265. doi: 10.1016/j.tem.2011.03.005. [DOI] [PMC free article] [PubMed] [Google Scholar]
- 21.Webster KE, et al. In vivo expansion of T reg cells with IL-2-mAb complexes: induction of resistance to EAE and long-term acceptance of islet allografts without immunosuppression. J Exp Med. 2009;206:751–760. doi: 10.1084/jem.20082824. [DOI] [PMC free article] [PubMed] [Google Scholar]
- 22.Feuerer M, et al. Genomic definition of multiple ex vivo regulatory T cell subphenotypes. PNAS. 2010;107:5919–5924. doi: 10.1073/pnas.1002006107. [DOI] [PMC free article] [PubMed] [Google Scholar]
- 23.Josefowicz SZ, Lu LF, Rudensky AY. Regulatory T cells: mechanisms of differentiation and function. Annu Rev Immunol. 2012;30:531–564. doi: 10.1146/annurev.immunol.25.022106.141623. [DOI] [PMC free article] [PubMed] [Google Scholar]
- 24.Ohkura N, Kitagawa Y, Sakaguchi S. Development and Maintenance of Regulatory T cells. Immunity. 2013;38:414–423. doi: 10.1016/j.immuni.2013.03.002. [DOI] [PubMed] [Google Scholar]
- 25.Wing K, et al. CTLA-4 Control over Foxp3+ Regulatory T Cell Function. Science. 2008;322:271–275. doi: 10.1126/science.1160062. [DOI] [PubMed] [Google Scholar]
- 26.Fontenot J, et al. A function for interleukin 2 in Foxp3-expressing regulatory T cells. Nat Immunol. 2005;6:1142–1151. doi: 10.1038/ni1263. [DOI] [PubMed] [Google Scholar]
- 27.Vasanthakumar A, et al. The transcriptional regulators IRF4, BATF and IL-33 orchestrate development and maintenance of adipose tissue–resident regulatory T cells. Nat Immunol. 2015;16:276–285. doi: 10.1038/ni.3085. [DOI] [PubMed] [Google Scholar]
- 28.Schiering C, et al. The alarmin IL-33 promotes regulatory T-cell function in the intestine. Nature. 2014;513:564–568. doi: 10.1038/nature13577. [DOI] [PMC free article] [PubMed] [Google Scholar]
- 29.Asterholm IW, et al. Adipocyte Inflammation Is Essential for Healthy Adipose Tissue Expansion and Remodeling. Cell Metab. 2014;20:103–118. doi: 10.1016/j.cmet.2014.05.005. [DOI] [PMC free article] [PubMed] [Google Scholar]
- 30.Rubtsov YP, et al. Regulatory T Cell-Derived Interleukin-10 Limits Inflammation at Environmental Interfaces. Immunity. 2008;28:546–558. doi: 10.1016/j.immuni.2008.02.017. [DOI] [PubMed] [Google Scholar]
- 31.He W, et al. Adipose-specific peroxisome proliferator-activated receptor gamma knockout causes insulin resistance in fat and liver but not in muscle. PNAS. 2003;100:15712–15717. doi: 10.1073/pnas.2536828100. [DOI] [PMC free article] [PubMed] [Google Scholar]
- 32.Liston A, et al. Differentiation of regulatory Foxp3+ T cells in the thymic cortex. PNAS. 2008;105:11903–11908. doi: 10.1073/pnas.0801506105. [DOI] [PMC free article] [PubMed] [Google Scholar]
- 33.Dobin A, et al. STAR: ultrafast universal RNA-seq aligner. Bioinformatics. 2012;29:15–21. doi: 10.1093/bioinformatics/bts635. [DOI] [PMC free article] [PubMed] [Google Scholar]
- 34.Trapnell C, et al. Differential analysis of gene regulation at transcript resolution with RNA-seq. Nat Biotechnol. 2012;31:46–53. doi: 10.1038/nbt.2450. [DOI] [PMC free article] [PubMed] [Google Scholar]
- 35.Roberts A, Pimentel H, Trapnell C, Pachter L. Identification of novel transcripts in annotated genomes using RNA-Seq. Bioinformatics. 2011;27:2325–2329. doi: 10.1093/bioinformatics/btr355. [DOI] [PubMed] [Google Scholar]
- 36.Monticelli LA, et al. Innate lymphoid cells promote lung-tissue homeostasis after infection with influenza virus. Nat Immunol. 2011;12:1045–1054. doi: 10.1031/ni.2131. [DOI] [PMC free article] [PubMed] [Google Scholar]


