

Summary
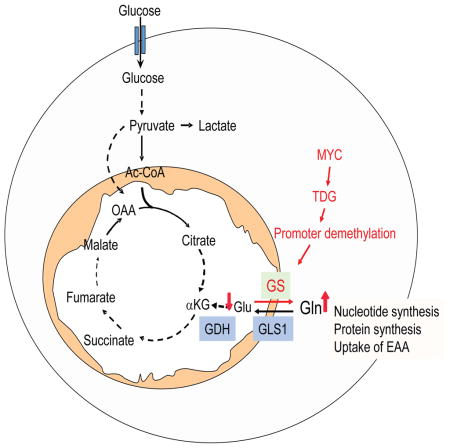
c-Myc is known to promotes glutamine usage by up-regulating glutaminase (GLS), which converts glutamine to glutamate that is catabolized in the TCA cycle. Here we report that in a number of human and murine cells and cancers, Myc induces elevated expression of glutamate-ammonia ligase (GLUL), also termed glutamine synthetase (GS), which catalyzes the de novo synthesis of glutamine from glutamate and ammonia. This is through upregulation of a Myc transcriptional target thymine DNA glycosylase (TDG), which promotes active demethylation of the GS promoter and its increased expression. Elevated expression of GS promotes cell survival under glutamine limitation, while silencing of GS decreases cell proliferation and xenograft tumor growth. Upon GS overexpression, increased glutamine enhances nucleotide synthesis and amino acid transport. These results demonstrate an unexpected role of Myc in inducing glutamine synthesis, and suggest a novel molecular connection between DNA demethylation and glutamine metabolism in Myc-driven cancers.
Graphical Abstract
Introduction
Cancer cells rewire their metabolic programs including abnormal glutamine metabolism to benefit their growth, proliferation, and survival (DeBerardinis et al., 2008). Some cancer cell lines display increased glutamine uptake and catabolism to fuel the tricyclic acid (TCA) cycle that render cells addicted to glutamine. Nonetheless, in addition to being a nutrient substrate, glutamine is involved in other biological processes including serving as the obligate nitrogen donor for the synthesis of nucleotides and non-essential amino acids, as an exchanger for the import of essential amino acids, and as a means to detoxifying intracellular ammonia and glutamate (Dang, 2012; DeBerardinis and Cheng, 2010; Hensley et al., 2013; Wise and Thompson, 2010)
While the metabolic changes in cancer cells can be promoted by a passive cell adaptation to environmental conditions such as hypoxia and redox stress, they are often actively regulated by genetic alterations such as activation of oncoproteins and loss of tumor suppressors (DeBerardinis et al., 2008; Kroemer and Pouyssegur, 2008; Vander Heiden et al., 2009). Two proto-oncoproteins, Akt and c-Myc (hereafter referred to as Myc), have been intensively studied for their functions in regulating cell metabolism. Both Akt and Myc can promote aerobic glycolysis, also termed the Warburg effect. With regard to glutamine metabolism, while studies to date suggests that Akt minimally impacts glutamine metabolism (Fan et al., 2013), oncogenic Myc has been shown to promote glutamine uptake by directly transactivating the expression of glutamine transporters SLC1A5 and SLC7A5/SLC3A2 (Nicklin et al., 2009), and to promote glutaminolysis by increasing the expression of glutaminase (GLS) via transcriptional suppression of the GLS repressor micro RNAs (miR)-23a/b (Gao et al., 2009). In a previous study, we established an isogenic dual-regulatable FL5.12 pre-B cell line in which myrAkt is expressed under the control of doxycycline (DOX), and Myc, fused to the hormone-binding domain of the human estrogen receptor (ER), is activated by 4-hydroxytamoxifen (4-OHT) (Fan et al., 2010). Using this system, we compare the effects of Akt and Myc on gene expression using the Affymetrix DNA array analysis. To our surprise, we found that Myc but not Akt can upregulate the expression of glutamine synthetase (GS), the enzyme that catalyzes the synthesis of glutamine from glutamate and ammonia, which is the reverse reaction of glutaminolysis that is catalyzed by GLS.
Results
Myc upregulates GS expression and activity
In the FL5.12 Akt/Myc (AM) clones that we previously established where myrAkt and Myc can be induced individually or simultaneously in an isogenic background (Fan et al., 2010), GS expression was found to increase upon Myc but not Akt activation using an Affymetrix mouse cDNA array (Fig. 1A). This induction of GS expression was confirmed in two individual clones (AM10 and AM32) at both the transcription (Fig. 1B) and protein levels (Fig. 1C), which was accompanied by an increased GS enzymatic activity (Fig. 1D). Under a physiological setting, introduction of Myc into the Pdx1-Cre; LSL-KRasG12D model (Hingorani et al., 2003) by breeding it to the Rosa26-LSL-Myc mice (Murphy et al., 2008) led to a massive increase of GS expression in the pancreatic ductal neoplasia compared with the age-matched control KRasG12D mice (Fig. 1E). In the lung tumor cells isolated from the LSL-KRasG12D; tp53flox/flox mice (Jackson et al., 2001), induction of Myc using the MycER system also led to elevated GS mRNA level (Fig. 1F). In the immortalized yet non-transformed human mammary epithelial cell line MCF10A, expression of Myc (Fig. 1G), which stimulated cell proliferation (Fig. 1H), also led to elevated GS expression at both protein (Fig. 1G) and transcript levels (Fig. 1I) accompanied by increased enzymatic activity (Fig. 1J). It is interesting to note that GLS protein level did not increase in this system (Fig. 1G). Using the Cancer Genome Atlas (TCGA) data of human T-lymphoma with Myc amplification, a strong correlation between Myc amplification and GS expression was observed (Fig. 1K). Conversely, in a number of human cancer cell lines, silencing of endogenous Myc led to decreased GS expression, yet variable changes in the GLS level (Fig. 1L). These data indicate that Myc upregulation can promote GS expression in numerous mouse and human cell lines and cancers.
Figure 1. Myc upregulates GS expression.

(A–D) FL5.12 parental cells and the AM clones (AM10 and AM32) were cultured in the control medium, with Dox to activate Akt, or 4-OHT to activate Myc, or both, for 36 h. Fold change of GS transcript by mouse cDNA array is shown (A). Relative GS transcript level determined by qRT-PCR is shown as the mean plus SEM of a representative experiment performed in triplicates (B). Cell lysates were analyzed by immunoblotting (C). GS activity was determined and is shown as the mean plus SEM of at least 5 independent experiments (D). (E) Pancreata from 2-month old Pdx1-Cre; LSL-KRasG12D (n = 4) and age-matched Pdx1-Cre; LSL-KRasG12D; R26-LSL-MYC (n = 4) mice were stained for GS by IHC. I: Islets; N: normal tissue; T: tumors. Note that normal islet stains positive for GS. (F) Murine lung tumor cells derived from viral-Cre induced LSL-KRasG12D; p53fl/fl mice were infected with pBabe-MycERT2 and treated for 24 h with ethanol vehicle or 100 nM 4-OHT. mRNA was subjected to Illumina sequencing. GS mRNA levels are expressed as number of sequencing reads (Mean plus SD (n=4)). (G–J) MCF10A cells were stably transfected with vector or pBabe-c-Myc. Cells were subjected to immunoblotting (G). Cell growth was measured and shown as the mean plus SD of a representative experiment of three independent experiments performed in triplicates (H). GS transcript level analyzed by qRT-PCR is shown as the mean plus SEM of 3 independent experiments performed in duplicates (I). GS activity is shown as the mean plus SEM of 3 independent experiments (J). (K) Differential expression levels of GS in Myc-high and Myc-low groups in T-cell lymphoma. Shown are box plots of expression levels of GS. The Myc high and Myc low groups were defined by Myc expression above or below the median level. (L) Indicated cell lines were stably infected with indicated shRNAs and subjected to immunoblotting.
Myc directly upregulates TDG that leads to GS expression via promoter demethylation
We next studied how Myc induces GS expression. As Myc amplification is a major oncogenic event in human breast cancer, we focused on human breast epithelial cell lines for the following studies. Five out of the 6 breast cancer cell lines that we examined showed strong GS expression, excluding Hs578T cells (Fig. 2A). Therefore, we utilized Hs578T cells to study the effect of GS upregulation in cancerous cells. We also chose to use MCF10A cells which have low levels of GS expression (Fig. 1G) to study GS regulation upon Myc activation in non-transformed cells. Myc is a helix-loop-helix leucine zipper family transcriptional regulator that dimerizes with Max family proteins to bind the CAC(G/A)TG (E-box) sequence and directly activates transcription of its target genes. However, analysis of the putative GS promoter regions using the Genomatix Genome Analyzer (http://www.genomatix.de) and the SABiosciences Transcription Factor Search Portal (http://www.sabiosciences.com) showed no canonical Myc binding sites in human, mouse, or rat GS promoters, consistent with previous analysis of the GS promoter (Kung et al., 2011). Interestingly, we noticed G/C rich regions spanning the transcriptional starting site in the GS gene, which was predicted to be a CpG island (Fig. 2B). This suggested a possible mechanism of transcriptional regulation by DNA methylation of the GS promoter. Indeed, treatment with 5-azacytidine, a DNA methyltransferase inhibitor, enhanced GS expression in both MCF10A and Hs578T cells (Fig. 2C). Bisulfite sequencing showed that the GS promoter was indeed methylated and that Myc expression led to its decreased methylation (Fig. 2D). To determine how Myc affects GS promoter methylation, we examined the expression of the major DNA methyltransferases and demethylases upon Myc expression. While Myc did not significantly change the expression level of DNA methyltransferases DNMT1, DNMT3A, and DNMT3B, or that of the DNA demethylases TET1, TET2, and MBD4 (Suppl. Fig. S1A), it markedly increased the expression of TET3 (Suppl. Fig. S1A) and TDG (Fig. 2E). This suggests that Myc can induce “active demethylation” by up-regulating TET3 which oxidizes 5-methylcytosine (5mC) and TDG which then removes the oxidized products via excision repair (He et al., 2011; Ito et al., 2011). Supporting the active demethylation theory, increased DNA demethylase activity was observed in Myc-expressing cells (Fig. 2F). Gemcitabine, a pharmacological inhibitor of DNA demethylation, suppressed Myc-induced GS expression in both MCF10A-Myc (Fig. 2G) and in FL5.12-AM32 cells (Suppl. Fig. S1B).
Figure 2. Myc upregulates GS expression via TDG-mediated demethylation of GS promoter.

(A) Indicated breast cancer cell lines were probed for GS expression. (B) Schematic representation of the CpG distribution in the 5′-regulatory region of the GLUL gene from the CpG Island Searcher (http://www.cpgislands.com). The CpG sites are represented by vertical tick marks, and the beginning of exon 1 is depicted as “+1”. (C) MCF10A cells and Hs578T cells were treated with 20 μM 5-azacytidine (5-Aza). GS transcript level determined via qRT-PCR is shown as the mean plus SEM of a representative experiment performed in triplicates. (D) Single cell clones of vector control and Myc-expressing MCF10A cells were established by limited dilution. The GS promoter was PCR amplified in 5 clones of each cell type, and analyzed by bisulfate sequencing. The schematics of the sequencing results and the human GS promoter with the numbered CpGs are shown. Open and filled circles indicate unmethylated and methylated cytosines, respectively. (E) TDG transcript level in Myc-expressing MCF10A cells was analyzed by qRT-PCR and is shown as the mean plus SEM of 5 independent experiments performed in triplicates. (F) DNA demethylase activity was determined in Myc-expressing MCF10A cells and shown as the mean plus SEM of 4 independent experiments. (G) Vector control (v) and Myc-expressing (m) MCF10A cells were treated with gemcitabine for 24 h, and subjected to immunoblotting. (H) The level of Myc binding to the TDG promoter in Myc-expressing MCF10A cells was analyzed by ChIP assay using the Myc antibody followed by PCR of two specific regions within the promoter (PCR#1 and PCR#2). Fold enhancement represents the abundance of enriched DNA fragments over an IgG control. (I) MCF10A cells were transfected with the luciferase reporters driven by the pGL3 control vector, the wild-type TDG promoter, or the TDG promoter mutants with the two E-boxes mutated individually or simultaneously, together with a renilla luciferase construct. Luciferase activity in cell lysates was quantified after 24 h, and standardized based on renilla luciferase activity and normalized to that of the pGL3-transfected cells (Mean plus SD of a representative experiment performed in triplicates). (J) FL5.12-AM32 cells were cultured in 4-OHT to induce Myc activation. Transcript levels of GS and TDG determined by qRT-PCR are shown as the mean plus SEM from 2 independent experiments performed in triplicates. (K) MCF10A cells were stably infected with indicated shRNAs. TDG transcript level was analyzed by qRT-PCR (Mean plus SEM of an experiment performed in triplicates).
We further characterized how Myc induces TET3 and TDG expression. Interestingly, two recent independent genome-wide chromatin immunoprecipitation-sequencing (ChIP-Seq) analyses suggested that Myc can directly bind to the promoter of TDG but not of TET3 (Perna et al., 2012; Walz et al., 2014). Promoter analysis identified two putative E-boxes in TDG promoter. ChIP-PCR analysis using the Myc antibody and two specific sequences containing the E-boxes revealed that Myc is recruited to the TDG promoter (Fig. 2H). We then generated luciferase reporter constructs driven by wild-type TDG promoter or promoters mutated at E-box consensus sites. While the wild-type promoter drove a significantly higher luciferase activity in Myc-expressing cells, both single E-box mutants and the double mutant lost the Myc-mediated inducibility (Fig. 2I). Using the FL5.12-MycER cells and MCF10A-MycER cells where Myc can be acutely induced, a rapid induction of GS and TDG was observed as early as 4 h and 8 h respectively upon Myc activation (Fig. 2J and Suppl. Fig. S1C), which correlated with decreased GS promoter methylation (Suppl. Fig. S1D and S1E) and is consistent with the active demethylation mechanism which is replication-independent. Lastly, TDG silencing in Myc-expressing MCF10A cells abrogated Myc-induced GS expression (Fig. 2K). Therefore, we identified a previously undescribed mechanism whereby Myc activates GS expression via the demethylation of its promoter.
Myc-induced GS promotes glutamine metabolism
We then studied the effect of GS in cancer cells. GS was ectopically expressed in Hs578T cells (Fig. 3A), and cells were incubated with 15N-labeled ammonia (NH4Cl) and subjected to gas chromatography-mass spectrometry (GC-MS) analysis. In vector control cells ~ 30% of the intracellular glutamine was m+1 (15N1) labeled, which is produced by the condensation of m+0 glutamate and NH4Cl. The expression of GS significantly increased 15N incorporation into glutamine with over 40% of the glutamine m+1 labeled (Fig. 3B), demonstrating that GS promotes glutamine synthesis.
Figure 3. GS leads to increased cataplerotic flux towards glutamine synthesis and promotes nucleotide synthesis.

(A) Hs578T cells were stably transfected with vector control or GS. (B) Cells were labeled with 15N-NH4Cl for 6 h in glutamine-deficient media and nitrogen incorporation into glutamine was determined by GC-MS. Fractions of glutamine isotopologues were normalized for stable isotope natural abundances. (C–F) Metabolic tracing analysis of the GS-expressing Hs578T cells. Cells were cultured in glutamine-free medium for 16 h before labeling with 12.5 mM 13C-glucose for 6 h in glutamine-free medium. Relative abundance of 12C and 13C in each metabolite pool was measured by GC-MS, and is expressed relative to the internal standard and protein content in each sample normalized to the value of 12C fraction in vector control cells (C: glutamine, D: glutamate, E: α-KG, F: other indicated metabolites). All data represent total labeling, i.e. all isotopologues. Shown is the mean plus SD from 3 (in some cases 2) samples. (G) Cells were labeled for 16 h with 15N-NH4Cl in glutamine-replete (2 mM) medium and subjected to LC-MS. Percent of each 15N labeled molecule is shown. All data represent total labeling (Mean plus SD from 3 individual samples). (H) MCF10A cells were labeled with 15N-NH4Cl for 6 h in glutamine-free medium and nitrogen incorporation into glutamine was determined by GC-MS. Total pool of glutamine was normalized for stable isotope natural abundances. (I and J) MCF10A cells were stably infected with indicated shRNAs. (I) Successful GS silencing is shown. (J) Cells were labeled for 16 h with 15N-NH4Cl in glutamine-replete (2 mM) medium and subjected to LC-MS. Percent of each 15N labeled molecule is shown. All data represent total labeling (Mean plus SD from a representative of three independent experiments performed in triplicate).
Myc is known to promote glutaminolysis which leads to increased anaplerosis at the αKG step of the TCA cycle (DeBerardinis et al., 2007; Wise et al., 2008). Hence GS-promoted glutamine synthesis might be expected to consume TCA cycle intermediates, of which a major source is glucose. Therefore, 13C-glucose was traced in GS-expressing Hs578T cells in the absence of glutamine. Consistent with the 15N-NH4Cl labeling, tracing of the 13C-labeled glucose showed increased glutamine in GS-expressing Hs578T cells (Fig. 3C), accompanied by a reduced relative abundance of glutamate (Fig. 3D) and αKG (Fig. 3E). We did not observe significant changes in 13C incorporation into pyruvate and lactate, two of the glycolytic metabolites most proximal to the TCA cycle (Fig. 3F), nor did we observe a significant difference in the TCA cycle intermediate citrate (Fig. 3F). Moreover, the abundance of succinate, fumarate, and malate were significantly reduced (Fig. 3F). These data suggest that enforced expression of GS may promote cataplerotic efflux of the TCA cycle from the point of αKG.
Based on these data we sought to determine the fate of newly synthesized glutamine in the context of GS or Myc overexpression. Aside from the anapleurotic role of glutamine in contributing carbons to the TCA cycle, glutamine plays a major role in a variety of cellular anabolic processes predominately via the donation of the terminal nitrogen group which can be assayed via 15N-NH4Cl labeling. To directly determine the fate of glutamine, we utilized the 15N-NH4Cl labeling followed by methanol extraction of metabolites then tracing via liquid chromatography-mass spectrometry (LC-MS). Consistent with the GC-MS data (Fig. 3B), LC-MS also revealed significant incorporation of 15N into glutamine accompanied by increased asparagine, the recipient of the terminal 15N-amine group donated by glutamine (Fig. 3G). Interestingly, labeling patterns revealed that while the incorporation of 15N into glutathione, which is synthesized from glutamate, was reduced, the 15N incorporation into ribonucleosides and monophosphate nucleotides was markedly increased in GS-expressing cells (Fig. 3G).
Next, we studied the metabolic effect of Myc expression using MCF10A cells. Importantly, similar to the GS-overexpressing Hs578T cells (Fig. 3B), an increase in the fraction of m+1 (15N1) glutamine was observed in Myc-expressing MCF10A cells by GC-MS using the 15N-NH4Cl labeling (Fig. 3H). As GS promoted nucleotide synthesis (Fig. 3G) and Myc stimulated MCF10A cell proliferation (Fig. 1J), we examined whether GS plays a role in Myc-induced nucleotide synthesis, which would correlate with increased DNA synthesis and cell proliferation. To this end, GS was silenced in Myc-expressing MCF10A cells (Fig. 3I), and cells were subjected to 15N-NH4Cl labeling followed by LC-MS. Myc activation led to increased 15N-glutamine and 15N-asparagine, which was markedly reduced upon GS silencing (Fig. 3J). The 15N incorporation into glutathione was not drastically affected upon GS silencing, suggesting GS-independent regulation mechanisms for glutathione in Myc-active cells (Fig. 3J). Importantly, in Myc-overexpressing cells, although they did not show drastically increased steady-state levels of methanol-soluble free ribonucleosides, likely due to the faster incorporation of nucleotides into DNA or RNA strands as indicated by faster proliferation of the Myc cells, GS silencing led to a marked decrease of the steady-state level of 15N incorporation into ribonucleosides (Fig. 3J). Together, these results strongly indicate that GS promotes glutamine production which can be used for anabolic processes such as synthesis of asparagine and nucleotides in Myc active cells.
GS promotes amino acid transport, cell survival, and oncogenesis
To assay another downstream function of this glutamine anabolic program, we tested the possibility of glutamine acting as an exchange factor in the bidirectional transport of leucine (Nicklin et al., 2009). Overexpression of GS alone was sufficient to increase leucine uptake by approximately 20%, in a System L-dependent manner as the uptake was abrogated by the System L inhibitor BCH (Fig. 4A, left and right panels). The importance of intracellular amino acids for system L-mediated leucine uptake in both cell lines was also demonstrated by the inhibition of leucine uptake when cells were incubated in amino acid-depleted media (Fig 4A, KRB). Additionally, high level of GS provided a sustained ability to uptake leucine even in the absence of extracellular glutamine (Fig. 4A), in agreement with GS contributing to increased intracellular levels of glutamine that act as an efflux substrate for the uptake of leucine (Krokowski et al., 2013; Nicklin et al., 2009). Consistent with the increased leucine uptake and glutamine efflux, increased levels of extracellular glutamine was detected in GS-expressing cells (Fig. 4B).
Figure 4. GS promotes amino acid uptake and tumorigenesis.

(A) Hs578T cells were tested for leucine uptake at basal conditions, under amino acid withdrawal (KRB), and under glutamine deprivation alone for 5 h. System L-dependent uptake of leucine was assayed in EBSS without sodium and confirmed by the use of the System L inhibitor BCH. (B) Extracellular glutamine levels in media from Hs578T cells. Concentration was normalized to protein concentration and displayed as a fold change from vector cells (Mean plus SD of two experiments performed in triplicates). (C) Hs578T cells were cultured in glutamine-free medium. Cell viability is shown as the mean plus SD of three independent experiments. (D and E) Myc-expressing MCF10A cells with shNTC or shGS were cultured in complete (D) or glutamine-free medium (E). Cell growth (D) and cell viability (E) were measured. (F and G) Indicated cell lines were stably infected with two independent GS shRNAs. Successful silencing is shown (F). Cells growth in complete medium was measured (G). (H) MDA-MB-231 cells infected with two individual GS shRNAs were measured for spontaneous cell death. (I) Myc-expressing MCF10A cells were cultured in complete or glutamine-free medium, in the absence or presence of the GS inhibitor methionine sulfoximine (MSO). Cell viability was measured 48 h later. (J and K) MCF10A cells were cultured in complete or glutamine-free medium, in the absence or presence MSO (J) or the GLS inhibitor BPTES (K). Cell viability was measured 48 h later. (L-N) MDA-MB-468 cells were stably infected with a Tet-inducible shRNA for GS, and subjected to immunoblotting (L). Cell growth was measured (M). Cells were injected subcutaneously into both flanks of athymic nude mice. Mice were fed without (n = 8) or with (n = 10) doxycycline hyclate (1 mg/ml). Average tumor size plus SEM is shown. Images of tumors are shown in the insert.
We then determined the biological consequences of GS expression. In Hs578T cells, overexpression of GS enhanced cell viability upon glutamine deprivation (Fig. 4C). Conversely, silencing GS in Myc-expressing MCF10A cells led to decreased cell proliferation in complete medium (Fig. 4D) and sensitized cells to glutamine deprivation (Fig. 4E). The generality of this phenomenon was further illustrated by silencing GS with two independent shRNAs in MCF10A-Myc and the more aggressive breast cancer cell lines MDA-MB-231 and MDA-MB-468 (Fig. 4F), which led to decreased proliferation (Fig. 4G). Silencing of GS did not have an obvious effect on the non-transformed MCF10A parental cells (Fig. 4F and 4G). GS silencing also led to spontaneous cell death in MDA-MB-231 cells (Fig. 4H). The pro-survival role of GS was further demonstrated using the GS inhibitor MSO that enhanced cell sensitivity to glutamine deprivation in Myc-expressing cells (Fig. 4I). Interestingly, unlike MSO, BPTES, the inhibitor of GLS, did not confer sensitivity to glutamine deprivation but rather suppressed cell death in the MCF10A-Myc cells (Fig. 4J and 4K), consistent with an anabolism-promoting function of glutamine. Furthermore, to test the effect of GS suppression in vivo, we introduced a Tet-inducible GS shRNA in MDA-MB-468 cells that have high level of endogenous GS. Addition of doxycycline led to a progressive loss of GS (Fig. 4L) as well as decreased cell growth (Fig. 4M) and xenograft tumor growth (Fig. 4N). These data indicate that GS promotes cell proliferation and survival, and may be a viable therapeutic target in Myc-driven cancers.
Discussion
Here we report that Myc upregulates expression of GS, the enzyme that catalyzes the formation of glutamine from glutamate and ammonia. This Myc-induced GS expression promotes glutamine anabolism and is associated with cell proliferation, survival, and xenograft tumor growth, suggesting an important role of GS in Myc-driven oncogenesis. In addition to being a nutrient substrate, glutamine is involved in many biological processes including serving as the obligate nitrogen donor for multiple steps in both purine and pyrimidine synthesis and contributing to the production of non-essential amino acids (DeBerardinis and Cheng, 2010; Wise and Thompson, 2010). Indeed, our data indicate that several fates elucidated for newly synthesized glutamine, namely nucleotide and asparagine synthesis as well as amino acid transport (Fig. 3F and 4A), fit into the anabolism-promoting role of glutamine.
The connection between Myc and numerous essential cellular processes (macromolecule biosynthesis, ribosome biogenesis, and DNA replication) has previously been established and offers an explanation for the enhanced glutamine anabolism we report. GS-driven glutamine synthesis is the only known reaction for endogenous glutamine production. In mammals, nearly 90% of glutamine production originates from endogenous sources (Biolo et al., 2005; Kuhn et al., 1999). While muscle tissue accounts for the majority of synthesized glutamine that can be released into the circulating system and taken up by other tissues and tumors, many tissues and cell types have the ability to upregulate GS and glutamine synthesis upon glutamine shortage (He et al., 2010; Newsholme et al., 2003). In cells with Myc amplification, increased biosynthetic processes may increase the demand for glutamine to serve as a basis for many anabolic processes. This is supported by a recent report that de novo glutamine synthesis was found to be elevated in human glioblastoma (Maher et al., 2012). Therefore, oncogenic Myc may hijack the glutamine synthesis system to ensure glutamine supply for autonomous need or perhaps in a symbiotic fashion that benefits tumor tissue heterogeneity and microenvironment, especially under the condition of glutamine shortage such as in poorly vascularized tumors.
While our findings are seemingly paradoxical to Myc’s role in promoting glutaminolysis to fuel the TCA cycle, it is not entirely surprising. Indeed, recent reports highlighted glucose oxidation as a predominant fuel source in patient samples and human orthotopic tumor models which show glucose as a means of anaplerosis and accumulation of glutamine in tumors (Maher et al., 2012; Marin-Valencia et al., 2012). Myc may preferentially activate either glutaminolysis or glutamine synthesis in a context-dependent manner. This notion is supported by the observations that Myc often does not lead to simultaneous upregulation of GLS and GS (Yuneva et al., 2012), and that a mutual suppressive mechanism may exist between GS and GLS in various breast cancer subtypes (Kung et al., 2011). In addition, even within a single cell, the two reactions may be tightly regulated as they occur at different subcellular compartments: glutaminolysis predominantly in mitochondria and glutamine synthesis in the cytosol (Svenneby and Torgner, 1987).
We also show that Myc-induced GS expression is mediated by a novel mechanism that involves active promoter demethylation. DNA methylation has been regarded as a critical factor in oncogenesis yet its precise role and regulation remain largely elusive. Nevertheless, global hypomethylation has also been prevalently detected and recognized as a cause for cancer, although the regulation of specific genes is yet to be illustrated (Kulis and Esteller, 2010). Our current data provides a novel example that Myc can induce DNA demethylation and alter cell metabolism. This is consistent with the evidence that active DNA demethylation plays an important role in the development of germ cells and pluripotent stem cells (Wu and Zhang, 2014), which share many common signaling pathways and metabolic alterations with Myc-driven oncogenesis (Goding et al., 2014).
Experimental Procedures
Cell death assay
Propidium iodide (PI) was added to each sample at 1 μg/ml. Cell viability was measured by plasma membrane permeability indicated by PI exclusion using a flow cytometer (FACSCalibur, BD Biosciences).
Cell growth assay
Cell growth rate was measured by crystal violet staining. Briefly, cells were fixed with 4% PFA then stained with 0.1% crystal violet. After washing, crystal violet was extracted with 10% acetic acid and absorbance was measured at 590 nm.
Amino acid transport assays
Amino acid uptake was performed as previously described (Krokowski et al., 2013).
Quantitative RT-PCR
Total RNA was isolated with RNeasy kit (Qiagen). Reverse transcription was carried out with 2 μg of total RNA using the SuperscriptIII First Strand Synthesis system (Invitrogen). The synthesized cDNA was used for real-time quantitative PCR (qPCR) with the PerfeCTa SYBR Green Super mix (Quanta Bioscience 95055) on the StepOnePlus (Applied Biosystems).
Stable isotope-based metabolite tracing
13C-glucose and 15N-NH4Cl labeling coupled with GC-MS was performed at the metabolomics cores at McGill University and Stony Brook University. 15N-NH4Cl labeling coupled with LC-MS was performed at the Department of Chemistry & Lewis-Sigler Institute for Integrative Genomics at Princeton University
Animals
Female athymic nude mice, 6 to 8 wk old, were purchased from Charles River Laboratories. Mice were housed and monitored at the Division of Laboratory Animal Resources at Stony Brook University. All experimental procedures and protocols were approved by the Stony Brook University institutional animal care and use committee (IACUC).
Statistical analyses
The longitudinal data analyses were performed to assess the growth curves. The ANOVA procedures were used to evaluate differences among multiple groups with the Dunnett or Newman-Keuls test. The independent two-sample and one sample t-tests were used to make comparisons between two groups and to evaluate whether fold changes are different from one, respectively. The analyses were mainly carried out using PROC MIXED, PROC FREQ, PROC MEANS and PROC TTEST in the SAS 9.4 (SAS institute, Cary, NC). Some initial analyses were also carried out with GraphPad Prism 5 for Windows. Different levels of statistical significance are indicated as: n.s.: non-significant, *p<0.05, **p<0.01, ***p<0.001, and ****p<0.0001.
More detailed experimental procedures can be found in “Supplemental Information”.
Supplementary Material
Acknowledgments
We thank Drs. Richard Lin, Eyal Gottlieb, Eileen White, and Jessie Guo for insightful discussions and critical reading. This work was supported by grants from NIH (R01CA129536 and R01GM97355 to WXZ, R37DK060596 and R01DK053307 to MH) and the Carol Baldwin Breast Cancer Research Foundation to WXZ.
Footnotes
Author contributions
AJB, ICP, YF, and WXZ conceived the ideas and designed the experiments. All authors performed experiments or data analysis. AJB, ICP, and WXZ wrote the paper.
Publisher's Disclaimer: This is a PDF file of an unedited manuscript that has been accepted for publication. As a service to our customers we are providing this early version of the manuscript. The manuscript will undergo copyediting, typesetting, and review of the resulting proof before it is published in its final citable form. Please note that during the production process errors may be discovered which could affect the content, and all legal disclaimers that apply to the journal pertain.
References
- Biolo G, Zorat F, Antonione R, Ciocchi B. Muscle glutamine depletion in the intensive care unit. The international journal of biochemistry & cell biology. 2005;37:2169–2179. doi: 10.1016/j.biocel.2005.05.001. [DOI] [PubMed] [Google Scholar]
- Dang CV. Links between metabolism and cancer. Genes Dev. 2012;26:877–890. doi: 10.1101/gad.189365.112. [DOI] [PMC free article] [PubMed] [Google Scholar]
- DeBerardinis RJ, Cheng T. Q’s next: the diverse functions of glutamine in metabolism, cell biology and cancer. Oncogene. 2010;29:313–324. doi: 10.1038/onc.2009.358. [DOI] [PMC free article] [PubMed] [Google Scholar]
- DeBerardinis RJ, Lum JJ, Hatzivassiliou G, Thompson CB. The biology of cancer: metabolic reprogramming fuels cell growth and proliferation. Cell Metab. 2008;7:11–20. doi: 10.1016/j.cmet.2007.10.002. [DOI] [PubMed] [Google Scholar]
- DeBerardinis RJ, Mancuso A, Daikhin E, Nissim I, Yudkoff M, Wehrli S, Thompson CB. Beyond aerobic glycolysis: transformed cells can engage in glutamine metabolism that exceeds the requirement for protein and nucleotide synthesis. Proc Natl Acad Sci U S A. 2007;104:19345–19350. doi: 10.1073/pnas.0709747104. [DOI] [PMC free article] [PubMed] [Google Scholar]
- Fan J, Kamphorst JJ, Mathew R, Chung MK, White E, Shlomi T, Rabinowitz JD. Glutamine-driven oxidative phosphorylation is a major ATP source in transformed mammalian cells in both normoxia and hypoxia. Molecular systems biology. 2013;9:712. doi: 10.1038/msb.2013.65. [DOI] [PMC free article] [PubMed] [Google Scholar]
- Fan Y, Dickman KG, Zong WX. Akt and c-Myc differentially activate cellular metabolic programs and prime cells to bioenergetic inhibition. J Biol Chem. 2010;285:7324–7333. doi: 10.1074/jbc.M109.035584. [DOI] [PMC free article] [PubMed] [Google Scholar]
- Gao P, Tchernyshyov I, Chang TC, Lee YS, Kita K, Ochi T, Zeller KI, De Marzo AM, Van Eyk JE, Mendell JT, Dang CV. c-Myc suppression of miR-23a/b enhances mitochondrial glutaminase expression and glutamine metabolism. Nature. 2009;458:762–765. doi: 10.1038/nature07823. [DOI] [PMC free article] [PubMed] [Google Scholar]
- Goding CR, Pei D, Lu X. Cancer: pathological nuclear reprogramming? Nat Rev Cancer. 2014;14:568–573. doi: 10.1038/nrc3781. [DOI] [PubMed] [Google Scholar]
- He Y, Hakvoort TB, Kohler SE, Vermeulen JL, de Waart DR, de Theije C, ten Have GA, van Eijk HM, Kunne C, Labruyere WT, Houten SM, Sokolovic M, Ruijter JM, Deutz NE, Lamers WH. Glutamine synthetase in muscle is required for glutamine production during fasting and extrahepatic ammonia detoxification. J Biol Chem. 2010;285:9516–9524. doi: 10.1074/jbc.M109.092429. [DOI] [PMC free article] [PubMed] [Google Scholar]
- He YF, Li BZ, Li Z, Liu P, Wang Y, Tang Q, Ding J, Jia Y, Chen Z, Li L, Sun Y, Li X, Dai Q, Song CX, Zhang K, He C, Xu GL. Tet-mediated formation of 5-carboxylcytosine and its excision by TDG in mammalian DNA. Science. 2011;333:1303–1307. doi: 10.1126/science.1210944. [DOI] [PMC free article] [PubMed] [Google Scholar]
- Hensley CT, Wasti AT, DeBerardinis RJ. Glutamine and cancer: cell biology, physiology, and clinical opportunities. J Clin Invest. 2013;123:3678–3684. doi: 10.1172/JCI69600. [DOI] [PMC free article] [PubMed] [Google Scholar]
- Hingorani SR, Petricoin EF, Maitra A, Rajapakse V, King C, Jacobetz MA, Ross S, Conrads TP, Veenstra TD, Hitt BA, Kawaguchi Y, Johann D, Liotta LA, Crawford HC, Putt ME, Jacks T, Wright CV, Hruban RH, Lowy AM, Tuveson DA. Preinvasive and invasive ductal pancreatic cancer and its early detection in the mouse. Cancer Cell. 2003;4:437–450. doi: 10.1016/s1535-6108(03)00309-x. [DOI] [PubMed] [Google Scholar]
- Ito S, Shen L, Dai Q, Wu SC, Collins LB, Swenberg JA, He C, Zhang Y. Tet proteins can convert 5-methylcytosine to 5-formylcytosine and 5-carboxylcytosine. Science. 2011;333:1300–1303. doi: 10.1126/science.1210597. [DOI] [PMC free article] [PubMed] [Google Scholar]
- Jackson EL, Willis N, Mercer K, Bronson RT, Crowley D, Montoya R, Jacks T, Tuveson DA. Analysis of lung tumor initiation and progression using conditional expression of oncogenic K-ras. Genes Dev. 2001;15:3243–3248. doi: 10.1101/gad.943001. [DOI] [PMC free article] [PubMed] [Google Scholar]
- Kroemer G, Pouyssegur J. Tumor cell metabolism: cancer’s Achilles’ heel. Cancer Cell. 2008;13:472–482. doi: 10.1016/j.ccr.2008.05.005. [DOI] [PubMed] [Google Scholar]
- Krokowski D, Han J, Saikia M, Majumder M, Yuan CL, Guan BJ, Bevilacqua E, Bussolati O, Broer S, Arvan P, Tchorzewski M, Snider MD, Puchowicz M, Croniger CM, Kimball SR, Pan T, Koromilas AE, Kaufman RJ, Hatzoglou M. A self-defeating anabolic program leads to beta-cell apoptosis in endoplasmic reticulum stress-induced diabetes via regulation of amino acid flux. J Biol Chem. 2013;288:17202–17213. doi: 10.1074/jbc.M113.466920. [DOI] [PMC free article] [PubMed] [Google Scholar]
- Kuhn KS, Schuhmann K, Stehle P, Darmaun D, Furst P. Determination of glutamine in muscle protein facilitates accurate assessment of proteolysis and de novo synthesis-derived endogenous glutamine production. The American journal of clinical nutrition. 1999;70:484–489. doi: 10.1093/ajcn/70.4.484. [DOI] [PubMed] [Google Scholar]
- Kulis M, Esteller M. DNA methylation and cancer. Advances in genetics. 2010;70:27–56. doi: 10.1016/B978-0-12-380866-0.60002-2. [DOI] [PubMed] [Google Scholar]
- Kung HN, Marks JR, Chi JT. Glutamine synthetase is a genetic determinant of cell type-specific glutamine independence in breast epithelia. PLoS genetics. 2011;7:e1002229. doi: 10.1371/journal.pgen.1002229. [DOI] [PMC free article] [PubMed] [Google Scholar]
- Maher EA, Marin-Valencia I, Bachoo RM, Mashimo T, Raisanen J, Hatanpaa KJ, Jindal A, Jeffrey FM, Choi C, Madden C, Mathews D, Pascual JM, Mickey BE, Malloy CR, DeBerardinis RJ. Metabolism of [U-13 C]glucose in human brain tumors in vivo. NMR in biomedicine. 2012;25:1234–1244. doi: 10.1002/nbm.2794. [DOI] [PMC free article] [PubMed] [Google Scholar]
- Marin-Valencia I, Yang C, Mashimo T, Cho S, Baek H, Yang XL, Rajagopalan KN, Maddie M, Vemireddy V, Zhao Z, Cai L, Good L, Tu BP, Hatanpaa KJ, Mickey BE, Mates JM, Pascual JM, Maher EA, Malloy CR, Deberardinis RJ, Bachoo RM. Analysis of tumor metabolism reveals mitochondrial glucose oxidation in genetically diverse human glioblastomas in the mouse brain in vivo. Cell Metab. 2012;15:827–837. doi: 10.1016/j.cmet.2012.05.001. [DOI] [PMC free article] [PubMed] [Google Scholar]
- Murphy DJ, Junttila MR, Pouyet L, Karnezis A, Shchors K, Bui DA, Brown-Swigart L, Johnson L, Evan GI. Distinct thresholds govern Myc’s biological output in vivo. Cancer Cell. 2008;14:447–457. doi: 10.1016/j.ccr.2008.10.018. [DOI] [PMC free article] [PubMed] [Google Scholar]
- Newsholme P, Lima MM, Procopio J, Pithon-Curi TC, Doi SQ, Bazotte RB, Curi R. Glutamine and glutamate as vital metabolites. Brazilian journal of medical and biological research = Revista brasileira de pesquisas medicas e biologicas/Sociedade Brasileira de Biofisica [et al] 2003;36:153–163. doi: 10.1590/s0100-879x2003000200002. [DOI] [PubMed] [Google Scholar]
- Nicklin P, Bergman P, Zhang B, Triantafellow E, Wang H, Nyfeler B, Yang H, Hild M, Kung C, Wilson C, Myer VE, MacKeigan JP, Porter JA, Wang YK, Cantley LC, Finan PM, Murphy LO. Bidirectional transport of amino acids regulates mTOR and autophagy. Cell. 2009;136:521–534. doi: 10.1016/j.cell.2008.11.044. [DOI] [PMC free article] [PubMed] [Google Scholar]
- Perna D, Faga G, Verrecchia A, Gorski MM, Barozzi I, Narang V, Khng J, Lim KC, Sung WK, Sanges R, Stupka E, Oskarsson T, Trumpp A, Wei CL, Muller H, Amati B. Genome-wide mapping of Myc binding and gene regulation in serum-stimulated fibroblasts. Oncogene. 2012;31:1695–1709. doi: 10.1038/onc.2011.359. [DOI] [PMC free article] [PubMed] [Google Scholar]
- Svenneby G, Torgner IA. Localization and function of glutamine synthetase and glutaminase. Biochem Soc Trans. 1987;15:213–215. doi: 10.1042/bst0150213. [DOI] [PubMed] [Google Scholar]
- Vander Heiden MG, Cantley LC, Thompson CB. Understanding the Warburg effect: the metabolic requirements of cell proliferation. Science. 2009;324:1029–1033. doi: 10.1126/science.1160809. [DOI] [PMC free article] [PubMed] [Google Scholar]
- Walz S, Lorenzin F, Morton J, Wiese KE, von Eyss B, Herold S, Rycak L, Dumay-Odelot H, Karim S, Bartkuhn M, Roels F, Wustefeld T, Fischer M, Teichmann M, Zender L, Wei CL, Sansom O, Wolf E, Eilers M. Activation and repression by oncogenic MYC shape tumour-specific gene expression profiles. Nature. 2014;511:483–487. doi: 10.1038/nature13473. [DOI] [PMC free article] [PubMed] [Google Scholar]
- Wise DR, DeBerardinis RJ, Mancuso A, Sayed N, Zhang XY, Pfeiffer HK, Nissim I, Daikhin E, Yudkoff M, McMahon SB, Thompson CB. Myc regulates a transcriptional program that stimulates mitochondrial glutaminolysis and leads to glutamine addiction. Proc Natl Acad Sci U S A. 2008;105:18782–18787. doi: 10.1073/pnas.0810199105. [DOI] [PMC free article] [PubMed] [Google Scholar]
- Wise DR, Thompson CB. Glutamine addiction: a new therapeutic target in cancer. Trends Biochem Sci. 2010;35:427–433. doi: 10.1016/j.tibs.2010.05.003. [DOI] [PMC free article] [PubMed] [Google Scholar]
- Wu H, Zhang Y. Reversing DNA methylation: mechanisms, genomics, and biological functions. Cell. 2014;156:45–68. doi: 10.1016/j.cell.2013.12.019. [DOI] [PMC free article] [PubMed] [Google Scholar]
- Yuneva MO, Fan TW, Allen TD, Higashi RM, Ferraris DV, Tsukamoto T, Mates JM, Alonso FJ, Wang C, Seo Y, Chen X, Bishop JM. The metabolic profile of tumors depends on both the responsible genetic lesion and tissue type. Cell Metab. 2012;15:157–170. doi: 10.1016/j.cmet.2011.12.015. [DOI] [PMC free article] [PubMed] [Google Scholar]
Associated Data
This section collects any data citations, data availability statements, or supplementary materials included in this article.