

Abstract
A comprehensive glycan map was constructed for the top eight abundant plasma glycoproteins using both specific and non-specific enzyme digestions followed by nano LC–Chip/QTOF mass spectrometry (MS) analysis. Glycopeptides were identified using an in-house software tool, GPFinder. A sensitive and reproducible multiple reaction monitoring (MRM) technique on a triple quadrupole MS was developed and applied to quantify immunoglobulins G, A, M, and their site-specific glycans simultaneously and directly from human serum without protein enrichments. A total of 64 glycopeptides and 15 peptides were monitored for IgG, IgA, and IgM in a 20-min UPLC gradient. The absolute protein contents were quantified using peptide calibration curves. The glycopeptide ion abundances were normalized to the respective protein abundances to separate protein glycosylation from protein expression. This technique yields higher method reproducibility and less sample loss when compared to quantitation methods that involve protein enrichments. The absolute protein quantitation has a wide linear range (3-4 orders of magnitude) and low limit of quantitation (femtomole level). This rapid and robust quantitation technique, which provides quantitative information for both proteins and glycosylation, will further facilitate disease biomarker discoveries.
Keywords: Immunoglobulin, Absolute Quantitation, Glycopeptide, Site Specific Glycan Analysis
Introduction
Changes in post-translation modifications such as glycosylation are the hallmark of many common diseases.1-4 The most extensively studied example is the lack of galactosylation of IgG in several autoimmune diseases such as rheumatoid arthritis, systemic lupus erythematosus, and Crohn's disease.5, 6 Another example is the aberrant O-linked galactosylation and N-linked sialylation of serum IgA1 in primary IgA nephropathy and primary Sjögren's syndrome, respectively.7-10 Monitoring protein specific glycosylation remains an active goal for monitoring diseases because glycosylation is highly sensitive to local and global biological changes.11
However, site-specific glycosylation analysis is a challenging task that involves the determination of both the glycosylation site and the glycan microheterogeneity. One popular approach is to monitor the global changes in glycosylation by releasing glycans from a protein mixture.12-15 The released glycan analysis however provides no protein-specific information. Additionally, quantitation of glycosylation on the site-specific level is of great interest, but it is currently limited to gross comparisons due to the lack of glycan/glycopeptide standards. For relative comparison, glycan ion abundances are usually normalized to the most abundant glycan or the total glycan ion abundance for relative comparison.1, 16 Because glycan abundances in biological fluids are greatly affected by protein concentration, direct comparison of released glycan abundance may not yield information related to protein expression. Indeed, it has been shown that proteins may decrease while specific glycoforms increase in some diseases states.17 Thus, it is necessary to monitor protein content and degree of glycosylation simultaneously for disease biomarker discovery.
Site-specific glycosylation of many of the abundant glycoproteins in serum has been explored using different approaches by several groups.16, 18-28 A typical approach is the LCMS/MS analysis of glycopeptides yielded by specific proteases.18, 24 An improvement involves enrichment of specifically glycosylated peptides followed by glycopeptide or released glycan and peptide analysis.29, 30 However, often these studies yield mainly partial glycan heterogeneity or incomplete site-specific information. For this reason, the site specific glycan heterogeneity of even common and abundant immunoglobulins with multiple sites of glycosylation such as IgA and IgM are not well fully described.29, 31, 32
The large interest in glycomic and glycoproteomic biomarkers necessitates the glycan maps of proteins. In this research, we begin this effort by constructing comprehensive glycan maps of the common glycoproteins in serum proteins where each site is characterized for glycan heterogeneity. Both specific and non-specific proteases, trypsin and pronase E, were applied to obtain comprehensive site-specific N-glycan maps of the top abundant serum glycoproteins. An in-house software tool, GPFinder, was used to assign glycopeptides based on the LC-MS/MS analysis.33 The specificity of trypsin yields well-defined peptides suitable for quantitation but may provide limited glycosite information mainly due to large peptide size or presence of multiple glycosites. Nonspecific proteases usually produce better glycosite coverage but yield variable peptide sequences that complicate the data analysis and limit its application to quantitation. Combining these two approaches produces a more comprehensive glycan map with extensive site-specific heterogeneity. The tryptic map is then used to set the multiple reaction monitoring (MRM) conditions to monitor site-specific glycoforms. Nonspecific glycan map is not used for quantitation due to the variable peptide sequence.
Multiple reaction monitoring is well-known for its sensitivity and specificity in quantitation. Yet, this powerful technique has been used on limited bases to examine glycopeptides.34-38 In our previous study, we employed MRM to monitor site-specific IgG glycosylation. To decouple glycan and protein expression, the glycan abundances were normalized to protein concentration that represented by its peptide abundance.39 In the present application, we significantly expand this method to IgG, IgA, and IgM. While the three proteins represent a limited and focused application, it still represents the most extensive use of MRM on glycopeptides to date. Furthermore, this MRM method can be readily implemented to a much larger group of serum proteins utilizing the resulting glycan maps. The method for monitoring site-specific glycosylation is attractive because it is especially fast with UPLC separation and convenient with little sample pretreatment. It will find immediate applications in monitoring and diagnosing diseases.
Experimental Procedures
The experimental procedures are briefly described here. A detailed version can be found in the supplementary information.
Chemicals and Reagents
Immunoglobulin G and M, transferrin, haptoglobin, alpha-2-macroglobulin, alpha-1-antitrypsin, complement C3, and alpha-1-acid glycoprotein purified from human serum were purchased from Sigma-Aldrich (St. Louis, MO). Immunoglobulin A purified from human plasma was purchased from CalBiochem (La Jolla, CA). Anti-human-IgA (α-chain specific)-agarose and anti-human-IgM (μ-chain specific)-agarose used for protein enrichment were purchased from Sigma-Aldrich (St. Louis, MO). Sequencing grade modified trypsin and dithiothreitol (DTT) were purchased from Promega (Madison, WI). Pronase E from Streptomyces griseus and iodoacetamide (IAA) were purchased from Sigma-Aldrich (St. Louis, MO).
Plasma Sample Collection
Healthy volunteers (n=13) were recruited during routine outpatient clinic visits or through approved flyers. Following venipuncture and blood sampling, plasma was isolated via use of a Ficoll-Paque (p=1.077 g/ml) gradient. All research was approved by the UC Davis Institutional Review Board (IRB). One pooled human serum sample was purchased from Sigma-Aldrich (St. Louis, MO) for method development. All plasma samples were stored at − 80 °C prior to sample preparation.
Protein Enrichment and Proteolysis
The sample treatment is described briefly here, more details can be found in the supplementary information. Briefly, amount of 10 μL anti-human-IgA (α-chain specific)-agarose and 10 μL anti-human-IgM (μ-chain specific)-agarose were applied to enrich IgA and IgM proteins from 5 μL of plasma. Both native plasma samples and enriched proteins were treated using pronase E and trypsin for glycan mapping. The tryptic digests were also used for quantitation.
LC-MS Analysis
The glycan mapping was performed on an Agilent 1200 series HPLC-Chip system coupled to an Agilent 6520 Q-TOF (Agilent Technologies, Santa Clara, CA). Agilent Zorbax C18 stationary phase (300 Å, 5 μm) and porous graphitized carbon (250 Å, 5 μm) stationary phase were used to separate the trypsin digest and pronase digest, respectively. The microfluidic C18 chip consists of two columns: one for enrichment (4 mm, 40 nL) and one for separation (150 mm × 75 μm). The microfluidic PGC chip also consists of one enrichment column (4 mm, 40 nL) and one separation column (43 mm × 75 μm).
The quantitative analyses were performed on an Agilent 1290 infinity LC system coupled to an Agilent 6490 triple quadrupole (QqQ) mass spectrometer (Agilent Technologies, Santa Clara, CA). An Agilent Eclipse plus C18 (RRHD 1.8 μm, 2.1 × 100 mm) coupled with an Agilent Eclipse plus C18 pre-column (RRHD 1.8 μm, 2.1 × 5 mm) was used for UPLC separation.
Data Analysis
An in-house software, GPFinder,33 was applied to identify glycopeptides based on the glycan fragmentation and accurate mass. Briefly, common glycan oxonium fragments, such as m/z 204.08 (HexNAc), 366.14 (Hex1HexNAc1), 292.09 (Neu5Ac) and 657.24 (Hex1HexNAc1Neu5Ac1) were used to identify glycopeptide candidates from the complete peptide ion list. The glycopeptide candidate ion list was matched to the theoretical glycopeptide masses, which was generated from an in-house plasma N-glycan library and the protein sequence40. A score was generated to evaluate the confidence of each match on the basis of the mass accuracy and glycan fragmentation pattern. A glycopeptide list with known glycan and peptide compositions was thus obtained using a 5% false discovery rate as the cutoff (confidence level = 95%). MRM results were analyzed using Agilent MassHunter Quantitative Analysis B.5.0 software. The limit of detection (LOD) and limit of quantitation (LOQ) were defined as signal-to-noise ratio (S/N) ≥ 3 and 6, respectively.
Results and Discussion
We present here a comprehensive N-glycan map for plasma glycoproteins utilizing both specific and non-specific proteases, and a targeted multiple reaction monitoring (MRM) method to quantify absolute protein content and the relative quantity of their glycosylation at the site-specific level simultaneously from plasma samples. We select a subset of this group, the antibody proteins, for illustrative purposes. As shown in Supplementary Figure S-1 for transferrin and haptoglobin, this method can be further expanded to quantitate the other proteins described in this study along with their site-specific glycosylation, although protein enrichment may be required to increase the signal of the lower abundant proteins. The quantitation of glycopeptides from IgG, IgA, and IgM is performed directly from 2 μL of plasma without protein enrichments using a 20-min UPLC gradient.
Comprehensive glycan map of selected glycoproteins in plasma
Both specific protease (trypsin) and non-specific protease (pronase E) were employed to obtain a more comprehensive glycan map. The specificity of trypsin yields well-defined peptides suitable for quantitation but may provide limited glycosite information depending on the protein sequence. One reason is that multiple glycosites may be present on a single tryptic peptide making glycan assignment by tandem MS difficult. Possible missed-cleavages may yield large peptide not readily characterized by collision-induced dissociation (CID). Conversely, non-specific proteases usually yield more glycosite information and provides more glycopeptide isoform information.41 However, the cocktail of non-specific proteases may produce peptides that are too small and may not designate the site. Employing both allows more complete site mapping.
Take alpha-2 macroglobulin (A2MG) as an example. With trypsin, only two out of eight glycosites were observed, i.e. N869 and 1424 (Table 1). In a previous glycan map using chymotrypsin, another specific protease, three out of the eight glycosites, i.e. site 70, 396, and 1424, were observed containing similar glycoforms identified in this study.24 As listed in Table 2, the cocktail of pronase provides better glycosite coverage yielding full glycan map for all the eight sites. High mannose, hybrid and complex type's glycans were all observed on site 869, which was consistent with the previous finding.42 The biantennary sialylated glycans were the most common glycoforms observed on other sites. Bisecting complex type glycans were also observed on site 70 and 991, and tri- and tetra- antennary types were observed on site 247 and 410. The use of non-specific proteases generally yielded more sites, but they sometimes yielded ambiguous glycopeptide assignments. When there is ambiguity in glycosite assignments, the results are not used to reduce false positives (Table 2). On occasions, trypsin may provide more site heterogeneity as shown for site 1424 in Table 1. Combining the two types of proteases, specific and non-specific, provides a more complete glycan map for alpha-2 macroglobulin (Table 3).
Table 1. Trypsin glycan map for alpha-2 macroglobulin.
| Glycopep. Mass (Da) | RT | Glycosite | Peptide Sequence | Hex-HexNAc-Fuc-Neu5Ac | Ion Abund.* | Rel.* | |
|---|---|---|---|---|---|---|---|
| Exp. | Cal. | ||||||
| 4595.034 | 4595.086 | 28.7 | 869 | SLGNVNFTVSAEALESQELCGTEVPSVPEHGRK | 4-2-0-0 | 185585 | 6.4% |
| 4757.104 | 4757.138 | 28.7 | 869 | SLGNVNFTVSAEALESQELCGTEVPSVPEHGRK | 5-2-0-0 | 2694326 | 61.3% |
| 4075.803 | 4075.851 | 44.4 | 1424 | VSNQTLSLFFTVLQDVPVR | 5-4-0-1 | 1700837 | 16.6% |
| 4221.902 | 4221.908 | 44.4 | 1424 | VSNQTLSLFFTVLQDVPVR | 5-4-1-1 | 2272376 | 22.2% |
| 4366.905 | 4366.946 | 45.5 | 1424 | VSNQTLSLFFTVLQDVPVR | 5-4-0-2 | 5617431 | 54.8% |
| 4512.947 | 4513.004 | 45.6 | 1424 | VSNQTLSLFFTVLQDVPVR | 5-4-1-2 | 668015 | 6.5% |
Absolute and relative ion abundance from LC-Q-TOF full scans
Table 2. Pronase E glycan map for alpha-2 macroglobulin§.
| Glycopep. Mass (Da) | RT | Glycosite | Peptide Sequence | Hex-HexNAc-Fuc-Neu5Ac | |
|---|---|---|---|---|---|
| Exp. | Cal. | ||||
| 3316.301 | 3316.312 | 37.3 | 55 | SYLNETVTVS | 5-4-0-2 |
| 2812.052 | 2812.043 | 25.8 | 55 | NETV | 5-4-1-2 |
| 3462.358 | 3462.370 | 37.6 | 55 | SYLNETVTVS | 5-4-1-2 |
| 2601.042 | 2601.055 | 23.2 | 70 | SVRGNR | 5-4-0-1 |
| 2706.063 | 2706.050 | 24.2 | 70 | RGNR | 5-4-0-2 |
| 2892.137 | 2892.150 | 24.7 | 70 | SVRGNR (VRGNRS) | 5-4-0-2 |
| 3134.26 | 3134.277 | 26.4 | 70 | LESVRGNR | 5-4-0-2 |
| 3308.343 | 3308.341 | 25.1 | 70 | SLESVRGNRS | 5-4-0-2 |
| 2747.102 | 2747.113 | 25.9 | 70 | SVRGNR (VRGNRS) | 5-4-1-1 |
| 2989.229 | 2989.239 | 26.9 | 70 | LESVRGNR | 5-4-1-1 |
| 3163.301 | 3163.303 | 24.0 | 70 | SLESVRGNRS | 5-4-1-1 |
| 2852.105 | 2852.108 | 27.0 | 70 | RGNR | 5-4-1-2 |
| 3038.19 | 3038.208 | 28.3 | 70 | SVRGNR (VRGNRS) | 5-4-1-2 |
| 2852.105 | 2852.096 | 26.8 | 70 | VRGN | 5-5-0-2 |
| 2458.896 | 2458.904 | 24.3 | 247 | EEEMNVS | 5-4-0-0 |
| 2749.99 | 2749.999 | 26.6 | 247 | EEEMNVS | 5-4-0-1 |
| 2855.007 | 2854.994 | 28.4 | 247 | EEEMN | 5-4-0-2 |
| 3041.084 | 3041.095 | 28.7 | 247 | EEEMNVS | 5-4-0-2 |
| 3803.496 | 3803.478 | 48.9 | 247 | ILEEEMNVSVCG (LEEEMNVSVCGL) | 6-5-1-1 |
| 2595.938 | 2595.943 | 21.4 | 396 | SNAT | 5-4-0-2 |
| 2922.051 | 2922.069 | 35.4 | 396 | YYSNAT | 5-4-0-2 |
| 3135.133 | 3135.144 | 25.0 | 396 | EANYYSNA (SNATTDEHG) | 5-4-0-2 |
| 3138.151 | 3138.144 | 50.2 | 396 | YYSNATTD | 5-4-0-2 |
| 2450.92 | 2450.905 | 19.3 | 396 | SNAT | 5-4-1-1 |
| 2579.887 | 2579.948 | 22.8 | 396 | NATTD | 5-4-1-1 |
| 2741.998 | 2742.001 | 25.2 | 396 | SNAT | 5-4-1-2 |
| 2870.976 | 2871.043 | 26.2 | 396 | NATTD | 5-4-1-2 |
| 2198.868 | 2198.857 | 18.8 | 410 | INTT | 4-4-0-1 |
| 2285.884 | 2285.889 | 20.2 | 410 | SINTT | 4-4-0-1 |
| 2360.911 | 2360.910 | 19.3 | 410 | INTT | 5-4-0-1 |
| 2447.952 | 2447.942 | 21.2 | 410 | SINTT | 5-4-0-1 |
| 2594.991 | 2595.010 | 27.5 | 410 | FSINTT | 5-4-0-1 |
| 2652.026 | 2652.005 | 23.9 | 410 | INTT | 5-4-0-2 |
| 2506.979 | 2506.968 | 23.6 | 410 | INTT | 5-4-1-1 |
| 4828.829 | 4828.841 | 49.9 | 410 | QFSINTTNVMGT | 7-6-0-4 |
| 1950.746 | 1950.731 | 18.4 | 869 | GNVN | 4-3-0-1 |
| 2153.816 | 2153.810 | 18.3 | 869 | GNVN | 4-4-0-1 |
| 2602.045 | 2602.043 | 29.6 | 869 | NVNFTVSA (SLGNVNFT) | 4-4-0-1 |
| 1618.616 | 1618.609 | 16.1 | 869 | GNVN | 5-2-0-0 |
| 2066.835 | 2066.841 | 27.4 | 869 | NVNFTVSA(SLGNVNFT) | 5-2-0-0 |
| 2112.789 | 2112.784 | 17.2 | 869 | GNVN | 5-3-0-1 |
| 2315.875 | 2315.863 | 19.1 | 869 | GNVN | 5-4-0-1 |
| 2515.972 | 2515.979 | 23.0 | 869 | SLGNVN | 5-4-0-1 |
| 2764.092 | 2764.096 | 29.6 | 869 | NVNFTVSA (SLGNVNFT) | 5-4-0-1 |
| 2483.902 | 2483.894 | 20.4 | 869 | NF | 5-4-0-2 |
| 2606.964 | 2606.959 | 23.4 | 869 | GNVN | 5-4-0-2 |
| 3055.179 | 3055.191 | 33.4 | 869 | NVNFTVSA (SLGNVNFT) | 5-4-0-2 |
| 2274.844 | 2274.837 | 18.5 | 869 | GNVN | 6-3-0-1 |
| 2723.063 | 2723.069 | 29.4 | 869 | NVNFTVSA (SLGNVNFT) | 6-3-0-1 |
| 2531.941 | 2531.938 | 22.6 | 991 | NETQQ | 5-4-0-1 |
| 2694.976 | 2694.975 | 23.4 | 991 | NETQ | 5-4-0-2 |
| 2823.053 | 2823.033 | 23.8 | 991 | NETQQ | 5-4-0-2 |
| 2936.129 | 2936.117 | 25.7 | 991 | LNETQQ (NETQQL) | 5-4-0-2 |
| 2958.068 | 2958.091 | 49.5 | 991 | DYLNET | 5-4-0-2 |
| 3170.236 | 3170.243 | 49.9 | 991 | VLDYLNET | 5-4-0-2 |
| 3895.589 | 3895.614 | 36.5 | 991 | DYLNETQQLTPEIK | 5-4-0-2 |
| 4107.748 | 4107.723 | 37.7 | 991 | LFAPNIYVLDYLN | 5-5-1-2 |
| 2704.068 | 2704.059 | 20.0 | 1424 | DKVSNQT | 5-4-0-1 |
| 2789.141 | 2789.148 | 19.8 | 1424 | KVSNQTLS | 5-4-0-1 |
| 2565.93 | 2565.932 | 21.4 | 1424 | NQT | 5-4-0-2 |
| 2995.151 | 2995.155 | 23.3 | 1424 | DKVSNQT | 5-4-0-2 |
| 3080.232 | 3080.244 | 22.4 | 1424 | KVSNQTLS | 5-4-0-2 |
| 2850.12 | 2850.117 | 23.4 | 1424 | DKVSNQT | 5-4-1-1 |
| 2935.203 | 2935.206 | 23.7 | 1424 | KVSNQTLS | 5-4-1-1 |
| 3141.242 | 3141.212 | 24.2 | 1424 | DKVSNQT | 5-4-1-2 |
| 2144.800 | 2144.799 | 17.5 | 247 (869) | NV | 5-4-0-1 |
| 2423.867 | 2423.858 | 19.4 | 396 (1424) | SN | 5-4-0-2 |
| 2520.929 | 2520.922 | 20.4 | 396 (410) | SNATTD (QFSIN) | 5-4-0-1 |
| 2812.052 | 2812.017 | 25.8 | 396 (410) | SNATTD (QFSIN) | 5-4-0-2 |
| 2666.993 | 2666.980 | 22.2 | 396 (410) | SNATTD (QFSIN) | 5-4-1-1 |
| 2958.079 | 2958.075 | 27.5 | 396 (410) | SNATTD (QFSIN) | 5-4-1-2 |
| 3881.579 | 3881.562 | 36.0 | 396 (410) | NATTDEHGLVQFSI (ATTDEHGLVQFSIN) | 5-4-1-2 |
| 2361.881 | 2361.869 | 17.5 | 410 (1424) | NTTN (SNQT) | 5-4-0-1 |
| 2474.958 | 2474.953 | 20.1 | 410 (1424) | INTTN (DKVSN, SNQTL) | 5-4-0-1 |
| 2652.977 | 2652.964 | 21.7 | 410 (1424) | NTTN (SNQT) | 5-4-0-2 |
| 2507.939 | 2507.927 | 19.6 | 410 (1424) | NTTN (SNQT) | 5-4-1-1 |
| 2275.839 | 2275.821 | 18.3 | 55 (991, 247) | NET (NET, MNV) | 5-4-0-1 |
| 2566.912 | 2566.916 | 22.5 | 55 (991, 247) | NET (NET, MNV) | 5-4-0-2 |
| 2421.888 | 2421.879 | 20.1 | 55 (991, 247) | NET (NET, MNV) | 5-4-1-1 |
| 2712.978 | 2712.974 | 26.8 | 55 (991, 247) | NET (NET, MNV) | 5-4-1-2 |
| 2549.952 | 2549.949 | 20.7 | 70 (869) | RGN (NVN) | 5-4-0-2 |
| 2695.978 | 2695.995 | 25.4 | 70 (869) | RGN (NVN) | 5-4-1-2 |
| 3426.349 | 3426.371 | 49.3 | 70(991) | GNRSLFTDLEA(VLDYLNETQQ) | 5-4-0-2 |
| 2404.899 | 2404.900 | 18.4 | 869 (70) | NVN (RGN; GNR) | 5-4-1-1 |
No glycoform abundance is listed because the same glycoform is spread out on different peptide sequences
Table 3. Site-specific glycan map for top eight abundant glycoproteins in normal serum§.
| Protein (Uniprot ID) | Glycosite | Glycoform observed* | Literature# | |
|---|---|---|---|---|
| Transferrin (P02787) | …NYN432K… | 5402 | 5402 (predominant), 5401, 5412, 652018 | |
| …GSN630V… | 5402, 5412, 6503, 6513 | 5402 (predominant), 5412, 5401, 5422, 6502, 651218 | ||
| …IN491HC… | ND | 540256 | ||
| IgA (Fc) IgA1 (P01876), IgA2 (P01877) | …EAN144(IgA1)/131(IgA2)L… | 4400, 5400, 3500, 4500, 5500, 4401, 5401, 5402, 4501, 5501, 5502 | Released analysis15, 29 | |
| …TAN205I(IgA2)… | 5410, 5411, 5412, 4510, 5510, 5511, 5512 | |||
| …HVN340V (IgA1)… | 4410, 4411, 5410, 5411, 5412, 5510, 5511, 5512, 6511 | |||
| Ig Joining Chain (P01876) | …REN71I… | 5401, 5411, 5412 | 5400, 5410, 5401, 5402, 541232 | |
| α2-macroglobulin (P01023) | …YLN55E… | 5402, 5412 | ND | |
| …GN70R… | 5401, 5411, 5402, 5412, 5502 | 5401, 5411, 5402, 541224 | ||
| …EMN247V… | 5400, 5401, 5402, 6511 | ND | ||
| …YSN396A… | 5401, 5402, 5411, 5412 | 5401, 5411, 5402, 541224 | ||
| …SIN410T… | 4401, 5401, 5411, 5402, 7604 | 5401, 5411, 540224 | ||
| …NVN869F… | 4301, 4401, 5401, 5402, 4200, 5200, 5301, 6301 | Man, complex type42 | ||
| …YLN991E… | 5401, 5402, 5512 | ND | ||
| …VSN1424Q… | 5401, 5411, 5402, 5412 | ND | ||
| IgM (Fc, P01871) | …N46NSD… | 4311, 4401, 5401, 5411, 5412, 5501, 5511, 5502 | mono-, bi-, tri-antennary, bisecting, hybrid32 | |
| …QQN209A… | 5410, 5411, 5412, 4511, 5511, 5512 | |||
| …HTN272I… | 5411 | |||
| …HPN279A… | 5300, 5200, 6200, 7200, 8200, 9200 | Man5→932 | ||
| …LYN439V… | 5200, 6200, 7200, 8200 | |||
| α1-antitrypsin (P01009) | …STN70I… | 5402, 5412 | bi-, tri-antennary19, 57 | |
| …NFN107L… | 5402, 5412, 6503, 6513 | bi, tri, tetra-antennary19, 57 | ||
| …LGN271A… | 4301, 5401, 5402, 5412, 6503, 6513 | bi-antennary19, 57 | ||
| Complement C3 (P01024) | …MGN85V… | 3200, 5200, 6200, 7200, 6301 | Man5, 622 | Man9+Glc58 |
| …MN939K… | 8200, 9200 | Man8, 922 | ||
| …KPN1617L… | 9200, 10-000 | |||
| Haptoglobin (P00738) | …HHN184L… | 5401, 5402, 5512, 6503 | 5401, 5402, 5411, 5412, 6501, 6502, 6503, 651321 | |
| …LFLN207H… | 5401, 5402, (5411, 6502, 6503) | 5401, 5402, 6502, 6503, 65133 | ||
| …SEN211A… | 5401, 5402, (5411, 6502, 6503) | 5401, 5402, 6502, 6503, 65133 | ||
| …HPN241Y… | 5402, 6501, 6502, 6503, 6512, 6513 | ND | ||
| α1-acid glycoprotein 1 (A1AG1, P02763), α1-acid glycoprotein 2 (A1AG2, P19652) | …ITN33A… | 4401, 5401, 5402, 5501, 5502, 5512, 6501, 6511, 6502, 6512, 6503, 6513 | bi-, tri-, tetra-antennary (+S)/(+F)25, 26 | |
| …EYN56K… | 4301, 4401, 5401, 5402, 5412, 6502, 6512, 6503, 6513 | bi-, tri-antennary (+S)/(+F)25, 26 | ||
| …TPN72K… | 6502, 6503, 6513, 7602, 7612, 7603, 7613, 7604, 7614, 8703 | bi-, tri-, tetra-antennary (+S)/(+F)25, 26 | ||
| …YN93TT…(A1AGP1) | 6503, 6513, 7602, 7612, 7603, 7613, 7604, 7614, 8704 | tri-, tetra-, penta-, Hexa-antennary (+S)/(+F)25, 26 | ||
| …EN103GT… | 6503 | tri-, tetra-, penta-, Hexa-antennary (+S)/(+F)25, 26 | ||
Glycan profile may change in disease states
Glycan composition: Hex-HexNAc-Fuc-Neu5Ac
ND: no determined
Two other examples used for illustrative purposes are human IgA and IgM including their joining chain (Ig J chain). Human IgA has two subclasses: IgA1 and IgA2. IgA1 contains two N-glycosites (N144 and 340) on its Fc region, while IgA2 has five N-glycosites (N47, 92, 131, 205, and 327). IgM does not have subclasses, but also contains multiple glycosites (N46, 209, 272, 279, and 439) on the Fc region. Both immunoglobulins may also include a glycosylated joining (J) chain (18 kDa, UniProtKB ID: P01876), which help them polymerization. Glycan maps of these large protein complexes have generally been challenging, and only partial glycan maps were obtained in the previous studies. Table 3 summarizes the results obtained in this study and compared to the previous findings. As with the other proteins, nonspecific proteases yielded better glycosite coverage, while specific proteases provide further complementary information. Our glycan map shown in Figure 1 supports that site N279, 439 of IgM contain high mannose type glycans, while other sites contain complex type glycans (mono-, bi-, tri-antennary, bisecting) with more specific glycoform information provided using our comprehensive glycan map method.32 The glycan map for IgA shows site N144 of IgA1 and N131 of IgA2 contains no fucosylation, while glycoforms on N205 of IgA2 and N340 of IgA1 are all fucosylated. Our results do not support plasma IgA2 glycosylation at N47, 92, and 327 as has been reported for secretory IgA2 in milk and saliva, suggesting variations between tissues.43, 44 The component IgA2 is much less abundant in plasma than IgA1 (IgA1:IgA2 = 9:1).45 The lack of glycosylation in the above sites may be due to the low IgA2 concentrations and low glycosylation expressions on these sites. Furthermore, site N92 contains a proline residue nearby that may decrease the extent of glycosylation as described previously.11, 46
Figure 1.
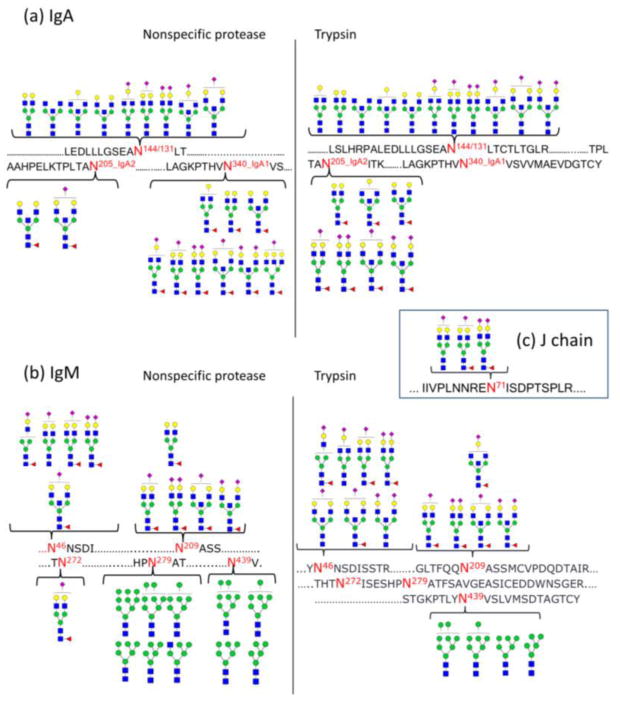
Site-specific glycan mapping for IgA an IgM using specfic and non-specfic proteases. (a) Glycan map for IgA. IgA1 glycosite N144 and IgA2 glycosite N131 share the same tryptic peptide, thus cannot be distinguished from each other. While no fucosylation were observed for glycosite N144/131, glycans on glycosite N205 (IgA2) and N340 (IgA2) are all fucosylated. (b) Glycan map for IgM. Glycans on site N46, N209 and N272 are all highly sialylated, while mostly high mannose type glycans were observed on site N279 (one hybrid-type glycan identified) and N439. (c) Three glycans were observed for J chain. Symbol key: yellow circles = galactose (Gal); green circles = mannose (Man); blank circles = hexose (Hex); blue squares = N-acetylglucosamine (GlcNAc); yellow squares = Nacetylgalactosamine (GalNAc); red triangles = fucose (Fuc); purple diamonds = Nacetylneuraminic acid (Neu5Ac).
The glycan map method was further expanded to transferrin, haptoglobin, alpha-2 macroglobulin, alpha-1-antitrypsin, complement C3, and alpha-1 acid glycoprotein from normal plasma. The glycan map for these proteins including results from previous studies is summarized in Table 3. The glycosylation of IgG has been characterized in great detail previously, and is not presented here.16,28,47-49
Protein and site-specific glycan quantitation using MRM of antibody proteins
As shown in Table 3, glycoproteins have large N-glycan microheterogeneity. MRM is used to determine absolute protein amounts while monitoring site-specific glycosylation. For the MRM, we focus on the antibody proteins. However, the method can be applied to any or all of the proteins characterized in this study (Figure S-1) with protein enrichment to increase the signal of low abundant proteins and the specificity of quantitation.
Commercially available immunoglobulin standards were used to develop the MRM methods. The MRM transitions for IgG were obtained in a previous study.39 Those used in this study are listed in Table S-1. The IgA and IgM tryptic glycopeptides were first profiled using nano-LC/QTOF, and their fragmentation behavior was characterized by CID. Shown in Figure 2a and 2b are the tandem MS of two selected glycopeptides. More examples can be found in Figure S-2. Small glycan fragment “oxonium” ions, such as m/z 204.08 (HexNAc), 366.14 (Hex1HexNAc1), 292.09 (Neu5Ac), and 657.24 (Hex1HexNAc1Neu5Ac1), are the most common and abundant fragment ions of glycopeptides under CID. Because of its strong abundances in nearly all the glycopeptide tandem mass spectra, the fragment ion, m/z 366.1, was selected as the MRM product ion for the complex-type glycans. High mannose-type glycans do not produce the same glycan fragment ions in sufficient abundances (Figure 2c). Instead, they yield abundant peptide–GlcNAc fragment ions under CID. These fragment ions were thus monitored for the high mannose type glycans. The collision conditions were optimized to yield the highest abundances of this species, and the MRM transitions for IgA and IgM are listed in Table 4.
Figure 2.
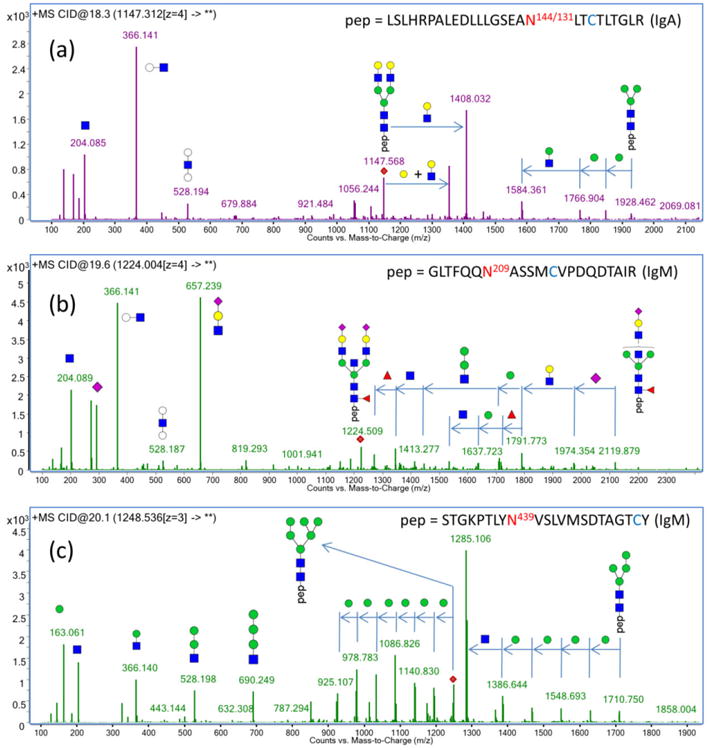
Representative fragmentation spectra for glycopeptides with a neutral glycan (a), a sialylated glycan (b), and a high mannose glycan (c) show mainly glycan fragments using CID. Common fragments such as m/z 204.08 (HexNAc), 366.14 (Hex1HexNAc1), 292.09 (Neu5Ac) and 657.24 (Hex1HexNAc1Neu5Ac1) were used to identify glycopeptide candidates from the peptide ion pool. High mannose glycopeptides also produce abundant peptide–GlcNAc fragments. These abundant fragment ions were monitored in the MRM transition and optimized to obtain the maximum sensitivity.
Table 4. MRM transition list for IgA and IgM.
| Protein | Peptide | Glycan* | Precursor Ion (m/z) | Product Ion (m/z) | RT (min) | Collision Energy (eV) |
|---|---|---|---|---|---|---|
| IgA2 | TPLTAN205ITK | 5410 | 909.8 | 366.1 | 6.22 | 19 |
|
|
||||||
| 5510 | 977.5 | 366.1 | 6.36 | 25 | ||
|
|
||||||
| 4510 | 923.5 | 366.1 | 6.48 | 18 | ||
|
|
||||||
| 5411 | 1006.8 | 366.1 | 6.9 | 25 | ||
|
|
||||||
| 5511 | 1074.5 | 366.1 | 6.94 | 25 | ||
|
|
||||||
| 5412 | 1103.8 | 366.1 | 7.52 | 25 | ||
|
|
||||||
| 5512 | 878.9 | 366.1 | 7.66 | 17 | ||
| IgA1, 2 | LSLHRPALEDLLLGSEAN144/131LT | 5501 | 1016.9 | 366.1 | 15.95 | 25 |
| CTLTGLR | 5401 | 976.3 | 366.1 | 15.96 | 25 | |
|
|
||||||
| 3500 | 1117.1 | 366.1 | 16 | 25 | ||
|
|
||||||
| 4500 | 1157.6 | 366.1 | 16 | 25 | ||
|
|
||||||
| 5400 | 1147.3 | 366.1 | 16 | 25 | ||
|
|
||||||
| 5500 | 1198.1 | 366.1 | 16 | 25 | ||
|
|
||||||
| 4401 | 943.9 | 366.1 | 16.01 | 20 | ||
|
|
||||||
| 4501 | 1230.4 | 366.1 | 16.01 | 30 | ||
|
|
||||||
| 5402 | 1292.9 | 366.1 | 16.19 | 30 | ||
|
|
||||||
| 5502 | 1075.1 | 366.1 | 16.4 | 25 | ||
|
|
||||||
| IgA1 | 213TPLTATLSK221 | — | 466.3 | 415.8 | 9.03 | 15 |
|
|
||||||
| IgA1 | 154DASGVTFTWTPSSGK168 | — | 770.9 | 475.3 | 12.73 | 20 |
|
|
||||||
| IgA2 | 141DASGATFTWTPSSGK155 | — | 756.9 | 475.3 | 11.91 | 25 |
|
|
||||||
| IgA1, 2 | 276YLTWASR282 | — | 448.7 | 620.3 | 10.78 | 12 |
|
|
||||||
| IgA1, 2 | 264WLQGSELPR273 | — | 607.4 | 914.5 | 11.37 | 18 |
|
|
||||||
| IgM | YKN46NSDISSTR | 5501 | 851.1 | 366.1 | 2.18 | 14 |
|
|
||||||
| 4401 | 1012.8 | 366.1 | 2.19 | 25 | ||
|
|
||||||
| 5411 | 1115.5 | 366.1 | 2.19 | 25 | ||
|
|
||||||
| 4311 | 993.8 | 366.1 | 2.21 | 25 | ||
|
|
||||||
| 5511 | 1183.2 | 366.1 | 2.27 | 25 | ||
|
|
||||||
| 5601 | 901.9 | 366.1 | 2.27 | 14 | ||
|
|
||||||
| 5412 | 909.6 | 366.1 | 2.3 | 14 | ||
|
|
||||||
| 5502 | 923.9 | 366.1 | 2.3 | 19 | ||
|
|
||||||
| IgM | GLTFQQN209ASSMCVPDQDTAIR | 5411 | 1100.5 | 366.1 | 12.37 | 19 |
|
|
||||||
| 5511 | 1151.3 | 366.1 | 12.37 | 25 | ||
|
|
||||||
| 4511 | 1110.8 | 366.1 | 12.41 | 24 | ||
|
|
||||||
| 5412 | 1173.3 | 366.1 | 12.49 | 23 | ||
|
|
||||||
| 5512 | 1224.1 | 366.1 | 12.5 | 25 | ||
|
|
||||||
| IgM | STGKPTLYN439VSLVMSDTAGTCY | 9200 | 1058.3 | 1284.7 | 13.51 | 27 |
|
|
||||||
| 8200 | 1356.6 | 1284.7 | 13.53 | 27 | ||
|
|
||||||
| 7200 | 1302.6 | 1284.7 | 13.55 | 27 | ||
|
|
||||||
| 5200 | 1194.5 | 1284.7 | 13.58 | 27 | ||
|
|
||||||
| 6200 | 1248.5 | 1284.7 | 13.58 | 24 | ||
|
|
||||||
| IgM | STGKPTLYN439VSLVMSDTAGTCY | — | 1183.1 | 342.1 | 14.28 | 38 |
|
|
||||||
| IgM | 65YAATSQVLLPSK76 | — | 639.4 | 331.2 | 11.28 | 15 |
|
|
||||||
| IgM | 301FTCTVTHTDLPSPLK315 | — | 573.0 | 734.9 | 12.07 | 15 |
|
|
||||||
| J Chain | EN71ISDPTSPLR | 5401 | 1048.1 | 366.1 | 9.07 | 25 |
|
|
||||||
| J Chain | IIVPLNNREN71ISDPTSPLR | 5411 | 1052.8 | 366.1 | 12.63 | 24 |
|
|
||||||
| J Chain | IIVPLNNREN71ISDPTSPLR | 5412 | 1125.6 | 366.1 | 12.8 | 18 |
|
|
||||||
| J Chain | 47SSEDPNEDIVER58 | — | 695.3 | 971.5 | 5.78 | 24 |
|
|
||||||
| J Chain | 62IIVPLNNR69 | — | 469.8 | 613.3 | 11.11 | 12 |
Glycan composition: Hex-HexNAc-Fuc-Neu5Ac
Peptide MRM Transitions for Absolute Protein Quantitation
Tryptic peptides that are unique for each protein were monitored to quantify the proteins abundance in the protein mixture. Because the IgA standard used is a mixture of subclasses IgA1 and IgA2, common peptides, YLTWASR and WLQGSELPR which are shared by two subclasses, were monitored to quantify the total IgA content. As listed in Table 4, other peptide candidates monitored for protein quantitation are TPLTATLSK and DASGVTFTWTPSSGK for IgA1, DASGATFTWTPSSGK for IgA2, YAATSQVLLPSK and FTCTVTHTDLPSPLK for IgM, and SSEDPNEDIVER and IIVPLNNR for the joining chain. It was found in our peptide map that IgM glycosite N439 is not completely glycosylated. Thus, its unglycosylated peptide, STGKPTLYNVSLVMSDTAGTCY, was also monitored to study the glycosylation occupancy for this glycosite. Fragmentation behaviors of these peptides under CID were studied, and some selected tandem spectra are shown in Figure S-2. The most abundant fragments, mostly b or y ions, were monitored to increase the MRM sensitivity.39 The MRM transitions and their optimized collision energies for peptide quantitation are listed in Table 4.
Ultra High Performance LC (UPLC)
An UPLC-QqQ method was developed to monitor IgG, IgA, and IgM simultaneously in plasma without protein enrichments. The C18 stationary phase separates glycopeptides mainly on the basis of their peptide moieties (Figure 3), which provides some identity information, i.e. same glycosites elute closely together. In this regard, dynamic MRM whereby transitions were monitored only within specified retention window(s) was applied. The largest differences in retention times are observed between neutral and acidic glycopeptides. For example, glycan 5410 (Hex:HexNAc:Fuc:Neu5Ac) on glycosite N205 of IgA2 elute 0.6 min earlier than 5411 and 1.2 min earlier than 5412 (Figure S-3c, d). The elution behavior of each glycopeptide is an important parameter that provides glycosite information. Signals that do not elute accordingly are likely false positives and are not glycoforms of the peptide. The resulting total MRM chromatogram for an IgG, IgA, and IgM standard mixture (protein concentration = 0.300, 0.197, and 0.165 mg/mL, respectively) are depicted in Figure 3a. The annotations for individual glycopeptides from both plasma samples and protein standards are provided in Figure S-3. Although plasma samples are very complicated mixtures, we observe consistent MRM chromatograms for the protein standards and plasma digests.
Figure 3.
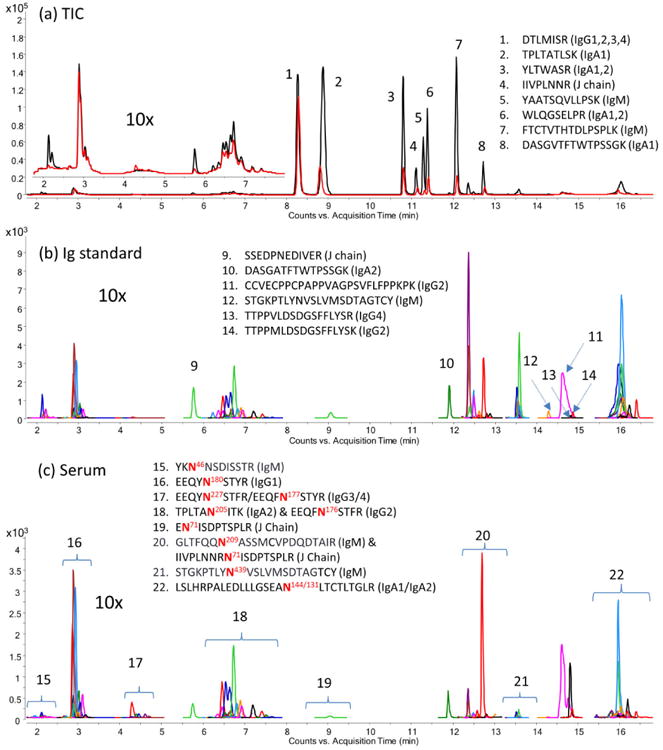
(a) Total MRM chromatogram for the protein standard mixture (black trace) and the pooled serum sample (red trace). Extracted MRM chromatograms of protein standards (b) and the pooled serum sample (c). The most abundant peaks correspond to peptide signals 1-8 representing the proteins shown. Lower abundance peptides corresponding to peaks 9-14, and glycosites corresponding to signal 15-22. The eight most abundant peptide signals were removed intentionally to magnify the glycopeptide and peptide signals in (b) and (c). Glycopeptides were separated on the basis of their peptide backbone using the C18 stationary phase, and the detail glycoform annotation is provided in Figure S-3.
Applications
Glycoprotein analysis by mass spectrometry of biological samples, such as plasma, is hampered by the sample complexity and the low concentrations in protein glycosylations. Protein or glycan enrichment is thus widely employed in glycan analysis.6, 16, 28 For example, IgG proteins are usually enriched using protein G and/or protein A prior to glycosylation analysis.16 Glycoprotein/glycopeptide enrichments using lectin or hydrophilic interaction liquid chromatography (HILIC) are also common.44, 50 However, there are several concerns regarding these enrichment procedures. The most prominent ones include sample loss, reproducibility, and potentially enrichment bias for particular types of glycans. To this end, direct analysis of proteins in serum without enrichment is an attractive technique. Utilizing the power of targeted MRM techniques, we found that IgG, IgA, IgM, and their glycosylation can be monitored directly from serum without any protein enrichment or sample cleanup.
Application of Method to Healthy Human Serum
To determine the IgG, IgA and IgM abundances with their glycoforms in the general population, the MRM method was applied to the serum of 13 healthy individuals and a pooled commercial serum sample (Sigma-Aldrich, St. Louis, MO). The peptide calibration curves used for label-free absolute quantitation are shown in Figure S-4 The Ig concentrations in the Sigma serum sample were 14.9 ± 2.6 mg/mL (determined using peptide DTLMISR) for IgG, 2.23 ± 0.05 mg/mL (YLTWASR) for IgA, and 1.17 ± 0.04 mg/mL (FTCTVTHTDLPSPLK) for IgM. The standard deviation is based on triplicate digestions for the serum sample indicating the method repeatability. The Ig concentrations in the 13 healthy serum samples were 10.4 ± 4.7 mg/mL (DTLMISR) for IgG, 1.72 ± 0.65 mg/mL (YLTWASR) for IgA, 1.13 ± 0.63 mg/mL (FTCTVTHTDLPSPLK) for IgM. The standard deviation here represents the biological variations. The MRM quantitation results well reproduced the previously reported values using nephelometry assay for the general population, i.e. 11.2 ± 2.5 mg/mL, 2.62 ± 1.19 mg/mL, 1.47 ± 0.84 mg/mL for IgG, A, and M, respectively.51 Some discrepancies were observed that may be due to the impurity of the protein standard used. All protein standards (IgG, A, and M) were at least 95% pure. However, the fact that the MRM results are within the experimental range indicates that these impurities do not have significant impact on the glycopeptide quantitation.
IgM glycosite N439 was found to be not completely occupied according to the nanoLC-Chip/QTOF profiling and by as reported previously.32 To determine the relative un-occupancy, the un-occupied glycosites was monitored (STGKPTLYN439VSLVMSDTAGTCY, m/z 1183.1 → 342.1), and its ion abundance was normalized to the total IgM amount using the equation shown below:
| (1) |
where the un-occupied peptide is Variation in glycan abundances may be due to
| (2) |
The peptides used to represent protein abundance are DASGATFTWTPSSGK (IgA2), YLTWASR (IgA1&2), FTCTVTHTDLPSPLK (IgM), and SSEDPNEDIVER (J chain). The absolute and normalized abundance of one IgM glycopeptide is shown as representative in Figure 5. The error bar for the pooled serum sample is for three replicate digestions of the same serum sample showing a good method reproducibility (CV <20%). Figure 5 shows that the trend of absolute ion abundance does not necessarily follow the trend of the degree of protein glycosylation, i.e. high absolute ion abundance may have lower degree of glycosylation or vice versa. Indeed, the protein abundances need to be taken into account when protein specific alteration in glycosylation is monitored. Our result also shows a large biological variation in glycan expression even within the general healthy individuals (CV > 50% when using absolute glycopeptide abundance). However, if normalized to the protein content, the biological variation decreases (CV < 20%) indicating a similar degree of glycosylation across samples. Indeed, degree glycosylation yields information focused on the alternation in glycan profile. Another advantage of using this degree of glycosylation for relative comparison across samples is that missing some glycoforms will not affect the comparison across samples because the glycan signal was normalized to peptides.
Figure 5.
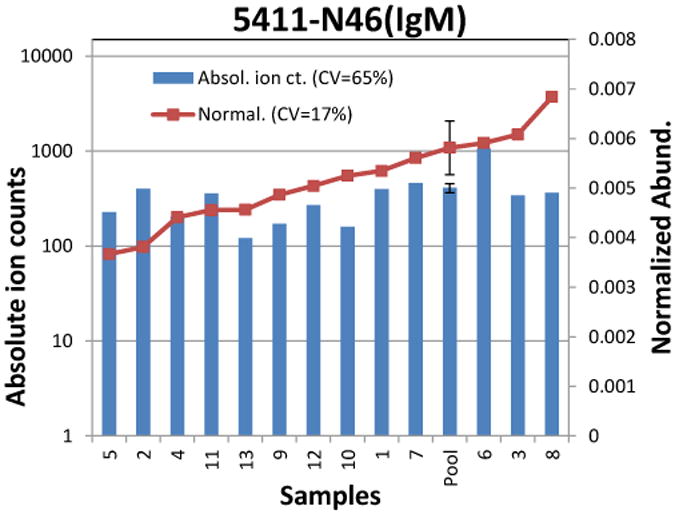
Variations in absolute ion abundances (blue bar) and normalized abundances (read square) of glycopeptide 5411 on N46 of IgM. The absolute ion abundances represent the concentrations of the glycopeptides in serum. The normalized abundances are representative of the glycan abundances relative to the protein abundance. The error bar for the pooled serum sample is from triplicate digestion experiments. The absolute ion count does not necessarily follow the normalized abundances.
The normalized glycopeptide abundances were used for relative comparison of glycoforms. Although individual glycoforms may differ in their ionization and fragmentation efficiencies in ESI-LC-MS, recent results show that the direct comparison of MS signals from the same types of glycoforms may be generally appropriate.39, 52 As shown in Figure 6, the glycosylation profile is relatively similar between the commercial pooled serum and the 13 control samples. A glycoform was excluded from the analysis if no significant MRM signal (S/N > 6) was observed for more than three individuals. Figure 6a shows the relative abundances of the three glycans identified and quantified on IgM site N46. The glycoform 5411 (Hex:HexNAc:Fuc:Neu5Ac) and 5501 are both abundant at this glycosite, while 5511 is 50% lower. Glycans observed on IgM site N209 are fucosylated and highly sialylated (Figure 6b). The bisecting glycan 5511 is the most abundant, the biantennary glycan 5411 is 50% lower and the other glycans observed, 5412, 5512, and 4511 are much less abundant (<20%) at site N209. The results show that the monosialylated and monofucosylated glycans are the major structures at site N46 and N209 which is consistent with the previous findings that monosialylated structures contribute 71% of the total glycosylation from N46, 209 and 272, the bisected structure contributes about 50%, and fucosylated structure accounts for 85%.32 Only high mannose type glycans were observed at site N439, with Man6 and Man8 being the most abundant glycoforms. The results are consistent with previous reports.32
Figure 6.
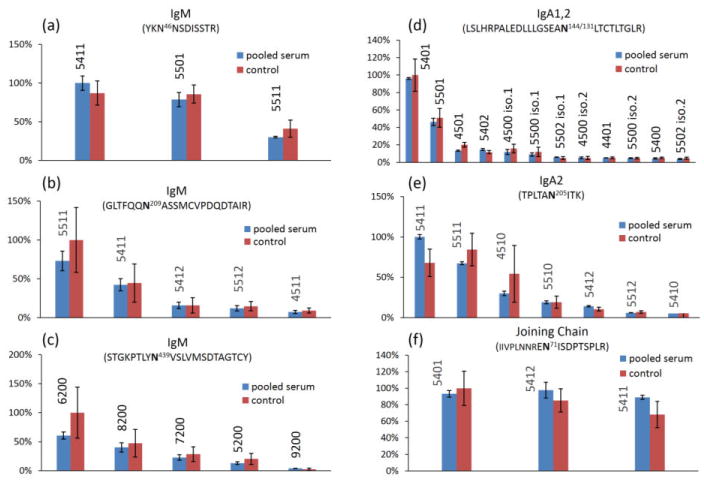
Normalized abundance of IgM and IgA glycopeptides of the pooled serum sample and the 13 serum samples. IgM glycosite N46 (a), N439 (b), N209 (c); IgA glycosite N205 (d), N144/131 (e); joining chain glycosite N71 (f). The error bar for pooled serum sample is from triplicate digestions of the same serum. The error bar for the 13 control samples represents the biological variation. (Blue bar) pooled serum sample; (Red bar) 13 control serum samples. The glycan composition is annotated above the histogram, e.g. 5411 corresponds to Hex5HexNAc4Fuc1Neu5Ac1.
For IgA, glycoform 5401 and 5501 are the major components of the 12 glycoforms quantified at site N144/131, while 5411, 5511, and 4510 are the top three abundant glycoforms (7 glycoforms quantified in total) at site N205. The result was consistent with the previous findings that mono-sialylated bisecting and bi-antennary glycans are the two major glycan components attached to serum IgA.53, 54 Result shown in Figure 6f is also consistent with the previous findings that the bi-antennary glycans 5401, 5412, and 5411 are the three major structures at the joining chain.32, 55
Method Validation
Linearity and Limit of Detection
A serial dilution for a standard protein mixture which contains 0.30, 0.20, and 0.17 mg/mL of IgG, IgA, and IgM, respectively, was performed to study the linearity and limit of detections of the MRM method. Eight different concentrations as listed in the experimental section were examined, and linear regressions were performed. As depicted in Figure S-4, the linear range spans three orders of magnitude (R2 > 0.995) for all peptides used in absolute quantitation. The limit of quantitation (LOQ) is defined as a signal-to-noise (S/N) ratio over 6. The results provided in Figure S-4 show that the LOQ for IgA (MW = 160 kDa) is one femtomole using peptide, YLTWASR, and 10 femtomole using peptide, WLQGSELPR. The LOQ for IgM (MW = 190 kDa) is one femtomole for both peptides monitored, i.e. YAATSQVLLPSK and FTCTVTHTDLPSPLK. Similar MRM sensitivities were obtained for IgG in the previous study.39 While there are several peptide candidates for quantitation, peptides YLTWASR and FTCTVTHTDLPSPLK were studied for absolute quantitation of IgA and IgM, respectively, because they yielded the highest MRM responses. Although the linear range and LOQ of individual glycopeptides is hard to validate due to the lack of glycopeptide standards, the experiment as discussed below indicates that there is a linear relationship for glycopeptide MRM signal over a range of 0-50 μg/mL added protein standards.
Matrix Effects
Standard addition experiment takes matrix effect into account, producing more accurate quantitation. Five additional concentration levels as explained in the supplementary information were examined to evaluate the matrix effects. The resulting calibration curves (Figure S-5) show good linearity, R2 > 0.95, over the concentration window examined. The protein concentrations obtained from the standard addition experiment are 2.55 ± 0.14 and 1.27 ± 0.09 mg/mL, compared to 2.23 ± 0.05 and 1.17 ± 0.04 mg/mL obtained from standard curves for IgA and IgM, respectively. The difference is within 10%, which indicates very limited matrix effects and interference signals. Similar result were obtained with IgG.39
Method Repeatability
Method reproducibility plays a key role in quantitation analysis of large sample sets. Good reproducibility generally increases the method sensitivity in distinguishing small changes across samples with a higher confidence level. The instrument repeatability was thus evaluated by injecting the same tryptic serum sample 11 times spanning over a 24 hour period. As shown in Figure S-6a, our instrument yielded excellent repeatability throughout the run (CV < 5%). To study the intraday repeatability of trypsin digestions, 10 replicate trypsin digestions were performed for the same serum sample in the same day. The result shown in Figure S-6b indicates a good intraday repeatability for our enzyme digestion (CV ≤ 10%). The interday repeatability generally shows relatively larger variation, which may due to the differences in bench-top conditions, such as temperature and pressure. However, only the peptides that show relatively good interday repeatability (CV ≤ 15%) were selected for protein quantitation. These peptides were very likely to have little or no amino acid modifications and or missed-cleavages.
Comparison of Enrichment and direct analysis
To illustrate this method of direct analysis, serum IgA and IgM were quantified both with and without pre-enrichment. The results are summarized in Figure S-6. In the direct analysis, 2 μL of serum was digested in 100 μL 50 mM NH4HCO3 and the sample was injected directly for MRM quantitation. In the enrichment experiment, IgA and IgM proteins were first immunoprecipitated from 5 μL of serum using anti-IgA/IgM antibodies, and then digested in 50 μL 50 mM NH4HCO3 for MS analysis. The protein abundance is approximately five fold higher in the enrichment experiment than in the direct analysis. However, as illustrated in Figure S-6c, the two methods yield similar MRM signals indicating a relatively large sample loss in the enrichment method. Our SDS-PAGE result indicates a near complete depletion of other serum proteins and a significant increase of IgA/M signal after enrichment. The sample loss may be due to inefficient binding of IgA/M to the resin. Increase resin to sample ratio may reduce sample loss, although only the manufacturer suggested protocol was tested in our experiment.
The repeatability of enrichment experiment is illustrated in Figure S-6c. The result shows a relatively larger variation for the protein enrichment experiment (CV of 20% vs 10% for the direct analysis as shown in Figure S-6c, 6b. The same peptides were observed in all three sets, however direct analysis is not only far easier and faster, but it is also less costly and yields better reproducibility.
Conclusion
There has previously been a lack of complete glycan map for even the most abundant serum glycoproteins. There is further no general technique for quantitating protein-specific glycosylation. We employed MRM for the quantitation of proteins and their glycosylation directly from human serum without sample enrichment. Although glycan enrichment increases the sensitivity and specificity of glycosylation analysis, sample loss and cost is a big concern. Targeted MRM is attractive because of its capability in detecting low abundant compounds directly in complicated mixtures. Site-specific glycosylation analysis can now be performed on serum proteins to quantitate both proteins and glycans simultaneously. The result shows a low femtomole limit of quantitation for IgG, IgA and IgM protein. The direct analysis using MRM provide higher reproducibility and less sample loss, which makes it a robust technique for biomarker discovery studies. Furthermore, the use of UPLC allows rapid analysis (<20 minutes per sample) requiring only about 2 μL of serum. This method will be useful for biomarker discovery and for understanding the role of glycosylation in specific proteins.
Supplementary Material
Figure S-1: MRM chromatogram for transferrin and haptoglobin
Figure S-2: Tandem Spectrum of Peptides and glycopeptides
Figure S-3: Glycopeptide annotation for Figure 3
Figure S-4: Peptide Calibration Curves
Figure S-5: Study of Method Reproducibility
Figure S-6: Standard Addition Experiment
Table S-1: IgG MRM transitions
Figure 4.
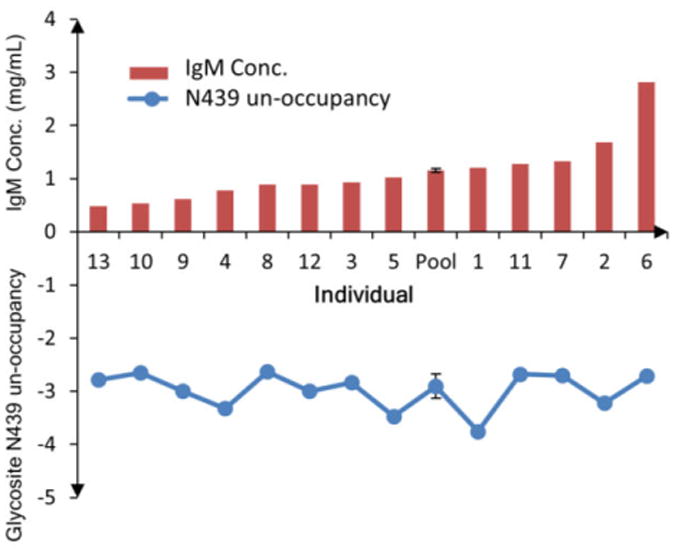
Determination of relative site occupancy for 439N of IgM. The ion abundance of non-glycosylated peptide STGKPTLYNVSLVMSDTAGTCY was normalized to the quantitating peptide FTCTVTHTDLPSPLK using equation (1). Each bar corresponds to a specific individual (1-13) and a pooled serum sample (Pool). The red bar is the IgM concentration, and the blue circle is the peptide abundance normalized to the total protein abundance as calculated by the quantitating peptide. The pooled serum sample was analyzed in triplicate digestion and LC/MS analysis, and the standard deviation was represented by the error bar. The biological variation in protein abundances was high (CV = 50%), however the relative glycosylation occupancy for this site was very similar across the 13 individuals (CV = 10%).
Acknowledgments
The authors are thankful for the funding provided by the National Institutes of Health (RO1 CA136647, R01HD061923, R01GM049077, and RO1AT008759). EM was supported by the BWF and by (NIH 1DP2OD008752).
References
- 1.de Leoz ML, Young LJ, An HJ, Kronewitter SR, Kim J, Miyamoto S, Borowsky AD, Chew HK, Lebrilla CB. High-mannose glycans are elevated during breast cancer progression. Molecular & cellular proteomics: MCP. 2011;10:M110 002717. doi: 10.1074/mcp.M110.002717. [DOI] [PMC free article] [PubMed] [Google Scholar]
- 2.An HJ, Kronewitter SR, de Leoz MLA, Lebrilla CB. Glycomics and disease markers. Curr Opin Chem Biol. 2009;13:601–607. doi: 10.1016/j.cbpa.2009.08.015. [DOI] [PMC free article] [PubMed] [Google Scholar]
- 3.Fujimura T, Shinohara Y, Tissot B, Pang PC, Kurogochi M, Saito S, Arai Y, Sadilek M, Murayama K, Dell A, Nishimura SI, Hakomori i. Glycosylation status of haptoglobin in sera of patients with prostate cancer vs. benign prostate disease or normal subjects. Int J Cancer. 2008;122:39–49. doi: 10.1002/ijc.22958. [DOI] [PubMed] [Google Scholar]
- 4.Chen G, Wang Y, Qiu L, Qin X, Liu H, Wang X, Wang Y, Song G, Li F, Guo Y, Li F, Guo S, Li Z. Human IgG Fc-glycosylation profiling reveals associations with age, sex, female sex hormones and thyroid cancer. Journal of Proteomics. 2012;75:2824–2834. doi: 10.1016/j.jprot.2012.02.001. [DOI] [PubMed] [Google Scholar]
- 5.Axford JS. Glycosylation and rheumatic disease. Biochimica et Biophysica Acta (BBA)-Molecular Basis of Disease. 1999;1455:219–229. doi: 10.1016/s0925-4439(99)00057-5. [DOI] [PubMed] [Google Scholar]
- 6.Bond A, Alavi A, Axford JS, Bourke BE, Bruckner FE, Kerr MA, Maxwell JD, Tweed KJ, Weldon MJ, Youinou P, Hay FC. A Detailed Lectin Analysis of IgG Glycosylation, Demonstrating Disease Specific Changes in Terminal Galactose and N-acetylglucosamine. Journal of Autoimmunity. 1997;10:77–85. doi: 10.1006/jaut.1996.0104. [DOI] [PubMed] [Google Scholar]
- 7.Mestecky J, Tomana M, Crowley-Nowick PA, Moldoveanu Z, Julian BA, Jackson S. Defective galactosylation and clearance of IgA1 molecules as a possible etiopathogenic factor in IgA nephropathy. Contributions to nephrology. 1993;104:172–82. doi: 10.1159/000422410. [DOI] [PubMed] [Google Scholar]
- 8.Hiki Y, Odani H, Takahashi M, Yasuda Y, Nishimoto A, Iwase H, Shinzato T, Kobayashi Y, Maeda K. Mass spectrometry proves under-O-glycosylation of glomerular IgA1 in IgA nephropathy. Kidney Int. 2001;59:1077–85. doi: 10.1046/j.1523-1755.2001.0590031077.x. [DOI] [PubMed] [Google Scholar]
- 9.Basset, Durand, Jamin, Clément, Pennec, Youinou, Dueymes, Roitt Increased N-Linked Glycosylation Leading to Oversialylation of Monomeric Immunoglobulin A1 from Patients with Sjögren's Syndrome. Scand J Immunol. 2000;51:300–306. doi: 10.1046/j.1365-3083.2000.00685.x. [DOI] [PubMed] [Google Scholar]
- 10.Coppo R, Amore A. Aberrant glycosylation in IgA nephropathy (IgAN) Kidney Int. 2004;65:1544–7. doi: 10.1111/j.1523-1755.2004.05407.x. [DOI] [PubMed] [Google Scholar]
- 11.Bause E. Structural requirements of N-glycosylation of proteins. Studies with proline peptides as conformational probes. Biochem J. 1983;209:331–6. doi: 10.1042/bj2090331. [DOI] [PMC free article] [PubMed] [Google Scholar]
- 12.Marino K, Bones J, Kattla JJ, Rudd PM. A systematic approach to protein glycosylation analysis: a path through the maze. Nat Chem Biol. 2010;6:713–23. doi: 10.1038/nchembio.437. [DOI] [PubMed] [Google Scholar]
- 13.Ruhaak LR, Zauner G, Huhn C, Bruggink C, Deelder AM, Wuhrer M. Glycan labeling strategies and their use in identification and quantification. Anal Bioanal Chem. 2010;397:3457–81. doi: 10.1007/s00216-010-3532-z. [DOI] [PMC free article] [PubMed] [Google Scholar]
- 14.Viseux N, Hronowski X, Delaney J, Domon B. Qualitative and Quantitative Analysis of the Glycosylation Pattern of Recombinant Proteins. Anal Chem. 2001;73:4755–4762. doi: 10.1021/ac015560a. [DOI] [PubMed] [Google Scholar]
- 15.Aldredge D, An HJ, Tang N, Waddell K, Lebrilla CB. Annotation of a serum N-glycan library for rapid identification of structures. J Proteome Res. 2012;11:1958–68. doi: 10.1021/pr2011439. [DOI] [PMC free article] [PubMed] [Google Scholar]
- 16.Wuhrer M, Stam JC, van de Geijn FE, Koeleman CA, Verrips CT, Dolhain RJ, Hokke CH, Deelder AM. Glycosylation profiling of immunoglobulin G (IgG) subclasses from human serum. Proteomics. 2007;7:4070–81. doi: 10.1002/pmic.200700289. [DOI] [PubMed] [Google Scholar]
- 17.Ahn JM, Sung HJ, Yoon YH, Kim BG, Yang WS, Lee C, Park HM, Kim BJ, Kim BG, Lee SY, An HJ, Cho JY. Integrated Glycoproteomics Demonstrates Fucosylated Serum Paraoxonase 1 Alterations in Small Cell Lung Cancer. Molecular & Cellular Proteomics. 2014;13:30–48. doi: 10.1074/mcp.M113.028621. [DOI] [PMC free article] [PubMed] [Google Scholar]
- 18.Satomi Y, Shimonishi Y, Hase T, Takao T. Site-specific carbohydrate profiling of human transferrin by nano-flow liquid chromatography/electrospray ionization mass spectrometry. Rapid Commun Mass Spectrom. 2004;18:2983–2988. doi: 10.1002/rcm.1718. [DOI] [PubMed] [Google Scholar]
- 19.Kolarich D, Weber A, Turecek PL, Schwarz HP, Altmann F. Comprehensive glycoproteomic analysis of human α1-antitrypsin and its charge isoforms. Proteomics. 2006;6:3369–3380. doi: 10.1002/pmic.200500751. [DOI] [PubMed] [Google Scholar]
- 20.Harazono A, Kawasaki N, Itoh S, Hashii N, Matsuishi-Nakajima Y, Kawanishi T, Yamaguchi T. Simultaneous glycosylation analysis of human serum glycoproteins by high-performance liquid chromatography/tandem mass spectrometry. J Chromatogr B. 2008;869:20–30. doi: 10.1016/j.jchromb.2008.05.006. [DOI] [PubMed] [Google Scholar]
- 21.Pompach P, Brnakova Z, Sanda M, Wu J, Edwards N, Goldman R. Site-specific Glycoforms of Haptoglobin in Liver Cirrhosis and Hepatocellular Carcinoma. Mol Cell Proteomics. 2013;12:1281–1293. doi: 10.1074/mcp.M112.023259. [DOI] [PMC free article] [PubMed] [Google Scholar]
- 22.Hirani S, Lambris JD, Müller-Eberhard HJ. Structural analysis of the asparagine-linked oligosaccharides of human complement component C3. Biochem J. 1986;233:613–616. doi: 10.1042/bj2330613. [DOI] [PMC free article] [PubMed] [Google Scholar]
- 23.Ritchie GE, Moffatt BE, Sim RB, Morgan BP, Dwek RA, Rudd PM. Glycosylation and the Complement System. Chem Rev (Washington, DC, U S) 2002;102:305–320. doi: 10.1021/cr990294a. [DOI] [PubMed] [Google Scholar]
- 24.Lin Z, Lo A, Simeone DM, Ruffin MT, Lubman DM. An N-glycosylation Analysis of Human Alpha-2-Macroglobulin Using an Integrated Approach. J Proteomics Bioinform. 2012;5:127–134. doi: 10.4172/jpb.1000224. [DOI] [PMC free article] [PubMed] [Google Scholar]
- 25.Imre T, Schlosser G, Pocsfalvi G, Siciliano R, Molnár-Szöllősi É, Kremmer T, Malorni A, Vékey K. Glycosylation site analysis of human alpha-1-acid glycoprotein (AGP) by capillary liquid chromatography—electrospray mass spectrometry. J Mass Spectrom. 2005;40:1472–1483. doi: 10.1002/jms.938. [DOI] [PubMed] [Google Scholar]
- 26.Treuheit MJ, Costello CE, Halsall HB. Analysis of the five glycosylation sites of human alpha 1-acid glycoprotein. Biochem J. 1992;283(Pt 1):105–12. doi: 10.1042/bj2830105. [DOI] [PMC free article] [PubMed] [Google Scholar]
- 27.Arnold JN, Radcliffe CM, Wormald MR, Royle L, Harvey DJ, Crispin M, Dwek RA, Sim RB, Rudd PM. The Glycosylation of Human Serum IgD and IgE and the Accessibility of Identified Oligomannose Structures for Interaction with Mannan-Binding Lectin. The Journal of Immunology. 2004;173:6831–6840. doi: 10.4049/jimmunol.173.11.6831. [DOI] [PubMed] [Google Scholar]
- 28.Bakovic MP, Selman MH, Hoffmann M, Rudan I, Campbell H, Deelder AM, Lauc G, Wuhrer M. High-throughput IgG Fc N-glycosylation profiling by mass spectrometry of glycopeptides. J Proteome Res. 2013;12:821–31. doi: 10.1021/pr300887z. [DOI] [PubMed] [Google Scholar]
- 29.Baenziger J, Kornfeld S. Structure of the Carbohydrate Units of IgA1 Immunoglobulin: I. Composition, Glycopeptide Isolation, and Structure of The Asparagine-Linked Oligosaccharide Units. J Biol Chem. 1974;249:7260–7269. [PubMed] [Google Scholar]
- 30.Zhao J, Qiu W, Simeone DM, Lubman DM. N-linked Glycosylation Profiling of Pancreatic Cancer Serum Using Capillary Liquid Phase Separation Coupled with Mass Spectrometric Analysis. J Proteome Res. 2007;6:1126–1138. doi: 10.1021/pr0604458. [DOI] [PubMed] [Google Scholar]
- 31.Mattu TS, Pleass RJ, Willis AC, Kilian M, Wormald MR, Lellouch AC, Rudd PM, Woof JM, Dwek RA. The Glycosylation and Structure of Human Serum IgA1, Fab, and Fc Regions and the Role of N-Glycosylation on Fcα Receptor Interactions. J Biol Chem. 1998;273:2260–2272. doi: 10.1074/jbc.273.4.2260. [DOI] [PubMed] [Google Scholar]
- 32.Arnold JN, Wormald MR, Suter DM, Radcliffe CM, Harvey DJ, Dwek RA, Rudd PM, Sim RB. Human Serum IgM Glycosylation: Identification of Glycoforms That Can Bind to Mannan-Binding Lectin. J Biol Chem. 2005;280:29080–29087. doi: 10.1074/jbc.M504528200. [DOI] [PubMed] [Google Scholar]
- 33.Strum JS, Nwosu CC, Hua S, Kronewitter SR, Seipert RR, Bachelor RJ, An HJ, Lebrilla CB. Automated assignments of N- and O-site specific glycosylation with extensive glycan heterogeneity of glycoprotein mixtures. Anal Chem. 2013;85:5666–75. doi: 10.1021/ac4006556. [DOI] [PMC free article] [PubMed] [Google Scholar]
- 34.Song E, Pyreddy S, Mechref Y. Quantification of glycopeptides by multiple reaction monitoring liquid chromatography/tandem mass spectrometry. Rapid Commun Mass Spectrom. 2012;26:1941–1954. doi: 10.1002/rcm.6290. [DOI] [PMC free article] [PubMed] [Google Scholar]
- 35.Kurogochi M, Matsushista T, Amano M, Furukawa Ji, Shinohara Y, Aoshima M, Nishimura SI. Sialic Acid-focused Quantitative Mouse Serum Glycoproteomics by Multiple Reaction Monitoring Assay. Mol Cell Proteomics. 2010;9:2354–2368. doi: 10.1074/mcp.M110.000430. [DOI] [PMC free article] [PubMed] [Google Scholar]
- 36.Hülsmeier AJ, Paesold-Burda P, Hennet T. N-Glycosylation Site Occupancy in Serum Glycoproteins Using Multiple Reaction Monitoring Liquid Chromatography-Mass Spectrometry. Mol Cell Proteomics. 2007;6:2132–2138. doi: 10.1074/mcp.M700361-MCP200. [DOI] [PubMed] [Google Scholar]
- 37.Sanda M, Pompach P, Brnakova Z, Wu J, Makambi K, Goldman R. Quantitative liquid chromatography-mass spectrometry-multiple reaction monitoring (LC-MS-MRM) analysis of site-specific glycoforms of haptoglobin in liver disease. Mol Cell Proteomics. 2013;12:1294–305. doi: 10.1074/mcp.M112.023325. [DOI] [PMC free article] [PubMed] [Google Scholar]
- 38.Sanda M, Pompach P, Brnakova Z, Wu J, Makambi K, Goldman R. Quantitative Liquid Chromatography-Mass Spectrometry-Multiple Reaction Monitoring (LC-MS-MRM) Analysis of Site-specific Glycoforms of Haptoglobin in Liver Disease. Mol Cell Proteomics. 2013;12:1294–1305. doi: 10.1074/mcp.M112.023325. [DOI] [PMC free article] [PubMed] [Google Scholar]
- 39.Hong Q, Lebrilla CB, Miyamoto S, Ruhaak LR. Absolute quantitation of immunoglobulin g and its glycoforms using multiple reaction monitoring. Anal Chem. 2013;85:8585–93. doi: 10.1021/ac4009995. [DOI] [PMC free article] [PubMed] [Google Scholar]
- 40.Kronewitter SR, An HJ, de Leoz ML, Lebrilla CB, Miyamoto S, Leiserowitz GS. The development of retrosynthetic glycan libraries to profile and classify the human serum N-linked glycome. Proteomics. 2009;9:2986–2994. doi: 10.1002/pmic.200800760. [DOI] [PMC free article] [PubMed] [Google Scholar]
- 41.Nwosu CC, Seipert RR, Strum JS, Hua SS, An HJ, Zivkovic AM, German BJ, Lebrilla CB. Simultaneous and Extensive Site-specific N- and O-Glycosylation Analysis in Protein Mixtures. J Proteome Res. 2011;10:2612–2624. doi: 10.1021/pr2001429. [DOI] [PMC free article] [PubMed] [Google Scholar]
- 42.Arnold JN, Wallis R, Willis AC, Harvey DJ, Royle L, Dwek RA, Rudd PM, Sim RB. Interaction of mannan binding lectin with alpha2 macroglobulin via exposed oligomannose glycans: a conserved feature of the thiol ester protein family? J Biol Chem. 2006;281:6955–63. doi: 10.1074/jbc.M511432200. [DOI] [PubMed] [Google Scholar]
- 43.Ramachandran P, Boontheung P, Xie Y, Sondej M, Wong DT, Loo JA. Identification of N-Linked Glycoproteins in Human Saliva by Glycoprotein Capture and Mass Spectrometry. J Proteome Res. 2006;5:1493–1503. doi: 10.1021/pr050492k. [DOI] [PubMed] [Google Scholar]
- 44.Picariello G, Ferranti P, Mamone G, Roepstorff P, Addeo F. Identification of N-linked glycoproteins in human milk by hydrophilic interaction liquid chromatography and mass spectrometry. Proteomics. 2008;8:3833–3847. doi: 10.1002/pmic.200701057. [DOI] [PubMed] [Google Scholar]
- 45.Kerr MA. The structure and function of human IgA. Biochem J. 1990;271:285–96. doi: 10.1042/bj2710285. [DOI] [PMC free article] [PubMed] [Google Scholar]
- 46.Mellquist JL, Kasturi L, Spitalnik SL, Shakin-Eshleman SH. The Amino Acid Following an Asn-X-Ser/Thr Sequon Is an Important Determinant of N-Linked Core Glycosylation Efficiency. Biochemistry. 1998;37:6833–6837. doi: 10.1021/bi972217k. [DOI] [PubMed] [Google Scholar]
- 47.Huhn C, Selman MH, Ruhaak LR, Deelder AM, Wuhrer M. IgG glycosylation analysis. Proteomics. 2009;9:882–913. doi: 10.1002/pmic.200800715. [DOI] [PubMed] [Google Scholar]
- 48.Mimura Y, Ashton PR, Takahashi N, Harvey DJ, Jefferis R. Contrasting glycosylation profiles between Fab and Fc of a human IgG protein studied by electrospray ionization mass spectrometry. J Immunol Methods. 2007;326:116–126. doi: 10.1016/j.jim.2007.07.014. [DOI] [PubMed] [Google Scholar]
- 49.Selman MHJ, Derks RJE, Bondt A, Palmblad M, Schoenmaker B, Koeleman CAM, van de Geijn FE, Dolhain RJEM, Deelder AM, Wuhrer M. Fc specific IgG glycosylation profiling by robust nano-reverse phase HPLC-MS using a sheath-flow ESI sprayer interface. Journal of Proteomics. 2012;75:1318–1329. doi: 10.1016/j.jprot.2011.11.003. [DOI] [PubMed] [Google Scholar]
- 50.Calvano CD, Zambonin CG, Jensen ON. Assessment of lectin and HILIC based enrichment protocols for characterization of serum glycoproteins by mass spectrometry. J Proteomics. 2008;71:304–17. doi: 10.1016/j.jprot.2008.06.013. [DOI] [PubMed] [Google Scholar]
- 51.Gonzalez-Quintela A, Alende R, Gude F, Campos J, Rey J, Meijide LM, Fernandez-Merino C, Vidal C. Serum levels of immunoglobulins (IgG, IgA, IgM) in a general adult population and their relationship with alcohol consumption, smoking and common metabolic abnormalities. Clin Exp Immunol. 2008;151:42–50. doi: 10.1111/j.1365-2249.2007.03545.x. [DOI] [PMC free article] [PubMed] [Google Scholar]
- 52.Sinha S, Pipes G, Topp EM, Bondarenko PV, Treuheit MJ, Gadgil HS. Comparison of LC and LC/MS Methods for Quantifying N-Glycosylation in Recombinant IgGs. J Am Soc Mass Spectrom. 2008;19:1643–1654. doi: 10.1016/j.jasms.2008.07.004. [DOI] [PubMed] [Google Scholar]
- 53.Arnold JN, Wormald MR, Sim RB, Rudd PM, Dwek RA. The Impact of Glycosylation on the Biological Function and Structure of Human Immunoglobulins. Annu Rev Immunol. 2007;25:21–50. doi: 10.1146/annurev.immunol.25.022106.141702. [DOI] [PubMed] [Google Scholar]
- 54.Tanaka A, Iwase H, Hiki Y, Kokubo T, Ishii-Karakasa I, Toma K, Kobayashi Y, Hotta K. Evidence for a site-specific fucosylation of N-linked oligosaccharide of immunoglobulin A1 from normal human serum. Glycoconj J. 1998;15:995–1000. doi: 10.1023/a:1006989910120. [DOI] [PubMed] [Google Scholar]
- 55.Royle L, Roos A, Harvey DJ, Wormald MR, Van Gijlswijk-Janssen D, Redwan ERM, Wilson IA, Daha MR, Dwek RA, Rudd PM. Secretory IgA N- and O-Glycans Provide a Link between the Innate and Adaptive Immune Systems. J Biol Chem. 2003;278:20140–20153. doi: 10.1074/jbc.M301436200. [DOI] [PubMed] [Google Scholar]
- 56.Satomi Y, Shimonishi Y, Takao T. N-glycosylation at Asn491 in the Asn-Xaa-Cys motif of human transferrin. FEBS Lett. 2004;576:51–56. doi: 10.1016/j.febslet.2004.08.061. [DOI] [PubMed] [Google Scholar]
- 57.Comunale MA, Rodemich-Betesh L, Hafner J, Wang M, Norton P, Di Bisceglie AM, Block T, Mehta A. Linkage Specific Fucosylation of Alpha-1-Antitrypsin in Liver Cirrhosis and Cancer Patients: Implications for a Biomarker of Hepatocellular Carcinoma. PLoS One. 2010;5:e12419. doi: 10.1371/journal.pone.0012419. [DOI] [PMC free article] [PubMed] [Google Scholar]
- 58.Crispin MD, Ritchie GE, Critchley AJ, Morgan BP, Wilson IA, Dwek RA, Sim RB, Rudd PM. Monoglucosylated glycans in the secreted human complement component C3: implications for protein biosynthesis and structure. FEBS Lett. 2004;566:270–4. doi: 10.1016/j.febslet.2004.04.045. [DOI] [PubMed] [Google Scholar]
Associated Data
This section collects any data citations, data availability statements, or supplementary materials included in this article.
Supplementary Materials
Figure S-1: MRM chromatogram for transferrin and haptoglobin
Figure S-2: Tandem Spectrum of Peptides and glycopeptides
Figure S-3: Glycopeptide annotation for Figure 3
Figure S-4: Peptide Calibration Curves
Figure S-5: Study of Method Reproducibility
Figure S-6: Standard Addition Experiment
Table S-1: IgG MRM transitions